0030
Multi-Parametric MRI at 7 T Enables Differentiation of MS and Age-Related White Matter Lesions1Biomedical Engineering Graduate Program, University of Western Ontario, London, ON, Canada, 2Imaging Research Laboratories, Robarts Research Institute, London, ON, Canada, 3Montreal Neurological Hospital and Institute, McGill University, Montreal, QC, Canada, 4Medicine, Schulich School of Medicine & Dentistry, University of Western Ontario, London, ON, Canada, 5Department of Clinical Neurological Sciences, Schulich School of Medicine & Dentistry, University of Western Ontario, London, ON, Canada, 6Department of Medical Biophysics, University of Western Ontario, London, ON, Canada, 7Imaging Research Laboratories, Robarts Research Institute
Synopsis
MRI enables visualization of white matter lesions associated with demyelination in multiple sclerosis (MS). However, subtle white matter hyperintensities are also a sign of normal aging. This study used information collected from multiple 7T MRI contrasts at baseline and four-month follow-up time points to compare signal changes in lesions of five MS patients to those of age-related lesions (ARLs) in five healthy controls.
Introduction
MRI is conventionally applied for identifying multiple sclerosis (MS) white matter lesions (MSLs) based on T2-weighted and FLAIR images. However, the number and volume of MSLs have shown only mild correlation with clinical symptoms. This may be due to the fact that the number of white hyperintensities increases with normal aging. These aging-related lesions (ARLs) can confound a diagnosis of MS when using the McDonald criteria.1,2 Recently, multi-parametric MR images have shown promise for allowing improved visualization of active lesion substructure.3-8 In this work we analyzed multiparametric 7 T MRI data at baseline and follow-up visits for MS patients and matched healthy controls with ARLs. The aim was to develop a more complete model of MS-specific lesions.Methods
Imaging: Five female relapsing-remitting MS patients and five gender and age-matched healthy controls with ARLs were retrospectively enrolled in our study and scanned at two time points four months apart using 7 T MRI. The MR imaging protocol included a six-echo GRE sequence (0.5 x 0.5 x 1.25 mm3, TR/TE/ESP (ms): 40/3.77/4.01; FA=13°; GRAPPA R=2), a magnetization prepared FLAIR sequence and a T1-weighted magnetization prepared rapid acquisition gradient-echo (MPRAGE) sequence. The MPRAGE and FLAIR acquisitions used a 1.0 mm3 isotropic spatial resolution. Multi-Contrast Semi-Quantitative Image Processing: Multi-echo gradient echo magnitude data was reconstructed using the sum-of-squares coil combination technique. Using a non-linear least squares fitting algorithm, R2* maps were then calculated based on the magnitude data. In parallel, multi-echo phase images were unwrapped, frequency shift maps were calculated, and a preconditioned conjugate gradient algorithm was applied to calculate quantitative susceptibility (QS) maps. All images were then linearly registered9 to MPRAGE data at the baseline time point for each participant. Images were also normalized to baseline prior to analysis. Data Analysis: 7 T FLAIR images were used for manual segmentation of ARLs and MS white matter lesions. An experienced observer performed the segmentation on a slice-by-slice basis. The masks derived form this segmentation were then applied to calculate the mean normalized MPRAGE, FLAIR, R2* and QS value of each lesion at multiple time points. Additionally, visual assessment of the appearance of lesions on images with different contrast mechanisms; the volume of the lesions was also calculated. For ARLs, the location of each ARL was visualized using a three-plane viewer to ensure the ARL was not a FLAIR artifact. Statistical analysis: Lesion count and size were compared between the control and MS groups using an unpaired t-test. The inter-visit lesion intensity changes were normalized and the differences between the MSLs and ARLs in different contrasts were analyzed using multiple t-tests (p-value <0.05 was considered significant).Results
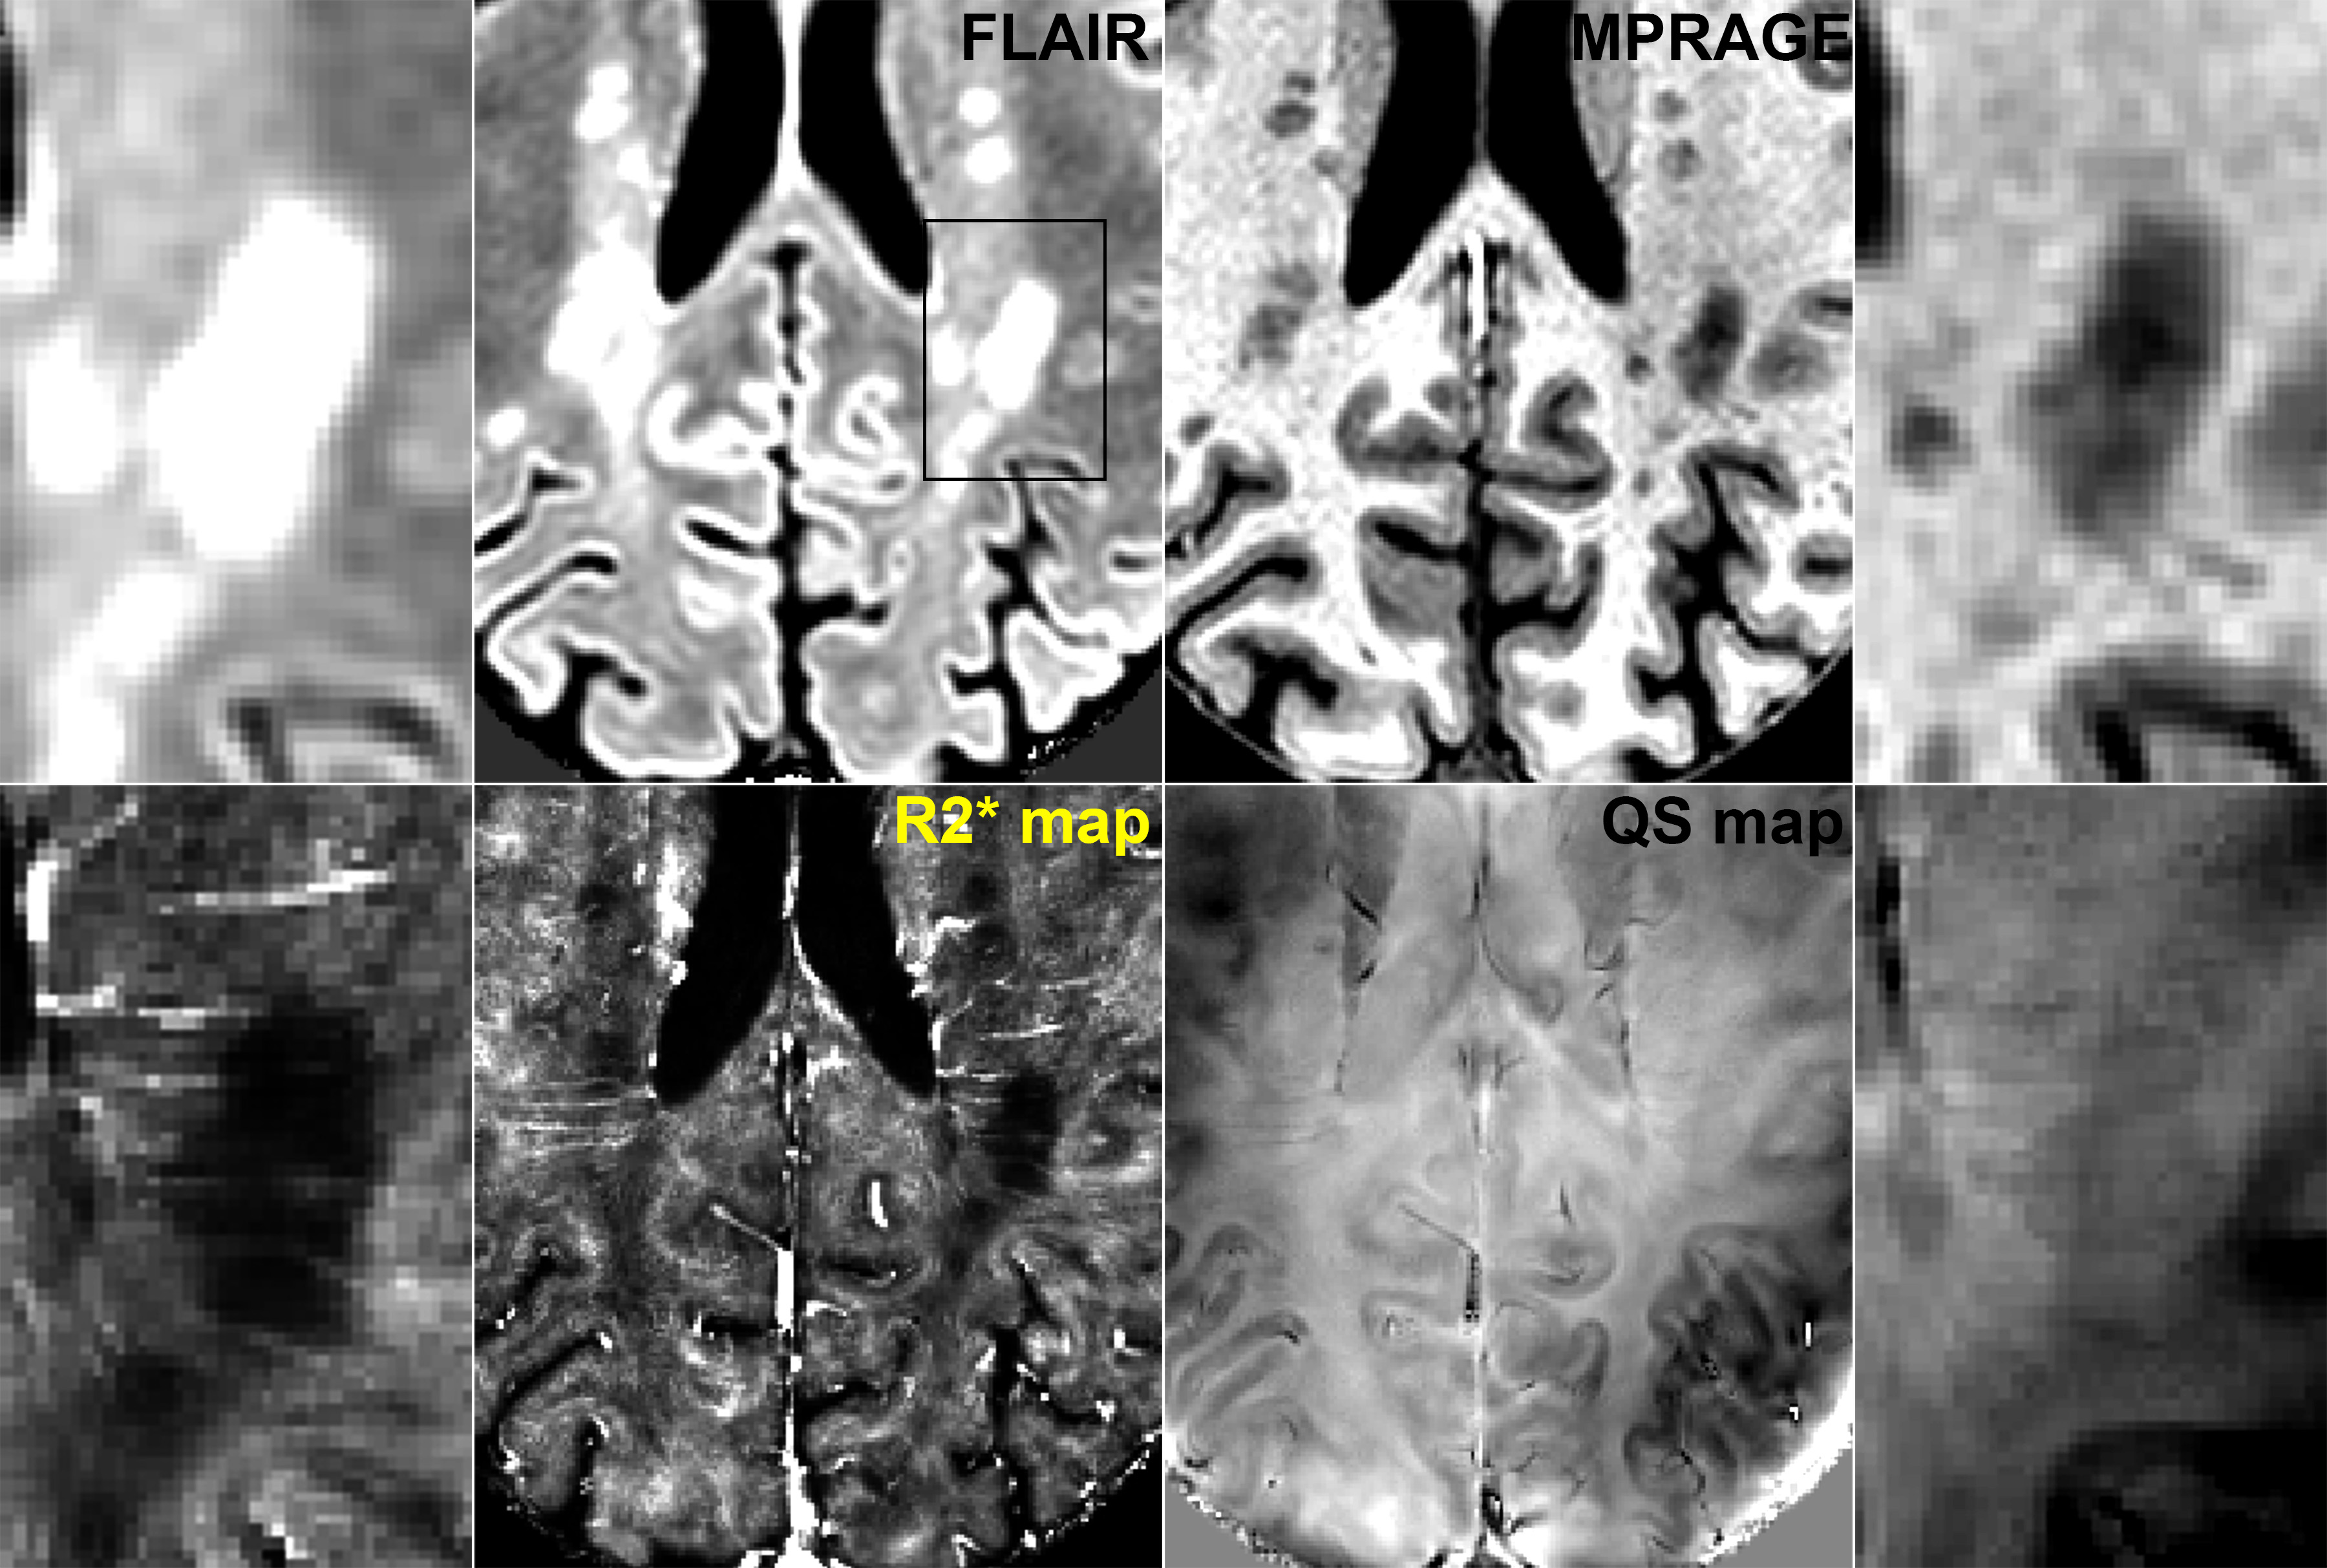
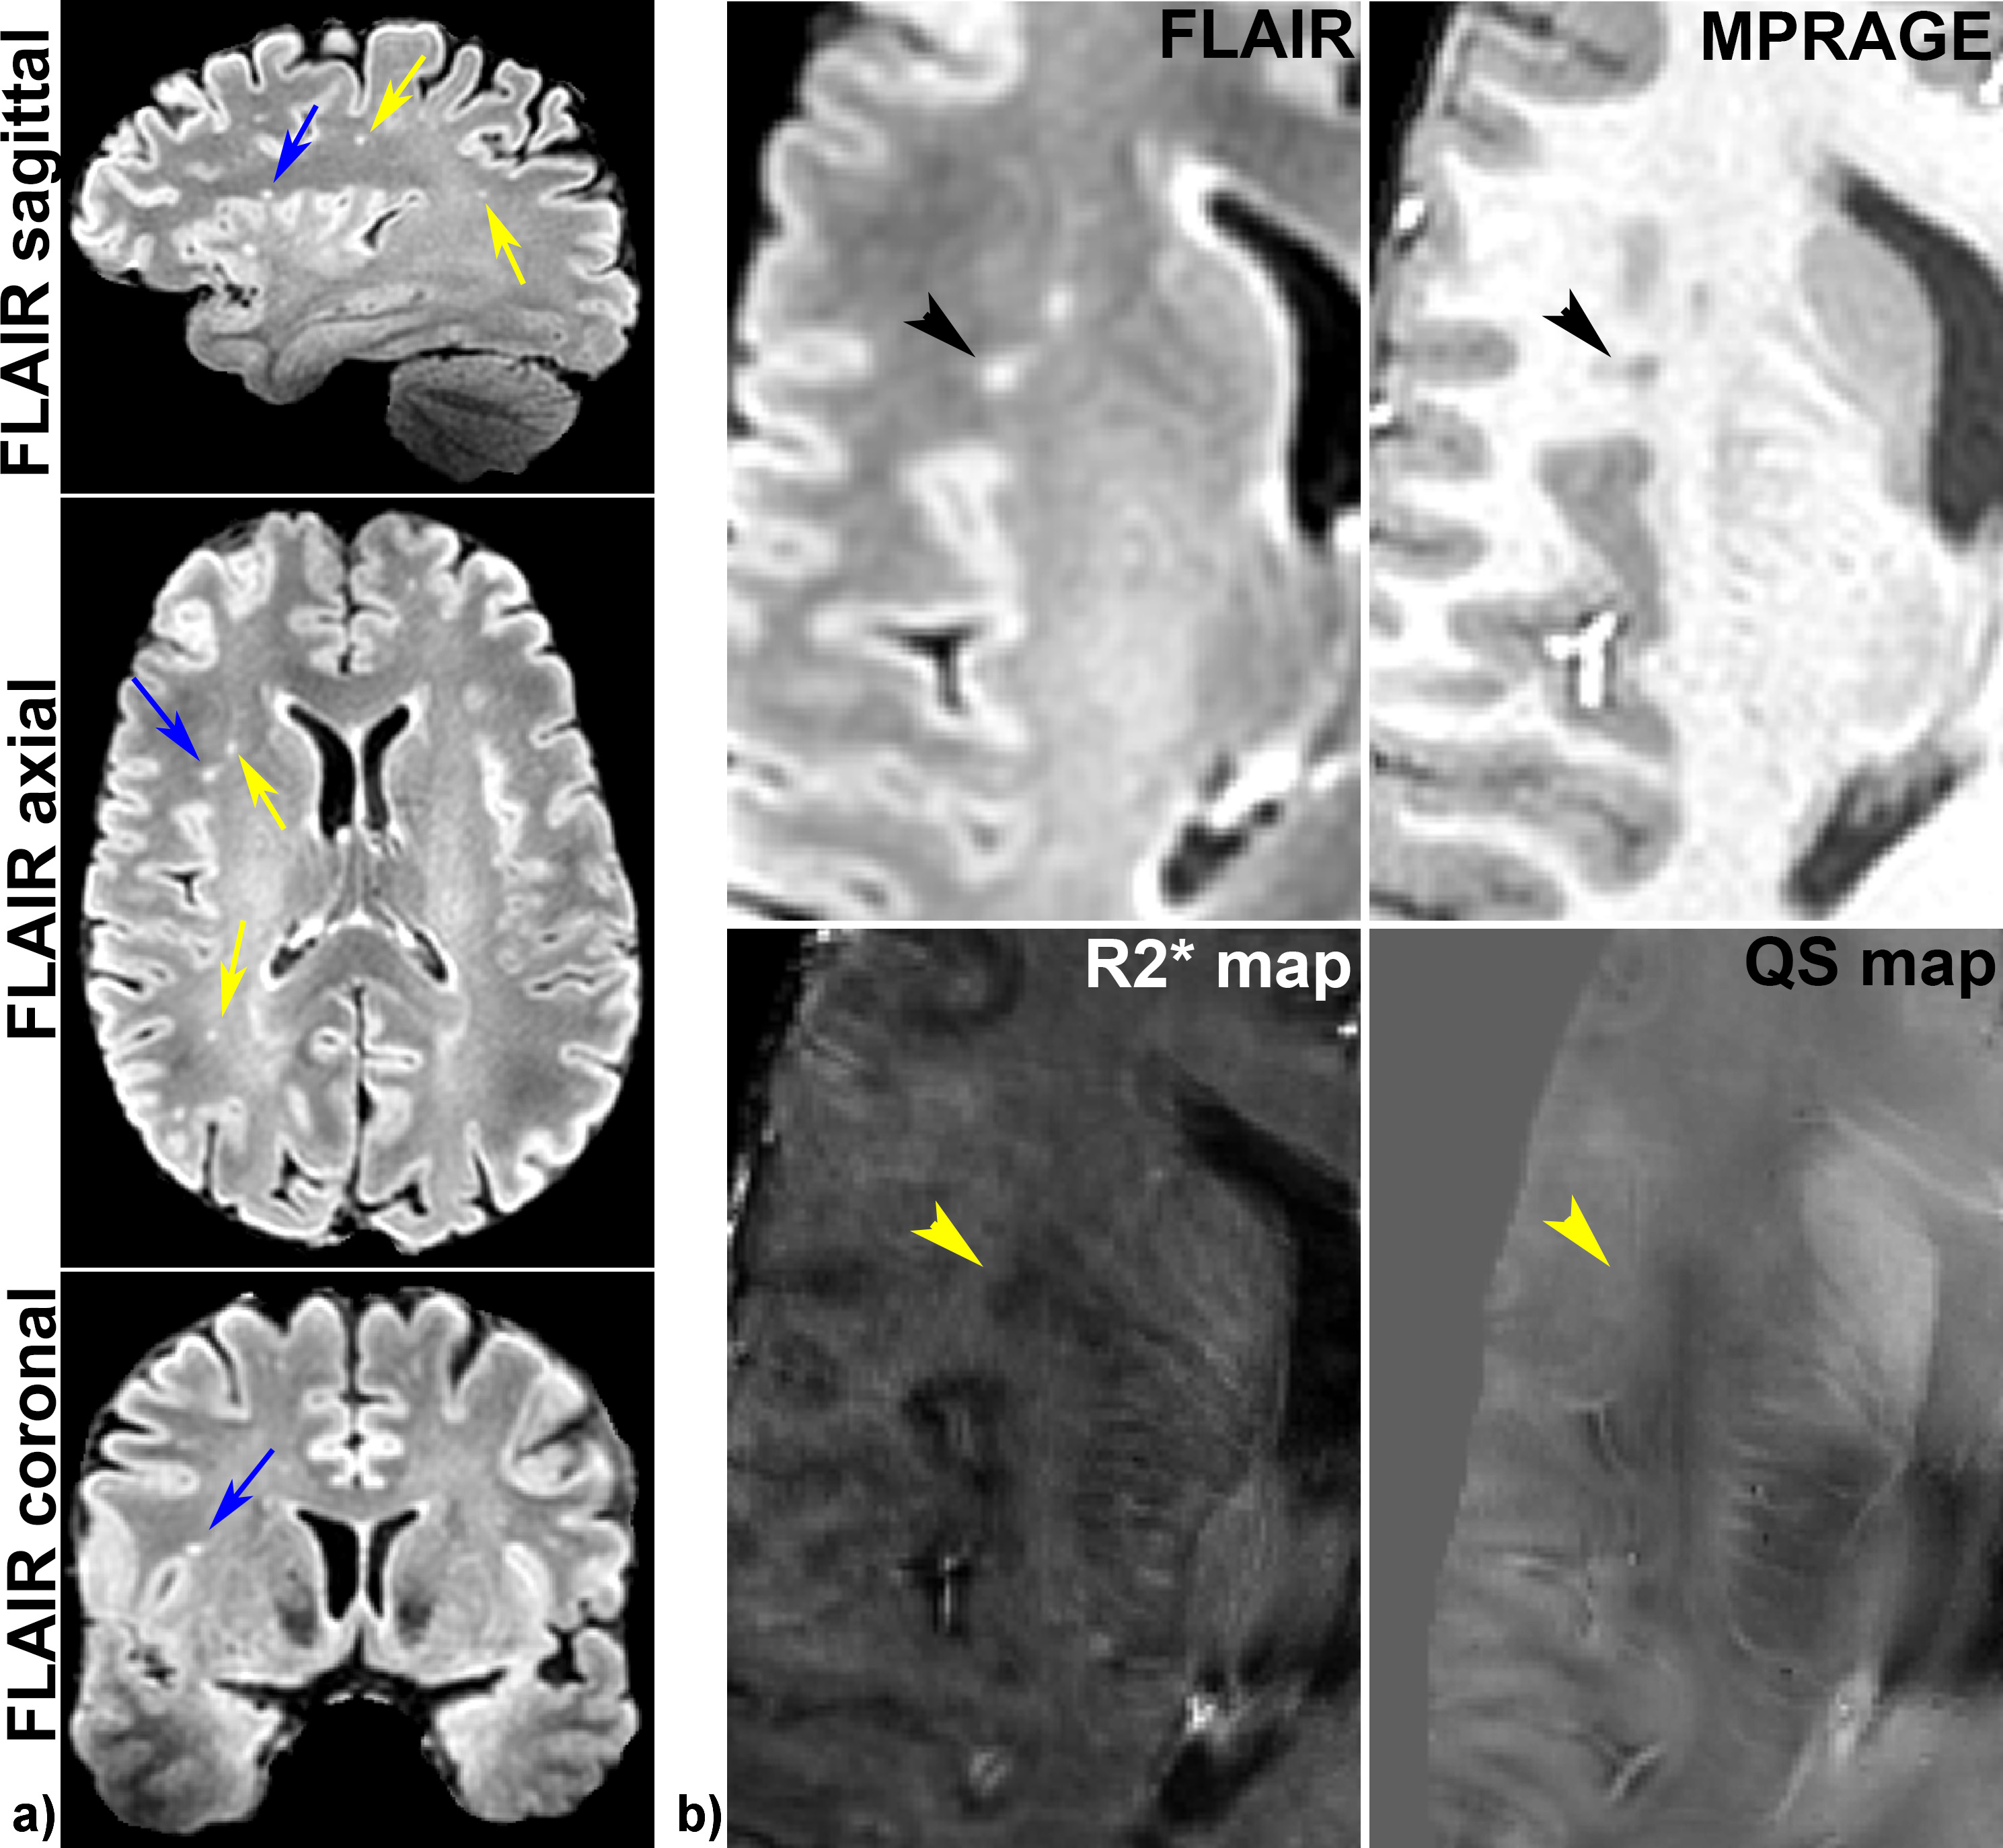
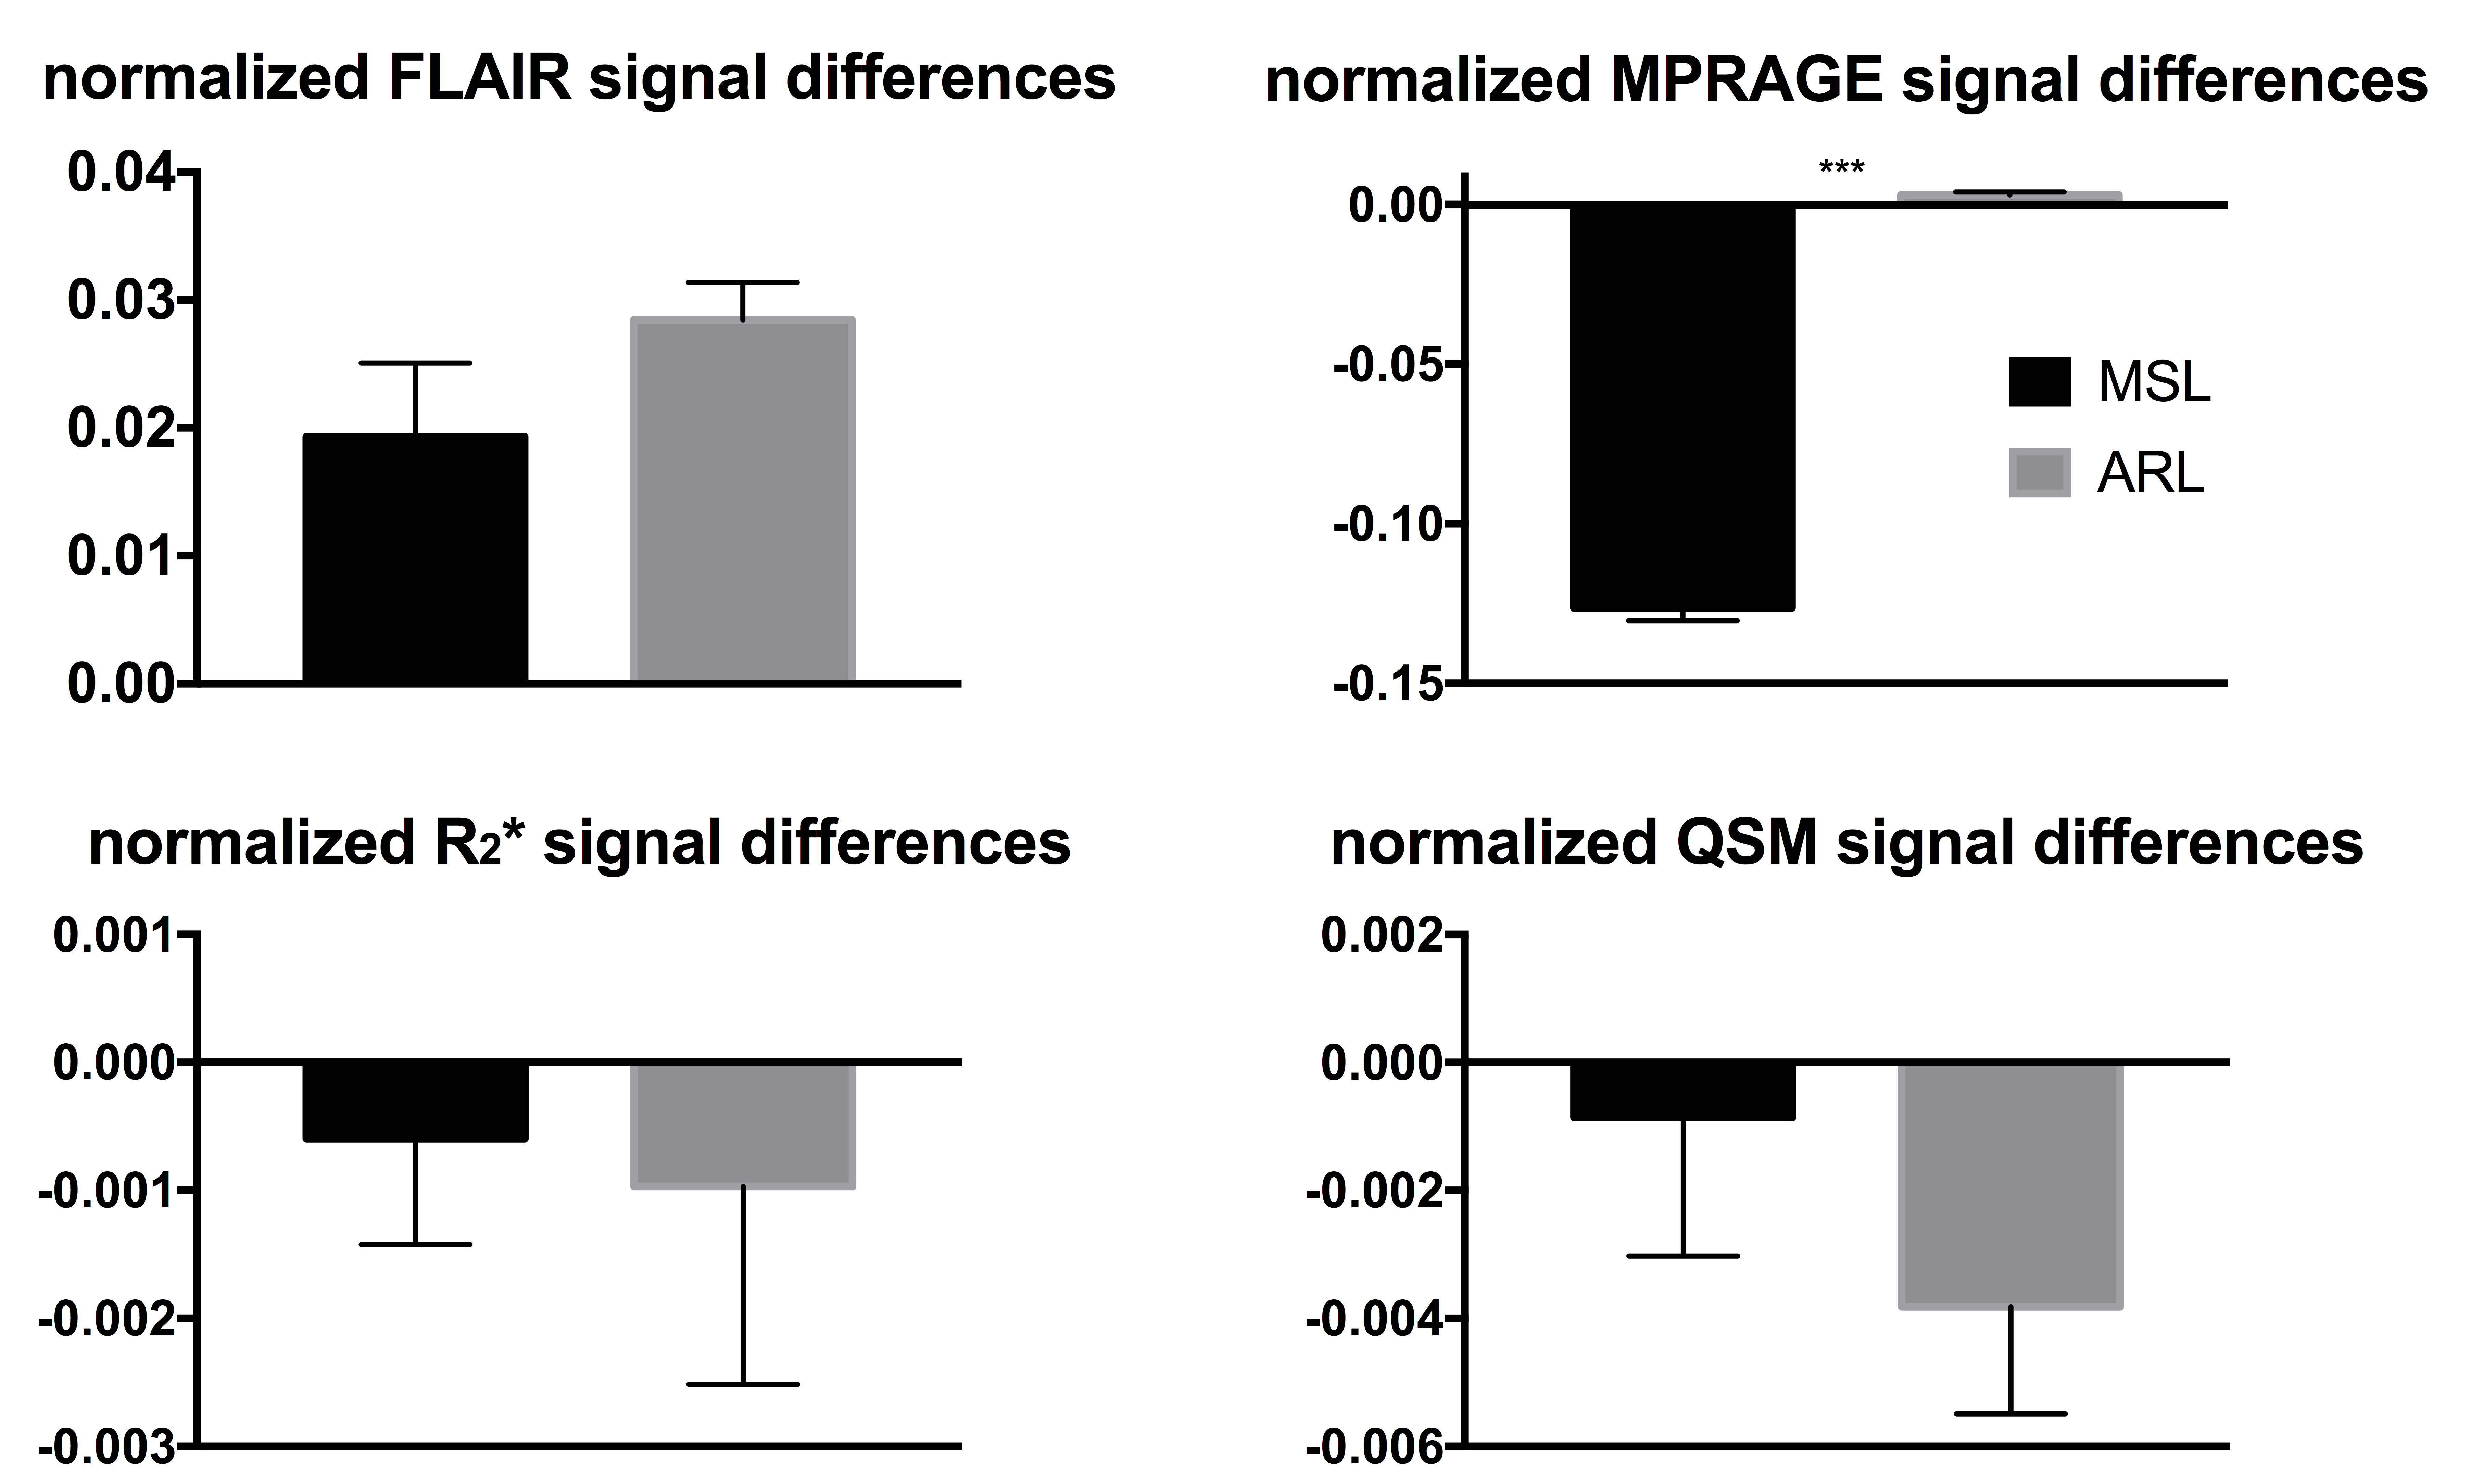
A total of 181 ARLs and 420 MSLs were analyzed in our subject cohort (p<0.05). The average size of the ARLs was 63.75 ± 33.75 mm3 (median of 53.50 mm3) while the average size of the MSLs was 86.25 ± 60 mm3 (median of 62.03 mm3, p=0.27). Figure 1 illustrates examples of MSL appearance on the four 7 T MRI contrasts. Similar examples of ARLs are shown in Fig. 2. MSLs and ARLs have the same general appearance on both FLAIR and MPRAGE contrasts, but have quite different appearance on the R2* and QS maps. This may be due to the benign nature of ARLs (arrowheads in Fig. 2 point to the lack of a strong signal variation in ARLs). Figure 3 shows the normalized, inter-visit signal change in MSLs and ARLs for the four different contrasts. Inter-visit lesion signal change on MPRAGE was significantly higher in MSLs compared to ARLs. The inter-visit signal change in the other contrasts (QSM, R2* and FLAIR) was not significant.Discussion and Conclusion
In this work, we present an analysis of multi-contrast, 7 T MR images in MS patients and controls with ARLs. We report qualitative and quantitative differences between MSLs and ARLs. There appears to be a clear benefit to utilizing multi-parametric MRI for characterizing MSLs and ARLs. In particular, FLAIR and MPRAGE may provide more relevant information about the global presentation and longitudinal evolution of lesioned white mater tissue, whereas R2* and QS maps may be more sensitive for visualization of more subtle substructure changes within lesions. Characterization of MSLs using different MR image contrasts has previously been presented.5,10 However, differentiation of normal, non-specific ARLs from WMLs remains an unsolved challenge. The findings of this study should add to the prior literature to gain better understanding of the MR imaging biomarkers of MSLs and ARLs.Acknowledgements
Z.H. acknowledges the Ontario Graduate Scholarship for funding her research. M.D. is a career investigator of the Heart and Stroke Foundation. M.D. is partially funded by the Ontario Research Fund.References
1. Polman CH, Reingold SC, Edan G, et al. Diagnostic criteria for multiple sclerosis: 2005 revisions to the “McDonald Criteria”. Annals of neurology 2005;58(6):840-846.
2. Polman CH, Reingold SC, Banwell B, et al. Diagnostic criteria for multiple sclerosis: 2010 revisions to the McDonald criteria. Annals of neurology 2011;69(2):292-302.
3. Sinnecker T, Schumacher S, Mueller K, et al. MRI phase changes in multiple sclerosis vs neuromyelitis optica lesions at 7T. Neurol Neuroimmunol Neuroinflamm 2016;3(4):e259.
4. Rudko DA, Solovey I, Gati JS, et al. Multiple Sclerosis: Improved Identification of Disease-relevant Changes in Gray and White Matter by Using Susceptibility-based MR Imaging. Radiology 2014;272(3):851-864.
5. Absinta M, Sati P, Gaitan MI, et al. Seven-tesla phase imaging of acute multiple sclerosis lesions: a new window into the inflammatory process. Ann Neurol 2013;74(5):669-678.
6. Tan LI, van Schijndel RA, Pouwels PJW, et al. MR Venography of Multiple Sclerosis. AM J Neuroradiol 2000;21:1039-1042.
7. Grabner G, Dal-Bianco A, Schernthaner M, et al. Analysis of multiple sclerosis lesions using a fusion of 3.0 T FLAIR and 7.0 T SWI phase: FLAIR SWI. J Magn Reson Imaging 2011;33(3):543-549.
8. Kau T, Taschwer M, Deutschmann H, et al. The "central vein sign": is there a place for susceptibility weighted imaging in possible multiple sclerosis? Eur Radiol 2013;23(7):1956-1962.
9. Jenkinson M, Bannister P, Brady M, et al. Improved Optimization for the Robust and Accurate Linear Registration and Motion Correction of Brain Images. NeuroImage 2002;17(2):825-841.
10. Chen W, Gauthier SA, Gupta A, et al. Quantitative Susceptibility Mapping of Multiple Sclerosis Lesions at Various Ages. Radiology 2014;271(1):183-192.
Figures