0028
Metabolic differences between asymptomatic C9orf72 carriers and non-carriers assessed by brain 7T MRSI.1Department of Neurology, Brain Center Rudolf Magnus, University Medical Center Utrecht, Utrecht, Netherlands, 2Department of Radiology, University Medical Center Utrecht, Utrecht, Netherlands
Synopsis
Amyotrophic lateral sclerosis (ALS) is an incurable and fatal neurodegenerative disease, which is caused by a C9orf72 repeat expansion in 9% of the cases. This mutation may cause changes of brain metabolism in patients but whether it affects brain metabolism in pre-symptomatic mutation carriers was not studied before. We used 7 Tesla magnetic resonance spectroscopic imaging (MRSI) to study brain metabolism in asymptomatic carriers of the C9orf72 repeat expansion and found lower concentrations of glutamate and N-acetylaspartate+N-acetylaspartylglutamate in the left putamen compared to non-carriers. This might indicate asymptomatic neuronal loss, a developmental defect or possibly a protective mechanism against ALS.
Purpose
Amyotrophic lateral sclerosis (ALS) is a devastating neurodegenerative disease that causes progressive paresis and finally, after a median disease duration of three years, death.1 The development of effective therapies is hampered by a lack of knowledge about pathophysiologic mechanisms underlying this disease. The earliest disease effects might be detected in brain metabolism of asymptomatic subjects at high risk of developing ALS.2 Asymptomatic subjects with a C9orf72 repeat expansion (carriers) were shown to have morphometric brain alterations compared to non-carriers.3 By investigating pre-symptomatic changes of brain metabolism in these subjects, we seek further insight into the pathophysiology of ALS related to this mutation.Methods
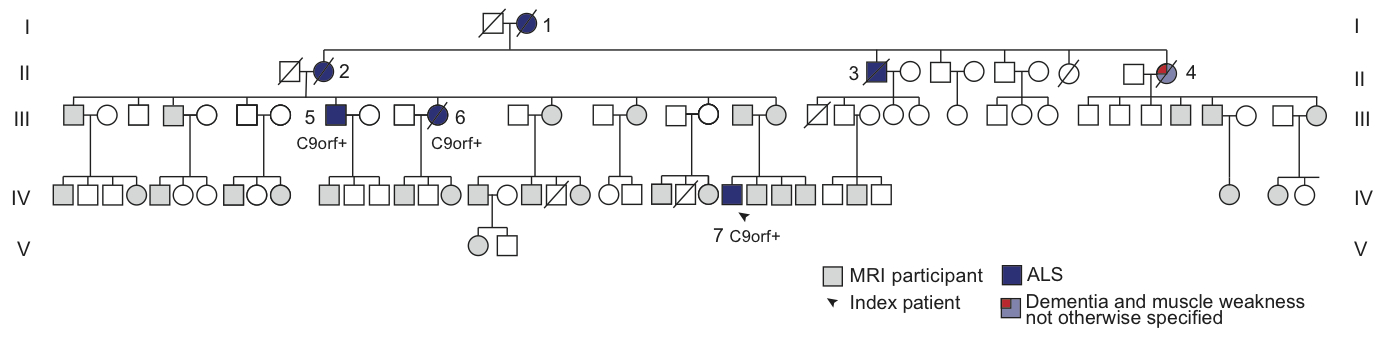
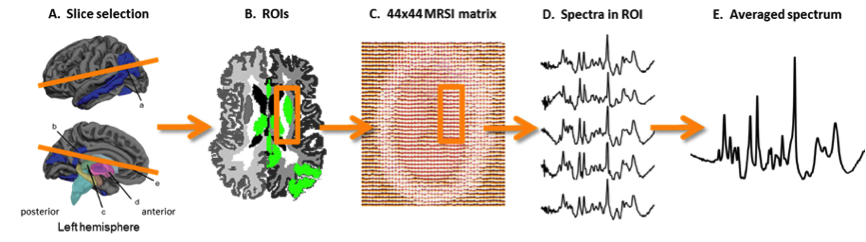
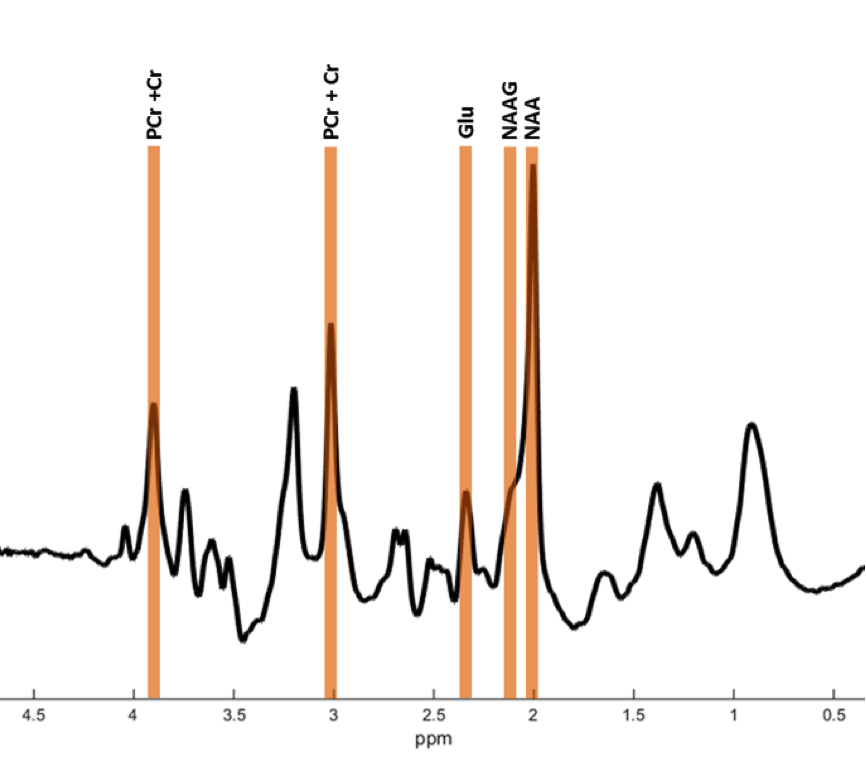
In vivo imaging of brain metabolism was performed using proton magnetic resonance spectroscopic imaging (MRSI) to compare brain metabolism of 11 asymptomatic C9orf72 repeat expansion carriers to 18 non-carriers from one large family with a history of C9orf72 related ALS (Figure 1). High resolution MRSI data of the brain was acquired at a 7 Tesla MR scanner (Philips) using a crusher coil (MR Coils) inserted into a 32 channel head coil (Nova).4 We performed a pulse-acquire MRSI experiment using the crusher coil for lipid suppression at the skull, and a CHESS water suppression sequence in which the three water-selective pulses were replaced by subject specific tailored RF pulses.5 MRSI data was acquired using a 44x44 matrix (voxels: 5x5x10 mm3, acquisition time: 7:36 minutes) intersecting the brain regions that were previously shown to have morphometric alterations (Figure 2).3 Post-processing was performed in Matlab (Mathworks Inc.). LCModel was used to fit the spectra and calculate the metabolite ratios.6 Only voxels that passed a semi-automated quality control were included in the statistical analysis (Figure 3). Finally, spectra of six brain regions were compared between carriers and non-carriers. Data was analyzed using a linear mixed model with age and proportion of grey matter as covariates and kinship as random effect. This enabled us to account for the possible dependency of the data due to family effects. Differences between carries and non-carriers were estimated and bootstrapping (10,000 samples) was used to determine 95% confidence intervals and p-values, which were considered significant if <0.05. Random-effects meta-analyses comprising all studied brain regions were performed to assess global involvement of brain metabolism.Results
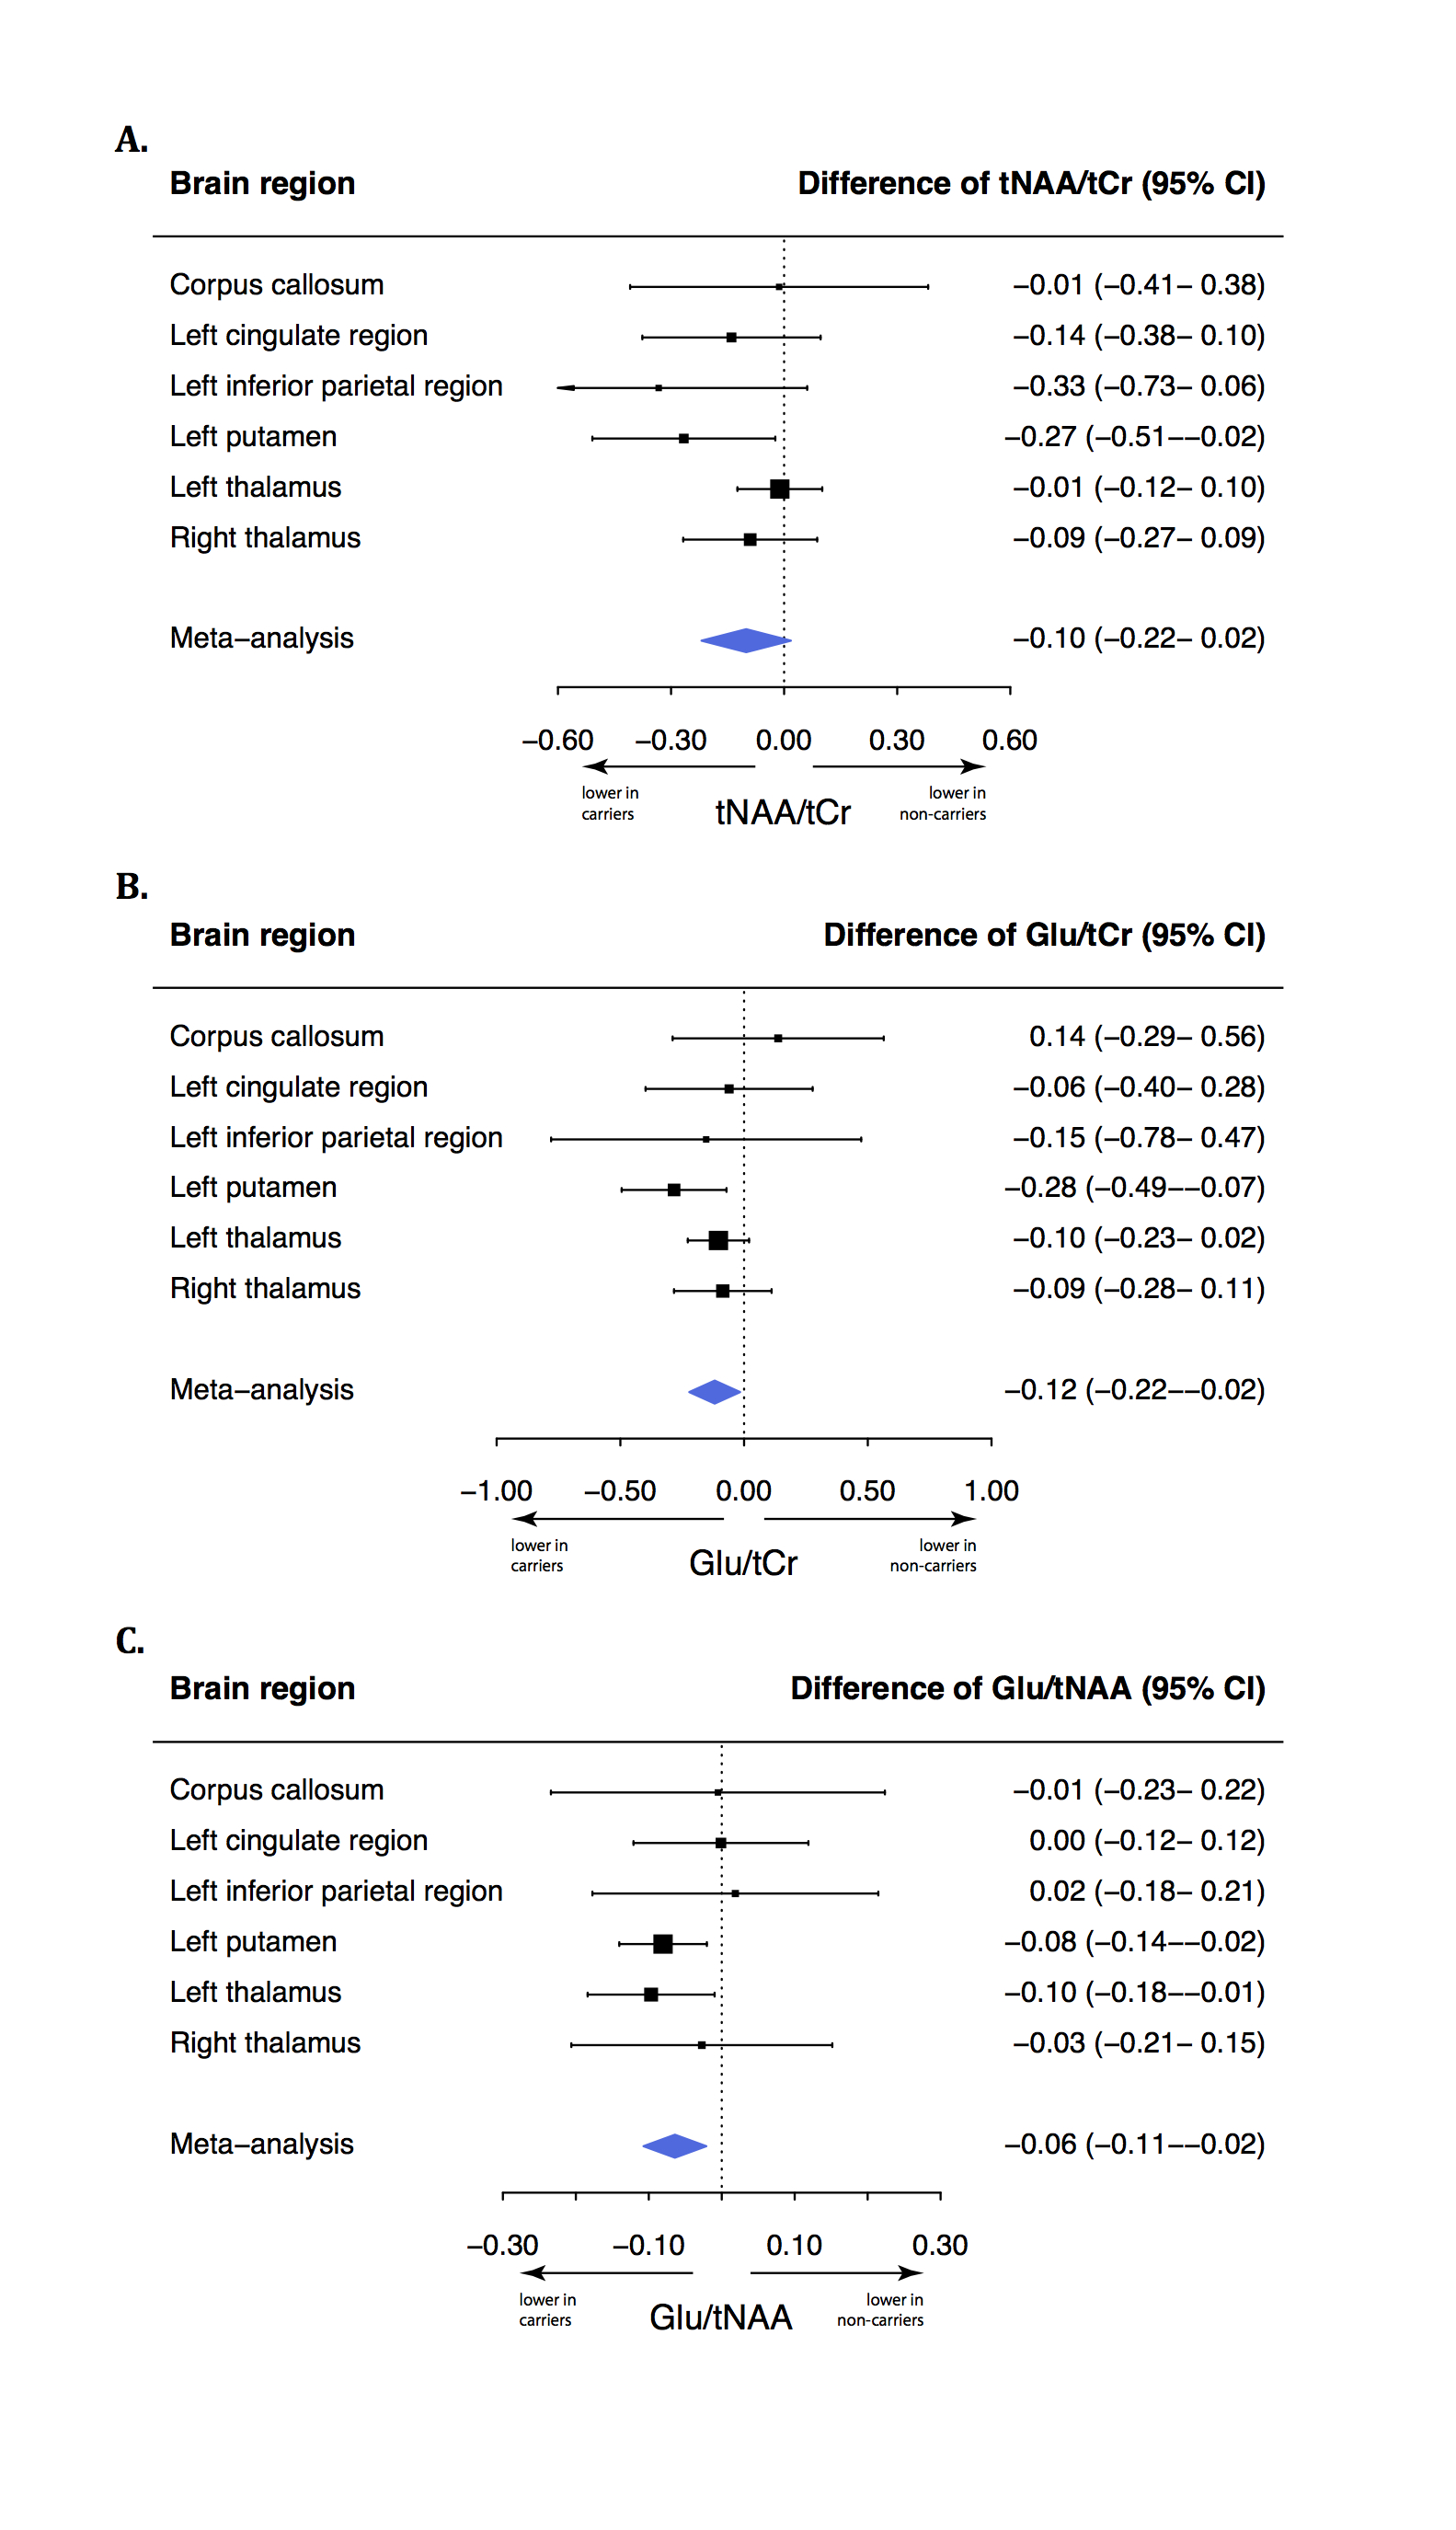
Carriers had a lower N-acetylaspartate+N-acetylaspartylglutamate (tNAA) to phosphocreatine+creatine (tCr) ratio (tNAA/tCr) in the left putamen (-0.27, 95% confidence interval [95% CI]: -0.51- -0.03, p=0.030) than non-carriers. The glutamate to tCr ratio (Glu/tCr) was also lower in the left putamen of carriers compared to non-carriers (-0.28, 95% CI: -0.50- -0.07, p=0.009). To assess differences of glutamate concentration corrected for neuronal density, we compared the Glu/tNAA ratio between carriers and non-carriers. This ratio was lower in carriers than in non-carriers in the left putamen (-0.08, 95% CI: -0.14- -0.02, p=0.009) and in the left thalamus (-0.10, 95% CI: -0.19- -0.01, p=0.027). Using meta-analyses, we combined outcomes of the six regions and showed lower tNAA/Glu (p=0.012), Glu/tCr (p=0.031) and tNAA/tCr ratios (p=0.081; Figure 4) in carriers.Discussion
Asymptomatic carriers of the C9orf72 repeat expansion have lower tNAA/Cr, Glu/tCr and Glu/tNAA ratios in the left putamen and lower Glu/tNAA in the left thalamus compared to non-carriers from the same family. Studied brain regions showed different degrees of involvement but meta-analyses showed that Glu/tCr and Glu/tNAA ratios were lower on average in carriers compared to non-carriers, suggesting more widespread brain involvement. These metabolite ratios suggest lower concentrations of neurons and glutamate in C9orf72 carriers. While excitotoxicity due to increased glutamate concentration is one of the suggested disease mechanisms in ALS1, we observed a lower glutamate concentration in carriers. This finding is in line with previous observations in mutated but pre-symptomatic mice and in vitro experiments.7 Different hypotheses could be applied: 1). Lower glutamate and tNAA concentrations might indicate a developmental defect; 2). Lower glutamate concentrations might be a protective mechanism of carriers against ALS and reflect that they were asymptomatic; 3). The combination of lower neuronal density and glutamate concentration might indicate ongoing but yet asymptomatic neuronal death of particularly glutamatergic neurons, possibly due to increased glutamate sensitivity.8 These findings provide insight in brain metabolism of asymptomatic C9orf72 repeat expansion carriers in vivo.Conclusion
We showed that the C9orf72 repeat expansion affects brain metabolism of asymptomatic subjects at high risk for developing ALS. The pattern of involved brain metabolites suggests that carriers have a lower concentration of neurons and a lower glutamate concentration per neuron compared to non-carriers. These metabolic alterations might be important biomarkers to monitor treatment effects in future trials in pre-symptomatic carriers.Acknowledgements
No acknowledgement found.References
1. Kiernan MC, Vucic S, Cheah BC, et al. Amyotrophic lateral sclerosis. Lancet 2011; 377(9769): 942-55.
2. Schuster C, Elamin M, Hardiman O, Bede P. Presymptomatic and longitudinal neuroimaging in neurodegeneration--from snapshots to motion picture: a systematic review. Journal of neurology, neurosurgery, and psychiatry 2015; 86(10): 1089-96.
3. Walhout R, Schmidt R, Westeneng HJ, et al. Brain morphologic changes in asymptomatic C9orf72 repeat expansion carriers. Neurology 2015; 85(20): 1780-8.
4. Boer VO, van de Lindt T, Luijten PR, Klomp DW. Lipid suppression for brain MRI and MRSI by means of a dedicated crusher coil. Magn Reson Med 2015; 73(6): 2062-8.
5. Ma J, Wismans C, Cao Z, Klomp DWJ, Wijnen JP, Grissom W. Tailored Spiral In-Out Spectral-Spatial Saturation Pulses for Short and Effective Water Suppression in High Resolution MRSI. Abstract # 1012, ISMRM, 24th Scientific meeting and exhibition, Singapore, Singapore 2016.
6. Provencher SW. Automatic quantitation of localized in vivo 1H spectra with LCModel. NMR Biomed 2001; 14(4): 260-4.
7. Devlin AC, Burr K, Borooah S, et al. Human iPSC-derived motoneurons harbouring TARDBP or C9ORF72 ALS mutations are dysfunctional despite maintaining viability. Nat Commun 2015; 6: 5999.
8. Donnelly CJ, Zhang PW, Pham JT, et al. RNA toxicity from the ALS/FTD C9ORF72 expansion is mitigated by antisense intervention. Neuron 2013; 80(2): 415-28.
Figures