0024
Assessment of cerebral vascular abnormalities in Huntington’s Disease at 7Tesla1Sir Peter Mansfield Imaging Centre, University of Nottingham, Nottingham, United Kingdom, 2John van Geest Centre for Brain Repair, University of Cambridge, Cambridge, United Kingdom, 3Département de Psychiatrie & Neurosciences, Université Laval, QC, Canada
Synopsis
Huntington’s Disease (HD) is associated with vascular abnormalities and breakdown in the blood-brain barrier (BBB). Here, we use high spatial resolution time-of-flight magnetic resonance angiography (TOF-MRA) and arterial spin labelling (ASL) to assess vascular abnormalities in HD patients. We develop a pipeline to estimate vessel radii and distribution from TOF-MRA data. A significant decrease in the fractional vessel volume and a higher frequency of narrow vessels (0.15-0.45mm radius) was evident in HD patients compared to healthy volunteers across a number of cortical areas. No significant difference was found in cortical perfusion between the HD patients and healthy volunteers.
Purpose
There is evidence that impairments of cerebral vasculature and the blood-brain barrier (BBB) contribute to the pathophysiology of Huntington’s Disease (HD). Recent studies have shown vasculature to be highly altered in mouse models and post-mortem analysis of HD, indicating a higher density of smaller blood vessels in HD when compared to healthy volunteers (HV) 1,2. Recently increased arterial cerebral blood volume has been shown in HD patients 1,3. Here, we aim to investigate vascular abnormalities in HD using ultra-high field (7T) MRI angiography and cerebral blood flow (CBF) measures using arterial spin labelling (ASL).Methods
MR Acquisition: 9 HD patients (age 56±14 years; 7 male, 2 female) and 9 healthy volunteers (HV) (age: 49±14 years; 7 male, 2 female) were scanned on a 7T Philips Achieva system with a 32-channel receive coil. TOF-MRA data was acquired using an FFE readout with velocity encoding of 5 cm/s in all directions (FOV= 230x170x60mm, 0.6 mm isotropic resolution, 100 contiguous slices, flip angle=7°, TR/TE=19/11 ms). ASL data were collected using flow alternating inversion recovery (FAIR) ASL with a 2D GE-EPI readout (FOV 192x216x30 mm, resolution 2.7x2.7x3.0 mm, 10 contiguous slices, TE=24ms, selective/non-selective thickness = 50/300 mm, WET pre-saturation pulses and background suppression). ASL data at post-label delays (PLDs) of 300, 600, 900 and 1200 ms (10 label-control repeats) allowed assessment of tissue transit time (TTT), and later PLDs of 1500 and 1700ms (50 label-control repeats) provided high SNR perfusion weighted images. An associated M0 scan was acquired to normalise the perfusion signal for perfusion quantification. A T1 map was also acquired (TI=100,200,300,500,1000,1300,1700,2000,2500 and 3000ms)
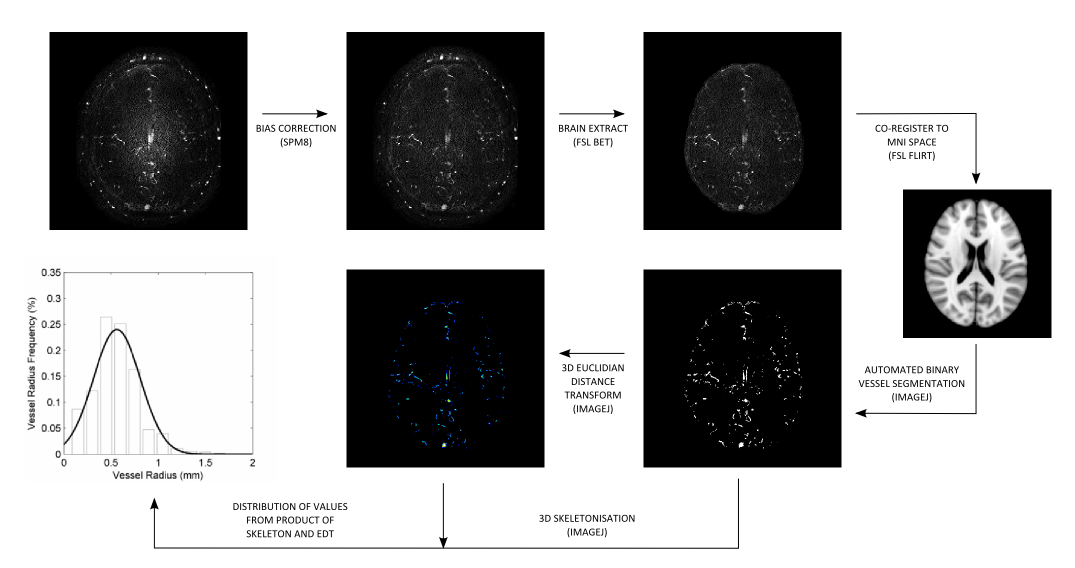
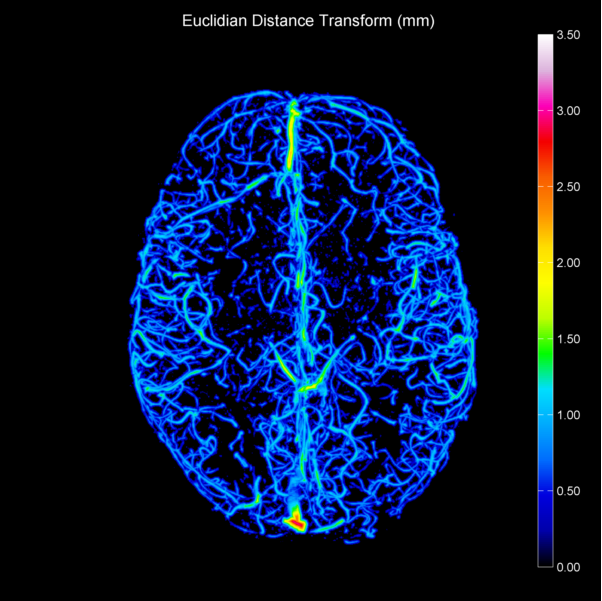
Data Analysis: The TOF-MRAs were bias corrected using SPM84. Brain extraction was then performed using FSL BET5 before co-registering data to MNI space using FSL FLIRT6. A mask was created to define the volume of the brain showing overlap across all subject data sets. TOF-MRA data was then resampled to 0.2 mm isotropic resolution using bicubic interpolation. Vessels contained in the TOF-MRAs were segmented using an automated adaptive threshold7 to create a binary image. Two operations were then performed using ImageJ8; a 3D Euclidian distance transform (EDT) and 3D skeletisation. The 3D Euclidian distance transform indicates the shortest distance between voxels in the vessels and the background. The skeletisation applies an iterative thinning algorithm to reduce the vessels to a one voxel thick path, representative of the centrelines of vessels. By computing the product of the 3D Euclidian distance map and the centrelines, vessel radii can be determined (Figure 1, 2). The brain was divided into 46 cortical regions using the Harvard-Oxford MNI atlas and fractional vessel volume assessed - only regions containing >50% volume within the common TOF-MRA mask were considered for analysis
ASL data were first brain extracted using FSL BET5, and motion corrected using FSL MCFLIRT6. The signal difference between label and control images was computed and averaged over repeats using Huber M-estimators to reduce the effect of outliers8. The perfusion signal was fitted to the early PLDs on a voxel-by-voxel to basis to estimate TTT10. The TTT map was used in a successive fit with the longer PLDs (1500 and 1700ms) to estimate perfusion on a voxel-by-voxel basis.
Results
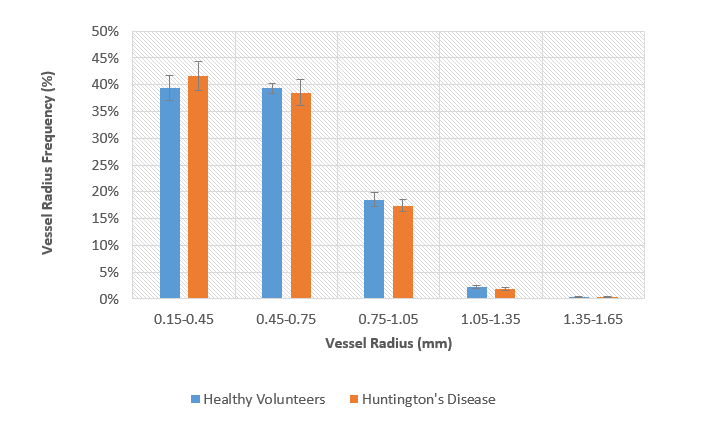
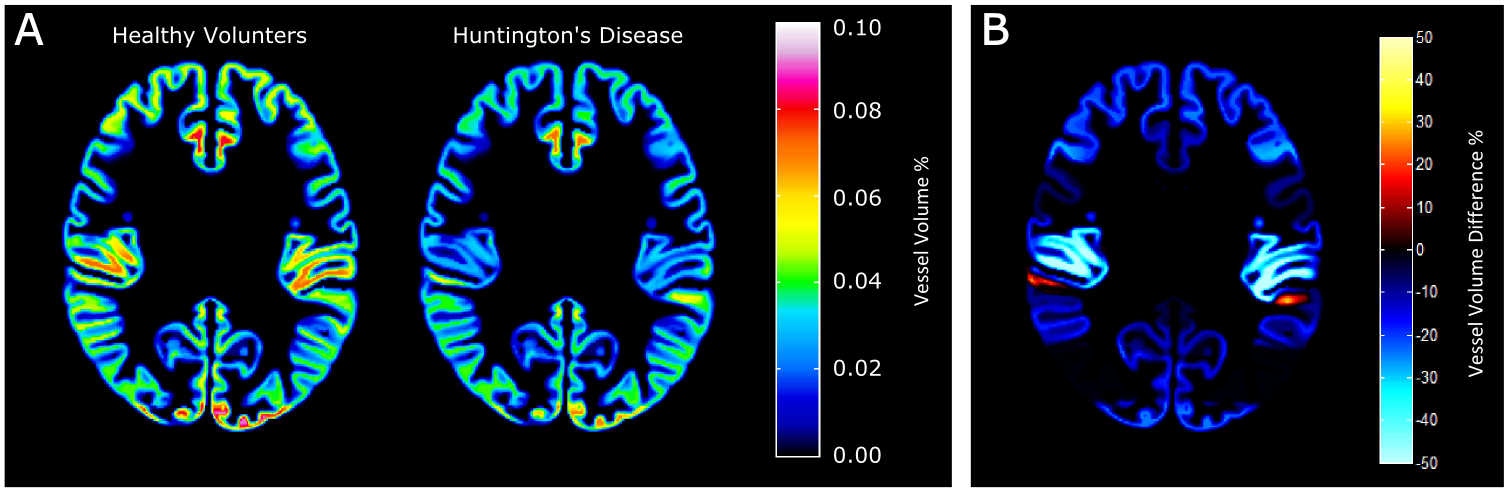
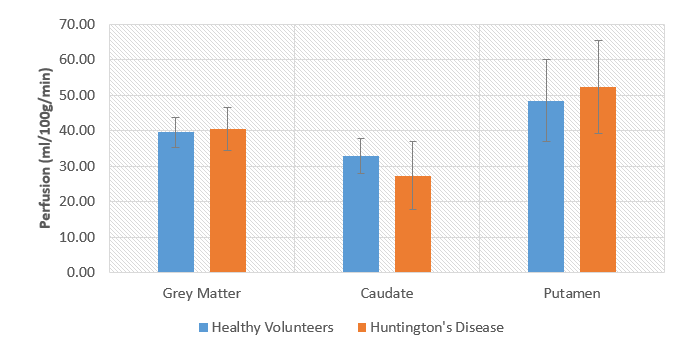
We found a trend indicating an increased fraction of vessels with small radii (0.15-0.45 mm) in the HD group compared to HVs, whilst a decreased fraction of vessels with medium radii (0.45-0.75mm and 0.75-1.05mm) was found in the HD group. Larger radii vessels (>1.05 mm) occurred at the same frequency in both groups (Figure 3). These trends agree with results from previous animal studies 1,2. From the 46 cortical regions defined in the Harvard-Oxford atlas, 39 had at least 50% of its volume contained within the TOF-MRA data. From these 39 regions, 35 regions showed a significant reduction in volume of 17.2±3.6% (p=0.015) (Figure 4). No significant difference in ASL perfusion was found in the cortex, putamen or caudate nucleus between the HV and HD group (Figure 5).Discussion
Our results indicate that cerebral vasculature in Huntington’s patients is significantly different to HVs in terms of fractional vessel volume in a number of cortical regions. A trend for increased frequency of small vessels was found in the HD patients compared to HVs. No significant difference in perfusion was found in cortical regions, however there was a large variance in perfusion measures in the HD group compared to the HVs, suggesting a larger sample size is needed to gain power to observe significanceAcknowledgements
This work was funded by the Medical Research Council.References
1. Drouin-Ouellet, J., et al., Cerebrovascular and blood-brain barrier impairments in Huntington's disease: Potential implications for its pathophysiology. Ann Neurol, 2015.
2. Hsiao, H.Y., et al., Aberrant astrocytes impair vascular reactivity in Huntington disease. Ann Neurol, 2015. 78(2): p. 178-92.
3. Hua, J., et al., Elevated arteriolar cerebral blood volume in prodromal Huntington's disease. Mov Disord, 2014. 29(3): p. 396-401.
4. Penny, W.D., et al., Statistical parametric mapping: the analysis of functional brain images. 2011: Academic press.
5. Jenkinson, M., M. Pechaud, and S. Smith, BET2: MR-Based Estimation of Brain, Skull and Scalp Surfaces, in In Eleventh Annual Meeting of the Organization for Human Brain Mapping. 2005.
6. Jenkinson, M., et al., Improved optimization for the robust and accurate linear registration and motion correction of brain images. Neuroimage, 2002. 17(2): p. 825-41.
7. Chow, C.K. and T. Kaneko, Automatic boundary detection of the left ventricle from cineangiograms. Computers and Biomedical Research, 1972. 5(4): p. 388-410.
8. Schneider, C.A., W.S. Rasband, and K.W. Eliceiri, NIH Image to ImageJ: 25 years of image analysis. Nat Meth, 2012. 9(7): p. 671-675.
9. Maumet, C., et al., Robust estimation of the cerebral blood flow in arterial spin labelling. Magn Reson Imaging, 2014. 32(5): p. 497-504.
10. Gardener, A.G., P.A. Gowland, and S.T. Francis, Implementation of quantitative perfusion imaging using pulsed arterial spin labeling at ultra-high field. Magnetic Resonance in Medicine, 2009. 61(4): p. 874-882.
Figures