0021
3D magnetic resonance spectroscopic imaging at 7 Tesla of patients with medically refractory focal epilepsy with non-lesional or inconclusive clinical MRIs: First Results1Translational and Molecular Imaging Institute, Icahn School of Medicine at Mount Sinai, New York, NY, United States, 2Department of Neurology, Mount Sinai Hospital, New York, NY, United States, 3Radiology, Icahn School of Medicine at Mount Sinai, New York, NY, United States, 4Department of Neurology, Mount Sinai Hospital
Synopsis
SASSI is a B1-insensitive, low-SAR 7T MRSI technique with reduced chemical shift localization errors. We used 3D SASSI to image the hippocampi of patients with medically refractory focal epilepsy who had non-lesional or inconclusive clinical MRIs. Using SASSI at 7T, we detected decreases in the hippocampal NAA/Cr ratios in suspected temporal lobe epilepsy patients, on the same side as the seizure onset zones and/or 7T structural findings.
Introduction
Epilepsy affects 2.2 million people in the US1. 15%-30% of epilepsies are refractory to pharmacotherapy2 and surgical resection of the seizure onset zone (SOZ) may be the best treatment3. Patients without a clear lesion on MRI are less likely to be referred for surgery4. When surgery is performed, successful outcomes correlate with the identification of a clear lesion in histopathology of the resected tissue5. This suggests that focal lesions, amenable to resection, are often undetectable using current MRI protocols. Magnetic resonance spectroscopic imaging (MRSI) provides metabolic information which is complementary to structural imaging. Compounds such as N-acetyl aspartate (NAA) and creatine (Cr) provide information about neuronal integrity and total energy metabolism. MRS studies have shown that NAA levels may be used to lateralize6 and localize the SOZ7 in temporal lobe epilepsy (TLE)8. MRSI greatly benefits from the increased signal-to-noise (SNR) and spectral separation at 7 Tesla (7T). Unfortunately, MRSI at 7T can be difficult due to B1 inhomogeneity, chemical shift localization errors (CSLE), and RF power (SAR) limitations. We report preliminary results of the first use of a B1-insensitive, semi-adiabatic spectral-spatial spectroscopic imaging sequence (SASSI) [9] to detect metabolic alterations in patients with focal epilepsy with non-lesional or inconclusive clinical MRIs. SASSI has been designed to overcome many of the limitations of MRSI at 7T, enabling effective acquisition of high resolution grids of spectra in epilepsy.Methods
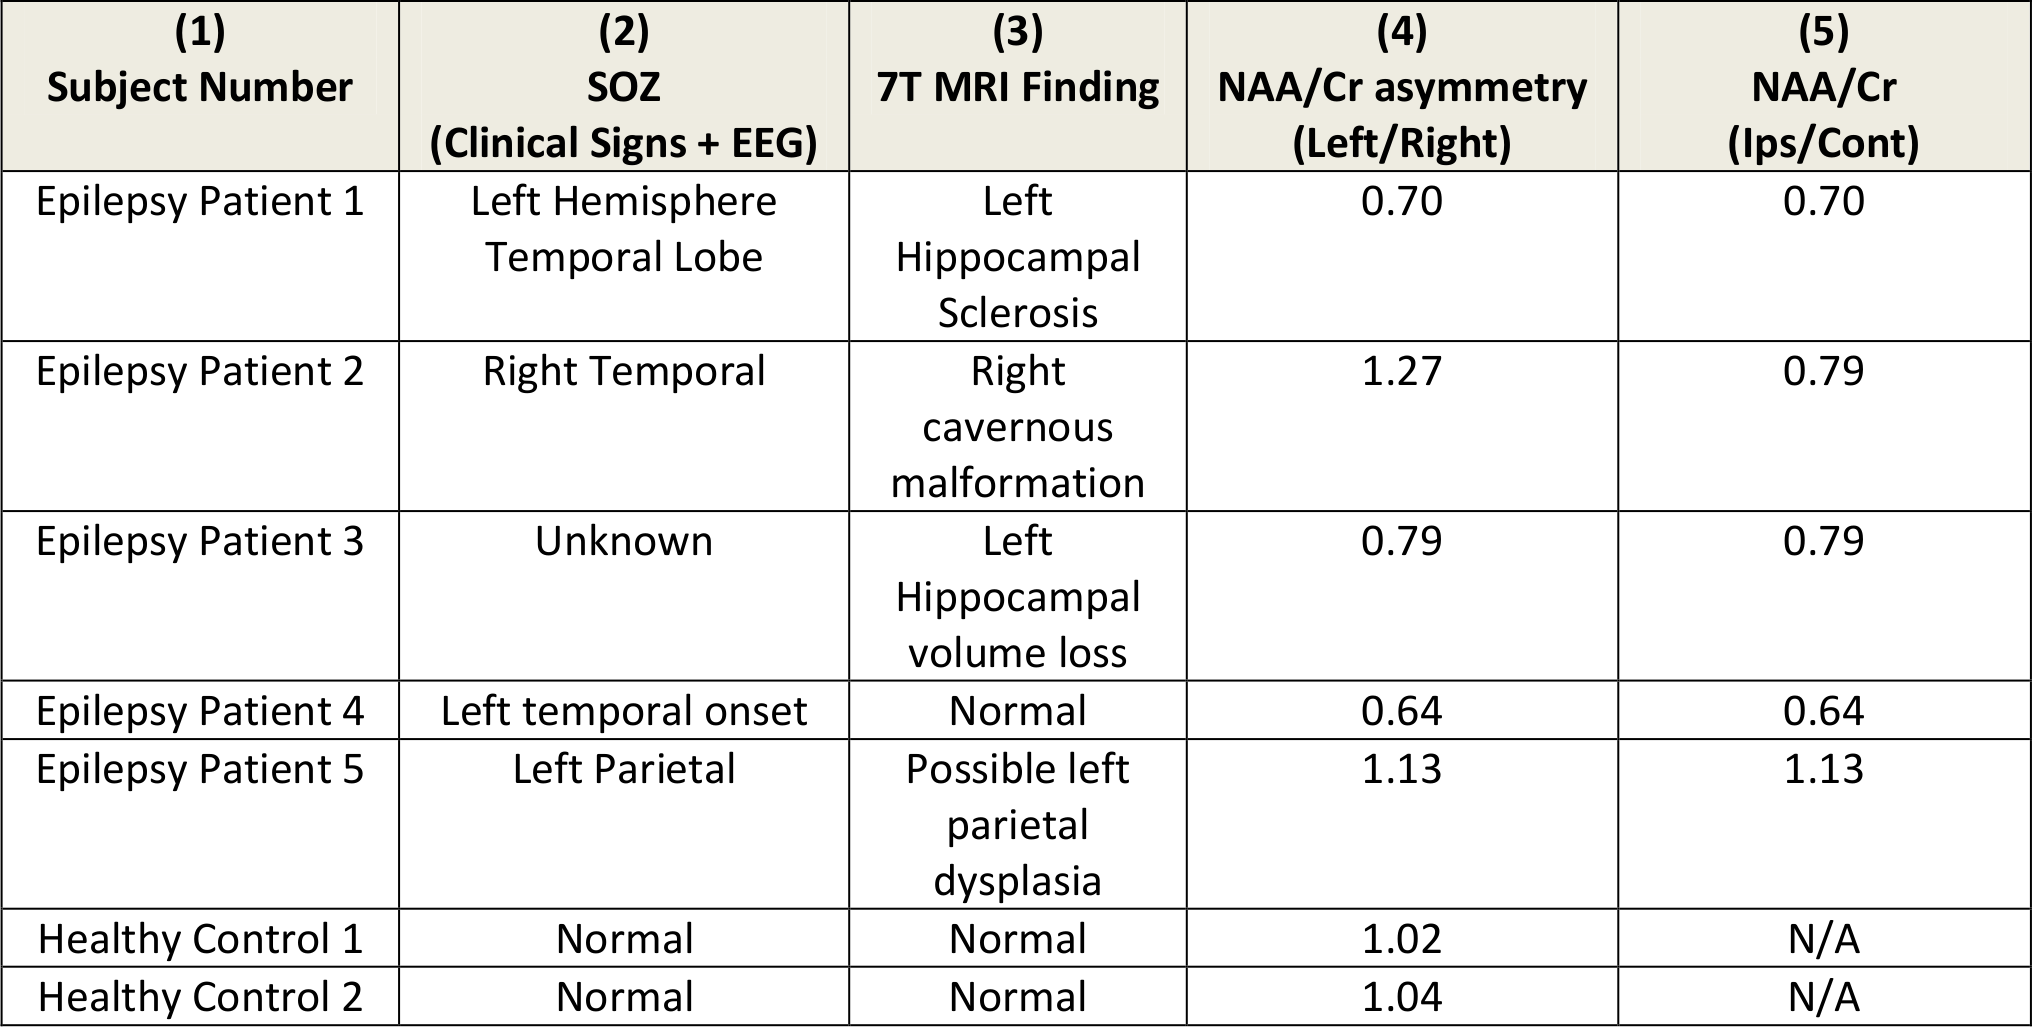
5 epilepsy patients and 2 healthy controls were scanned on a 7T MRI (Siemens) using a 32-channel receive head coil (Nova Medical), under an approved IRB protocol. The 7T MRI protocol included a T1-weighted MP2RAGE10 (TR=6000 ms, TI1=1050 ms , TI2=3000 ms, TE=5.06 ms, voxel=0.8x0.8x0.7 mm3 ) and a 3D SASSI (TR=1000 ms, TE=42 ms, matrix=16x16x8, time= 11 min) covering the left and right hippocampus. We chose this region for SASSI due to possible hippocampal seizure origin for 4 of the 5 patients as indicated by clinical signs and EEG. In the other patient, the hippocampus could not be ruled out for involvement in seizure pathways. NAA/Cr ratios were calculated. NAA provides a measure of neuronal density and function and Cr acts as a reference peak. Co-registration of a MP2RAGE image and the MRSI grid was performed on Siemens software. Metabolite fitting and peak integration was performed using LCMODEL11. Voxels in the hippocampus were identified on the co-registered image and NAA/Cr ratios were calculated in 3 voxels per hippocampus. The metabolite ratios were compared between the right and left hippocampi.Results/Discussion
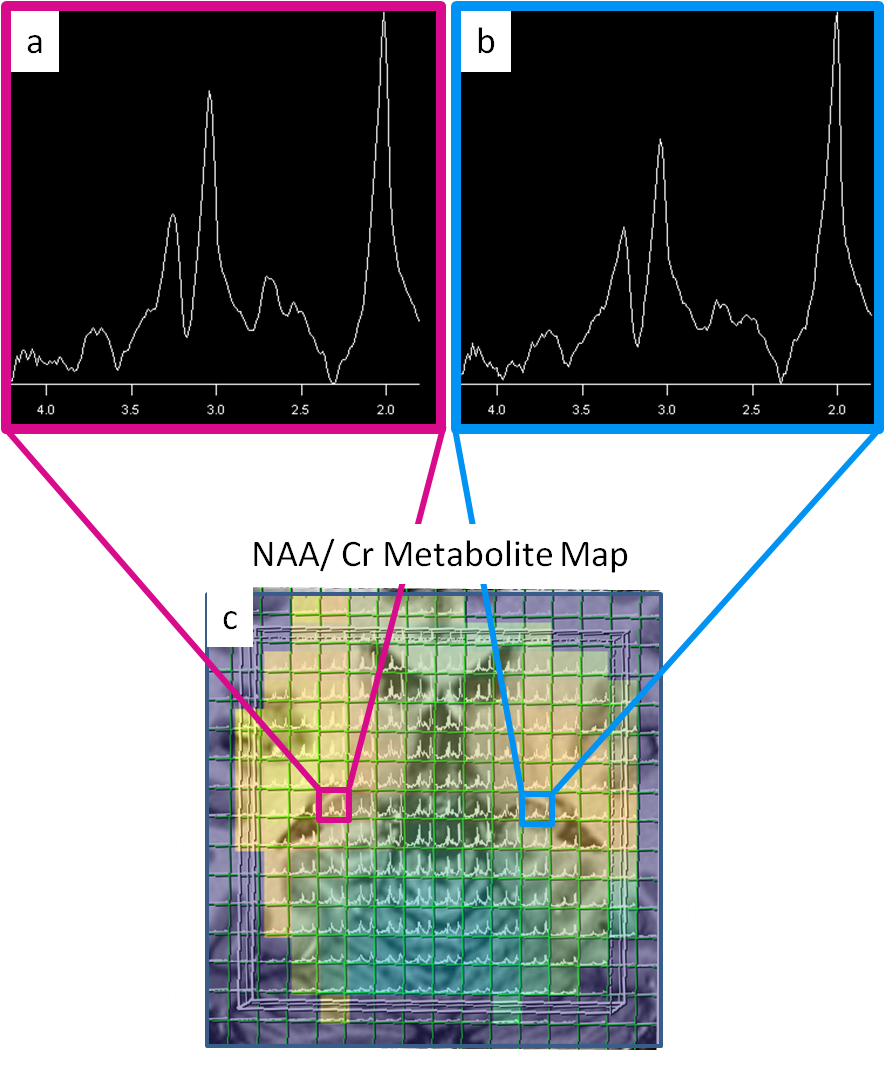
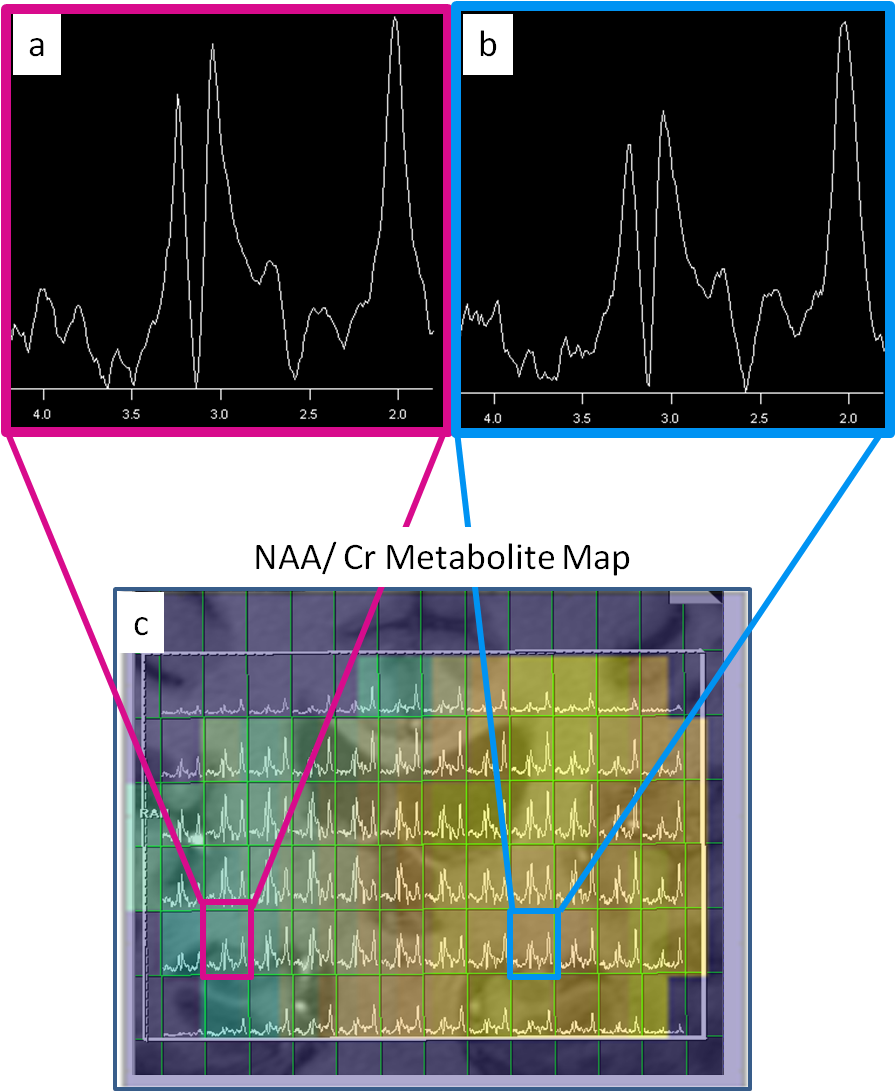
Figure 1 shows an MP2RAGE co-registered to a spectral grid for a control and Figure 2 shows the same for an epilepsy patient. Table 1 lists the suspected SOZ’s determined by clinical indicators and EEG, 7T structural findings, the ratio of NAA/Cr between left and right hippocampi, and the ratio of NAA/Cr between hippocampi ipsilateral and contralateral to the SOZ. In patients 1 and 2 (Table 1), decreases in the NAA/Cr ratio in the hippocampus were found ipsilateral to the suspected SOZ, relative to the contralateral side. In patient 3, with unknown SOZ and hippocampal asymmetry at 7T, a decrease in the NAA/Cr ratio was detected in the hippocampus ipsilateral to the hippocampal volume loss. In patient 4, NAA/Cr asymmetry existed in the hippocampus ipsilateral to the suspected SOZ despite the lack of structural findings. In patient 5, with suspected parietal lobe involvement, NAA/Cr was not decreased in the ipsilateral hippocampus. In the healthy controls, NAA/Cr hippocampal ratios were essentially symmetric (left/right=1.02 and 1.04).
Although SASSI has reduced sensitivity to B1 inhomogeneity, signal loss due to the non-adiabatic excitation pulse and receive sensitivity still occurs. The adiabaticity of the refocusing pulses resulted in robust SNR and low CSLE in all voxels and NAA/Cr ratios were calculated instead of individual metabolite values to increase immunity B1 signal variation.. The controls showed that no major asymmetry in hippocampal metabolites existed due to artifacts such as CSLE or field inhomogeneity when using SASSI. No ratios were calculated between patients and controls, due to the known inter-subject variability in MRS measurements12.
Conclusion
We report the first use of the SASSI sequence to perform 3D MRSI at 7T to detect metabolic alterations in the hippocampi of non-lesional epilepsy patients. In all 4 epilepsy patients with suspected temporal lobe involvement, a decrease in hippocampal NAA/Cr was detected on the same side as the SOZ, while healthy controls demonstrated nearly symmetric metabolite ratios. This is part of an ongoing study to investigate metabolic markers of non-lesional epilepsy at 7T in a larger set of patients.Acknowledgements
NIH-NINDS R00 NS070821; NIH R01 MH109544; Icahn School of Medicine Capital Campaign; Translational and Molecular Imaging Institute and Department of Radiology, Icahn School of Medicine at Mount SinaiReferences
[1] England MJ, Liverman CT, Schultz AM, et al. Epilepsy Across the Spectrum:: Promoting Health and Understanding. National Academies Press; 2012
[2] Kwan P, Brodie MJ. Early identification of refractory epilepsy. N Engl J Med 2000;342:314-319
[3] Tellez-Zenteno JF, Dhar R, Wiebe S. Long-term seizure outcomes following epilepsy surgery: a systematic review and meta-analysis. Brain 2005;128(Pt 5):1188-1198.
[4] So EL. Role of neuroimaging in the management of seizure disorders. Mayo Clin Proc 2002;77:1251-1264
[5] Bien CG, Szinay M, Wagner J, et al. Characteristics and surgical outcomes of patients with refractory magnetic resonance imaging-negative epilepsies
[6] Kuzniecky R, Hetherington H, Pan J, Hugg J, Palmer C, Gilliam F, Faught E, Morawetz R. Proton spectroscopic imaging at 4.1 tesla in patients with malformations of cortical development and epilepsy.Neurology 1997;48:1018-24.
[7] Woermann FG, McLean MA, Bartlett PA, Parker GJ, Barker GJ, Duncan JS. Short echo time single-voxel 1H magnetic resonance spectroscopy in magnetic resonance imaging-negative temporal lobe epilepsy: different biochemical profile compared with hippocampal sclerosis. Ann Neurol 1999;45:369-76.
[8] Pan JW, Kuzniecky RI. Utility of magnetic resonance spectroscopic imaging for human epilepsy. Quant Imaging Med Surg. 2015; 5(2):313-322.
[9] Feldman RE, Balchandani P. A semiadiabatic spectral-spatial spectroscopic imaging (SASSI) sequence for improved high-field MR spectroscopic imaging. Magn Reson Med 2016; 76(4):1071-82.
[10] Marques JP, Kober T, Krueger G, et al. MP2RAGE, a self bias-field corrected sequence for improved segmentation and T1-mapping at high field. Neuroimage 2010;49:1271-1281
[11] Provencher SW. Automatic quantitation of localized in vivo 1H spectra with LCModel. NMR Biomed 2001; 14(4):260-4
[12] Salibi N, Brown MA. Clinical MR Spectroscopy: First Principles. Wiley-Liss Inc. 1998.
Figures