0020
Changes in structural network connectivity in early-stage multiple sclerosis are associated with cortical demyelination1NeuroPoly Lab, Institute of Biomedical Engineering, Polytechnique Montreal, Montreal, QC, Canada, 2Functional Neuroimaging Unit, CRIUGM, Université de Montréal, Montreal, QC, Canada, 3Athinoula A. Martinos Center for Biomedical Imaging, MGH, 4Harvard Medical School, 5Department of Clinical Science, Intervention and Technology, Karolinska Institutet, 6Montreal Health Institute, 7Beth Israel Deaconess Medical Center
Synopsis
Cortical disruption and changes in brain connectomics in multiple sclerosis have been recently investigated; however, the relationship between both processes in early disease remains uncertain. We propose an integrative framework that combines diffusion-based graph theory with high-resolution quantitative T1 and T2* at 7 Tesla to investigate the topological alterations of both structural connectomics and cortical demyelination. We found that both cortical myelin loss and increase in brain connectivity were present in early MS, and that the two processes were spatially anti-correlated. This suggests that the increase in brain connectivity in early MS could represent an adaptative role against initial, mild cortical demyelination, though this would be lost with more severe cortical disease.
Purpose
Multiple sclerosis (MS) is an inflammatory and neurodegenerative disease of the central nervous system characterized by cortical and white matter demyelination. Previous work suggested a potential interplay between cortical demyelination and abnormalities in structural connectomics [1]. Such studies are challenging at many levels: e.g. subtle cortical changes, especially in early disease, and the high variability of Brodmann Area (BA) locations, which make it difficult to draw robust conclusions. Here, we aim to overcome those challenges and better understand the association between structural connectomics and cortical demyelination in early MS. We propose a framework that combines cortical demyelination analysis using 7T quantitative T1 and T2* maps with graph theory measurements based on ultra-high gradient strength diffusion imaging.Methods
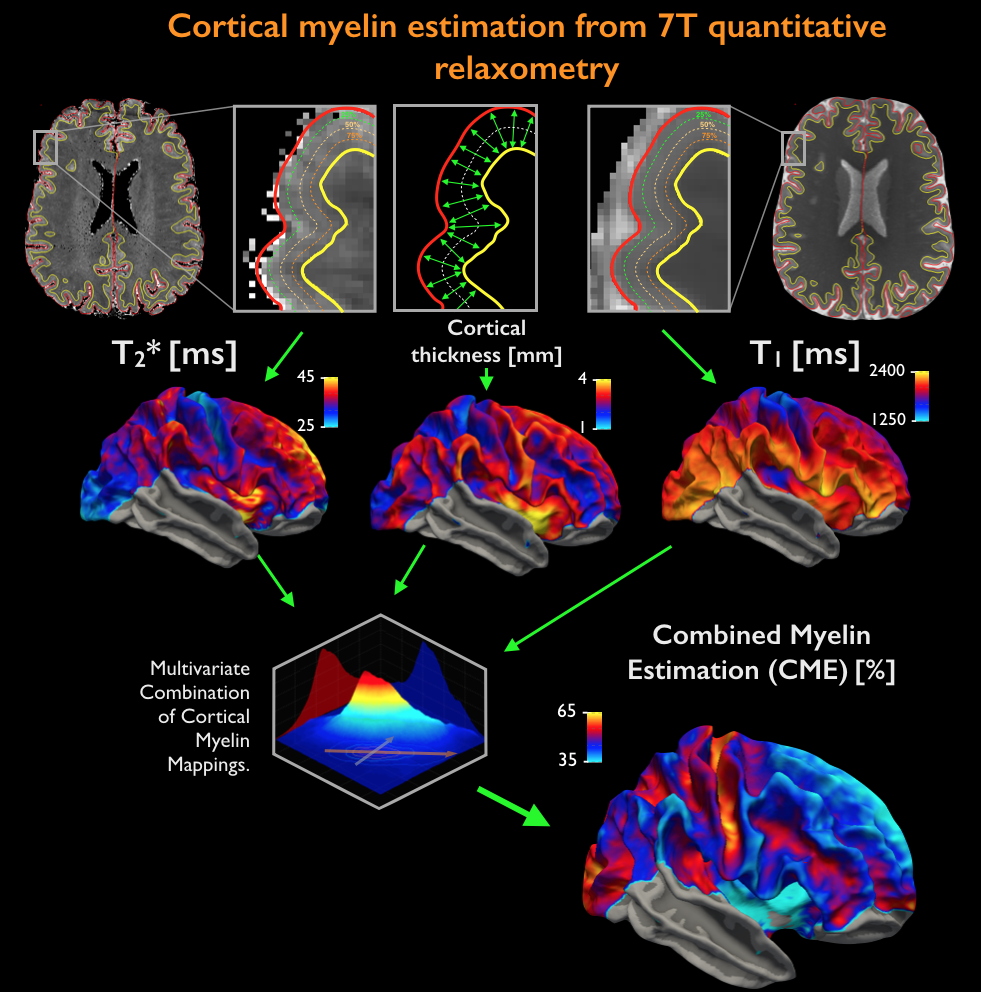
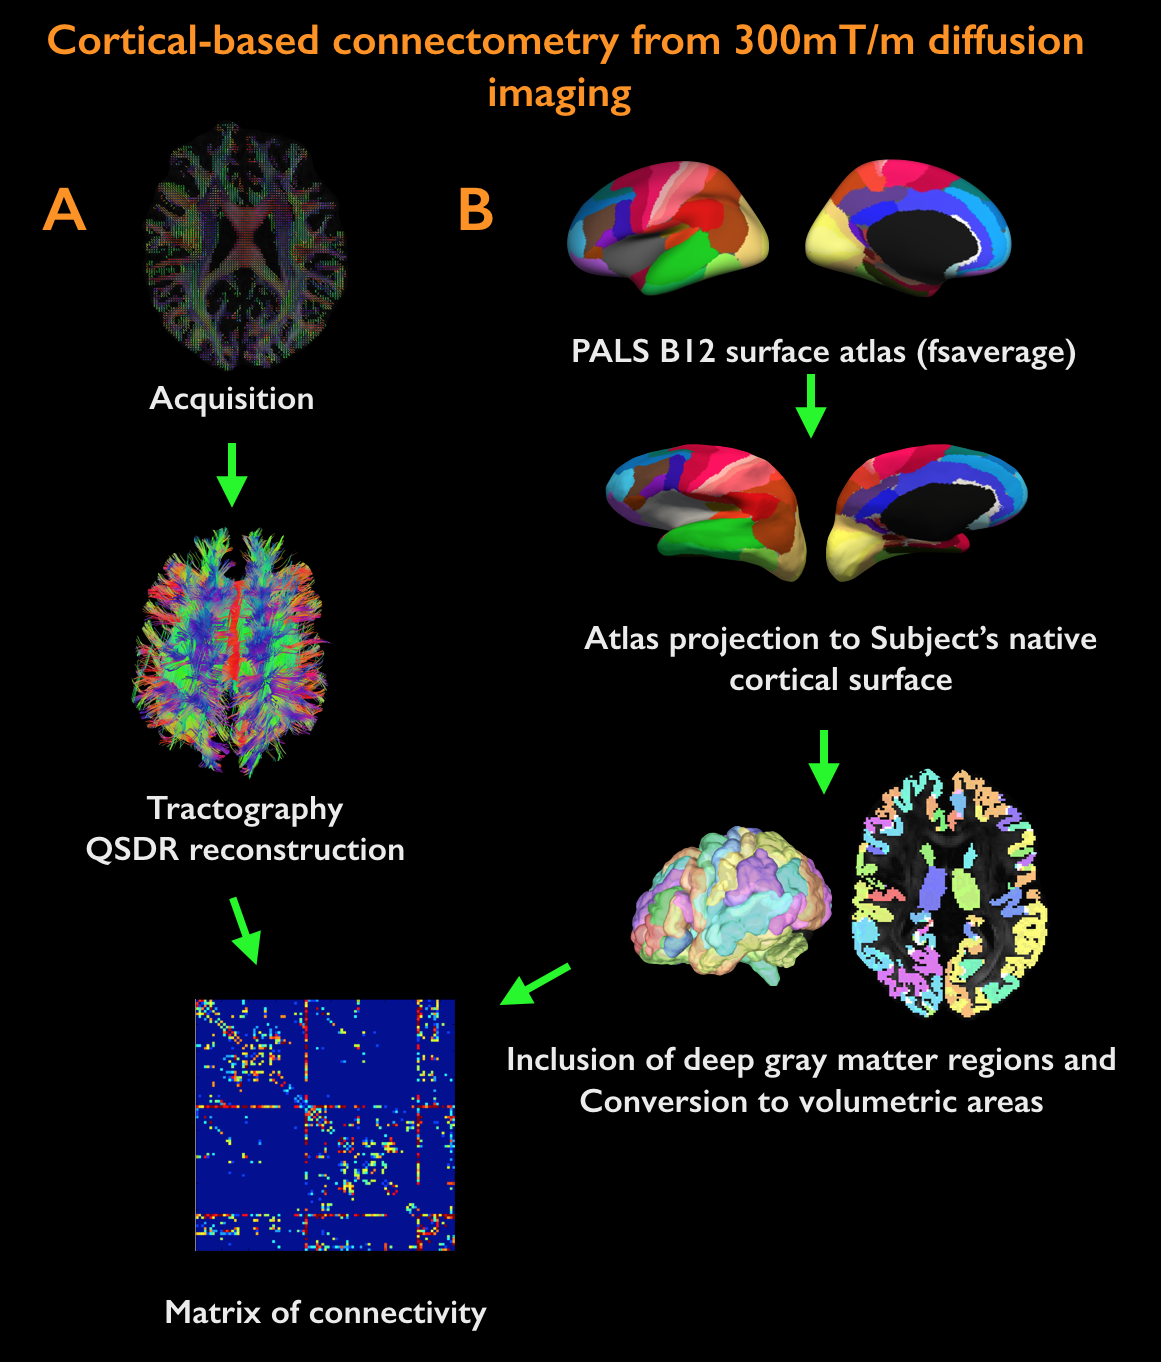
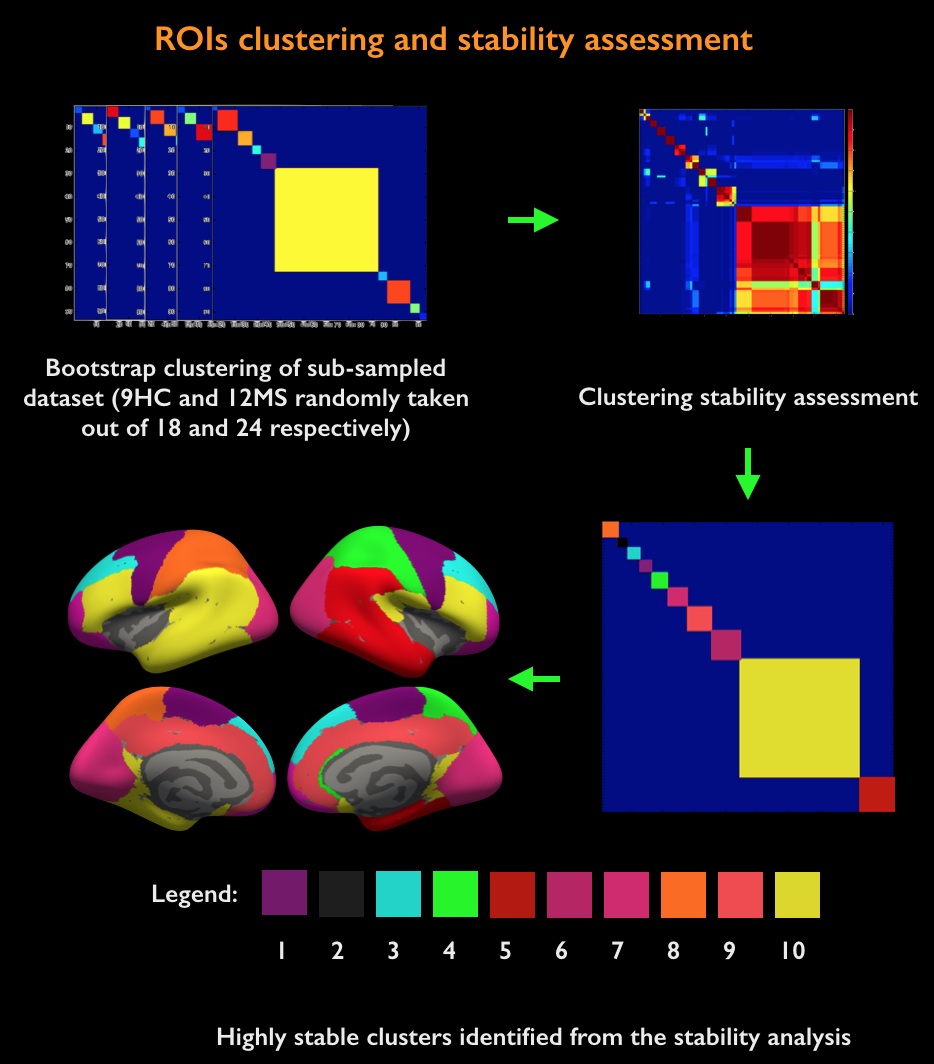
Acquisition. 18 healthy controls (HC, age=38±11years, 10 females) and 24 MS patients (age=39±8years, 22 females; mean disease duration 2.5±1years) were scanned twice: on a 3T whole-body scanner (Siemens MAGNETOM CONNECTOM, gradient strength=300mT/m, 64-channel head-coil) to obtain measures of connectomics from diffusion-weighted images (TE/TR=57.0/8800ms, δ=12.9ms, Δ=21.8ms, 3 b-value shells: 1k/5k/10k s/mm2, number of directions: 64/128/128, resolution=1.5x1.5x1.5mm3) and anatomical cortical surfaces from Freesurfer reconstruction from ME-MPRAGE (1mm isotropic, TR/TI=2530/1100ms, TE=[1.15,3.03,4.89,6.75]ms) acquisitions on a 7T whole-body scanner (Siemens Healthcare, 32 channels head-coil) to obtain high resolution quantitative T2* (TR/TE=3680/3.12+3.32*[1..6]ms, resolution=0.5x0.5x0.5mm3) and T1 images (dual magnetization-prepared rapid gradient echo, MP2RAGE) [2], TR/TE/TI=5000/2.93/[900-3200]ms, resolution=0.75x0.75x0.75mm3). Processing. Combination of 7T quantitative T2* and T1 maps (Figure 1): T1 and T2* were registered to individual cortical surfaces, sampled at the mid-cortical distance and registered to a common surface template (fsaverage). Cortical thickness was computed to correct for partial-volume-effects. Spatial Independent Component Analysis (ICA) was used to extract the shared myelin related signal in T1 and T2* maps, thus creating the Combined Myelin Estimation (CME) [3,4]. Diffusion analysis (Figure 2A): Images were corrected for gradient nonlinearity, Eddy-current distortions and motion. Whole-brain tractography was conducted using DSI-Studio (http://dsi-studio.labsolver.org). Atlas registration (Figure 2B): To minimize registration inaccuracies due to inter-subject variability of cortical folding, 1) the PALS-B12 BA [5] surfacic atlas was projected onto the subject’s space using FreeSurfer (~130,000 degree-of-freedom, DOF), 2) surfacic atlases were exported to volumetric atlases 3) deep gray matter regions were added. Connectivity matrices were computed by multiplying fibers count and mean fractional anisotropy (FA) across regions of interest (ROIs) [6]. Matrix stability analysis (Figure 3): A bootstrap analysis [7] estimated the stability of the matrices using random data sub-samplings (9 HC, 12 MS patients, 500 iterations) and found 10 highly stable clusters. Graph theoretical and network-based statistic: The Brain-Connectivity-Toolbox (http://www.brain-connectivity-toolbox.net/) was used to compute the following metrics: Strength, Local efficiency and Clustering coefficient in the simplified graph and Strength, Global efficiency and Transitivity for the whole graph. Finally, the relation between myelin loss and connectivity increase was tested with Spearman’s correlations performed in the stable cluster space.Results
Figure 3 shows the stability of the matrices after a bootstrap analysis and a clusterization in 10 functional groups of BAs.
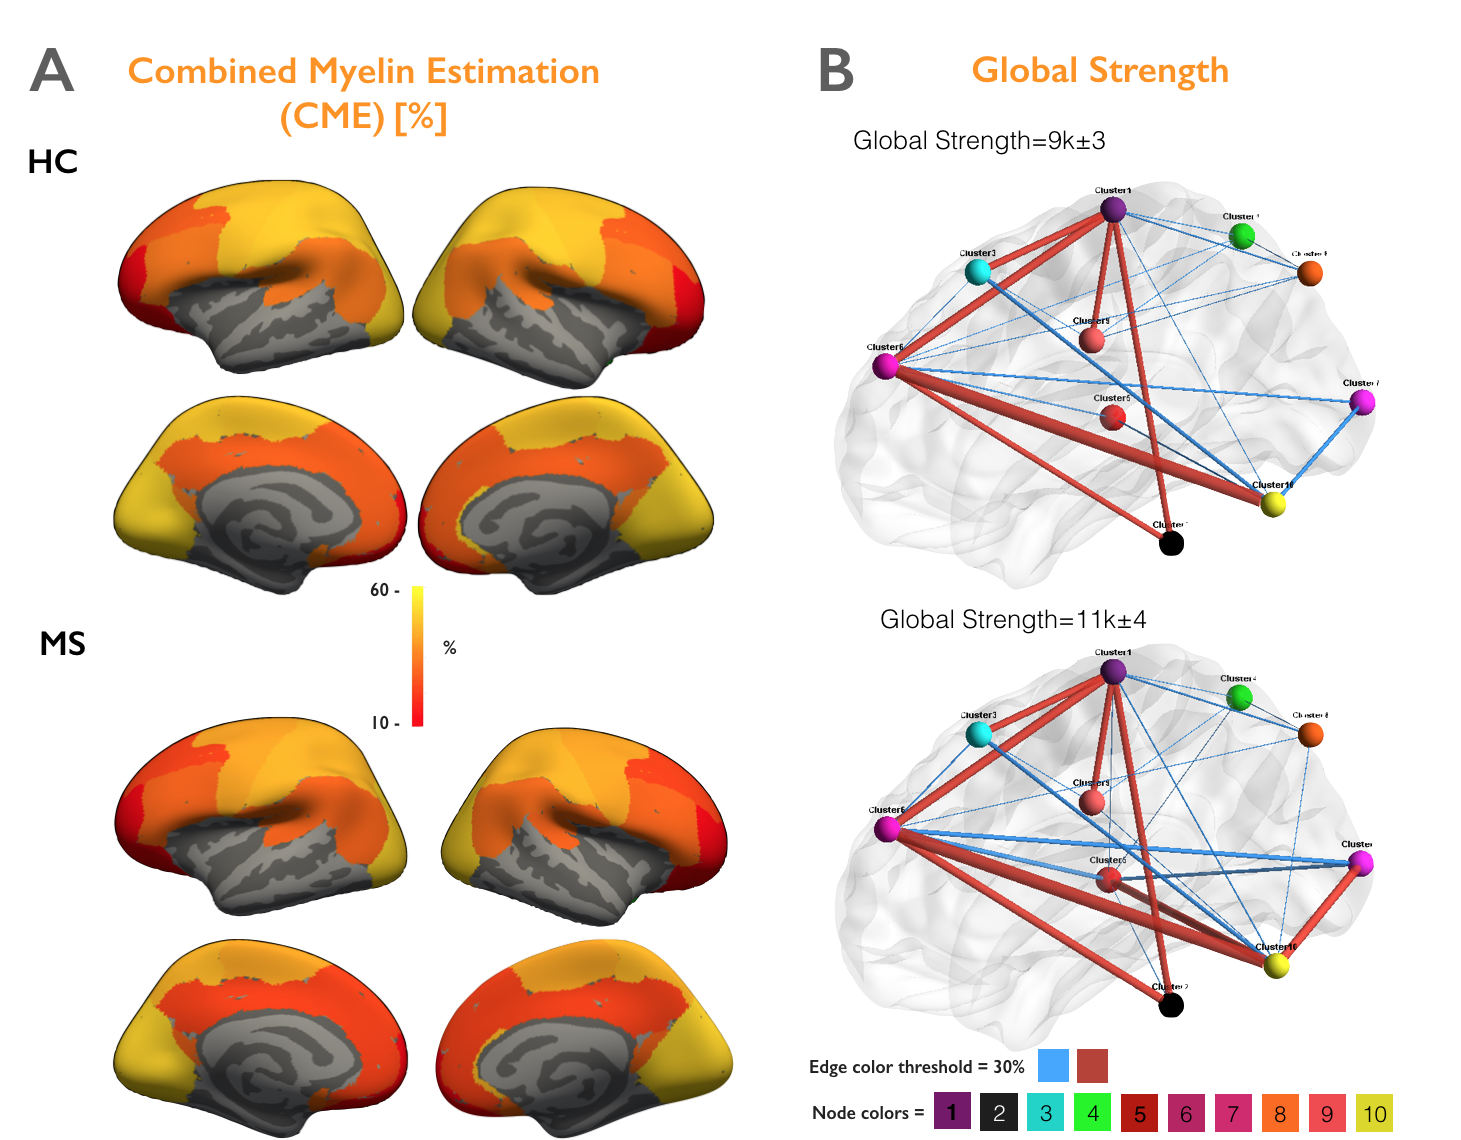
Figure 4A illustrates the myelin estimated maps (CME) averaged across HC and MS groups and shows a global loss of myelin in early MS. Figure 4B indicates the averaged structural networks of HC and MS patients and highlight a significant increase in Strength, Transitivity and Global efficiency (p<0.05).
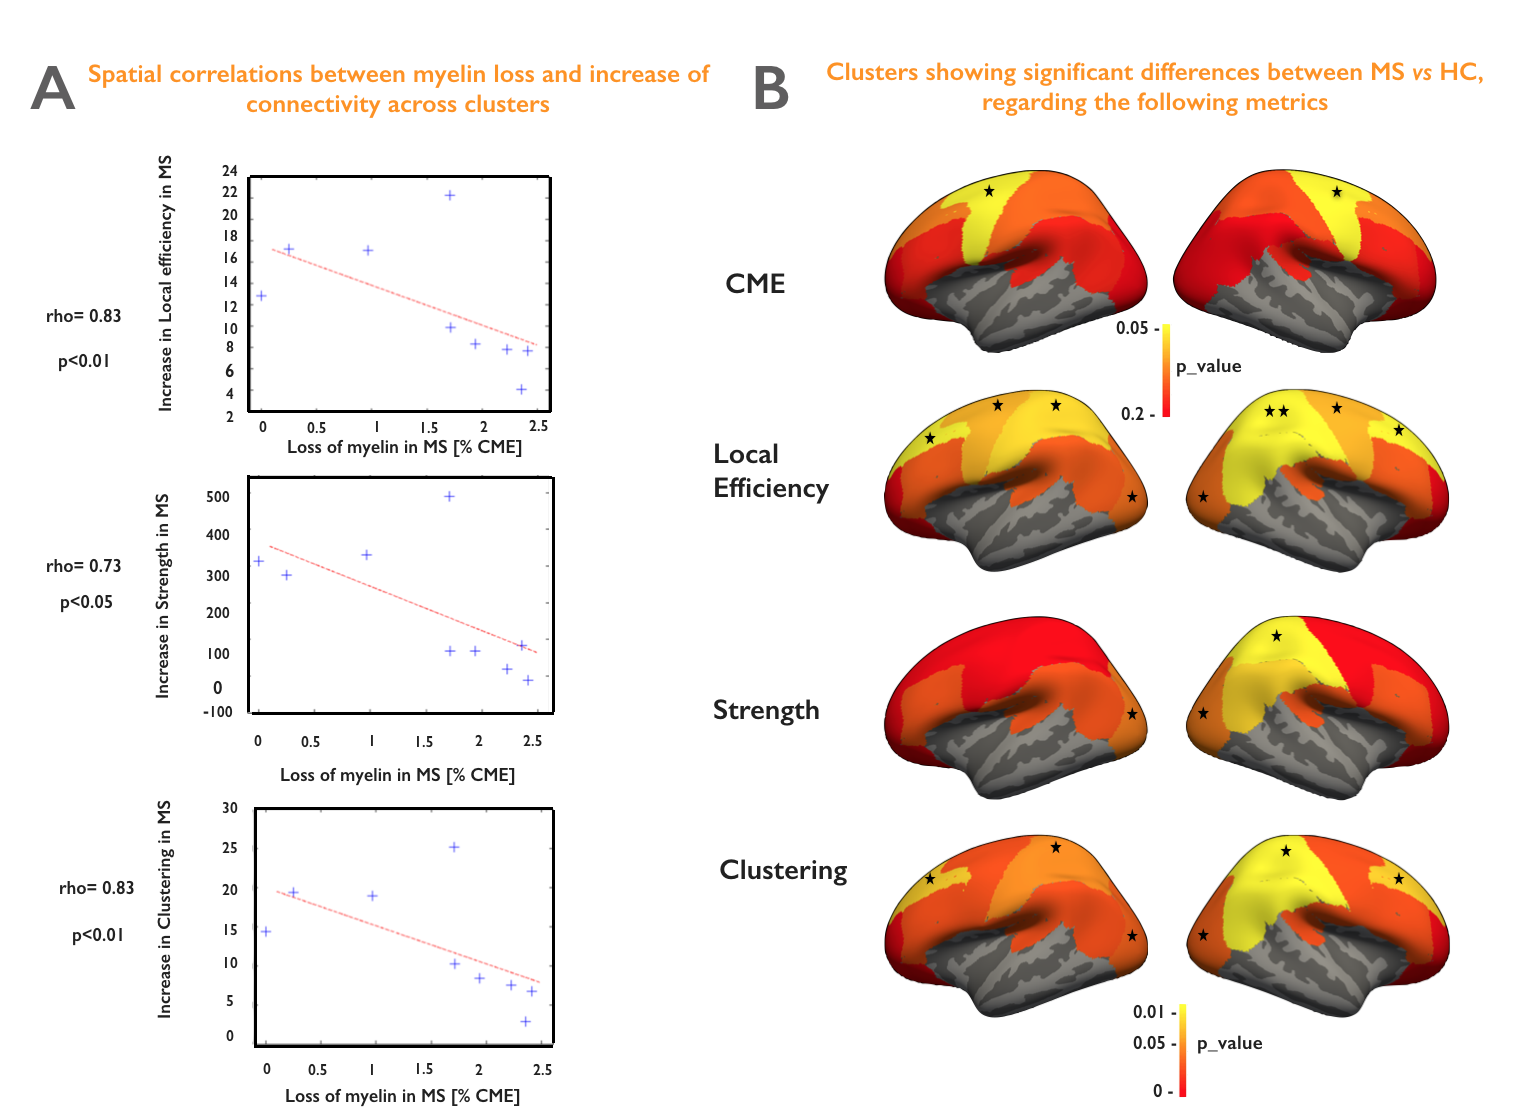
Figure 5A shows a spatial anti-correlation between myelin loss and increase in connectivity (rho>0.73, p<0.05). Figure 5B highlights areas of demyelination as well as clusters presenting significantly altered topological measures in early MS vs HC.
Discussion/Conclusion
We developed an integrative framework to study topological alterations in both structural connectomics and cortical demyelination in early MS relative to HC. Globally, we found cortical myelin loss using CME estimation, and yet an increase in connectivity using strength, local efficiency and clustering metrics (p<0.05). Interestingly, the spatial distribution of the two processes: myelin loss and increase in connectivity, are strongly anti-correlated (rho>0.73, p<0.05). For example, we noticed that increase in strength, clustering coefficient and local efficiency in the visual and right sensory cortex (p<0.05) was not associated with significant cortical demyelination, while the significant myelin loss in the motor cortex (p<0.05) is associated with a lower increase in connectivity. These findings suggest that the increase in brain connectivity in early MS might play an adaptative role against mild cortical demyelination. It could be the fundamental response of the brain to its structural changes in order to maintain its homeostasis, as previously suggested [8]. However, this process could be lost with advancing cortical disease. Future work will investigate how these adaptive processes correlate with underlying white matter lesional pathology, as well as with clinical outcome measures.Acknowledgements
We would like to thank Qiuyun Fan (A.A. Martinos Center for Biomedical Imaging), Benjamin De Leener (Polytechnique Montreal) and Tommy Boshkovski (Polytechnique Montreal) for helpful discussions. We would like also to mention that both last authors contributed equally to this work. This study was supported by the National Institute of Health [NIH R01NS078322-01-A1], the Canadian Institute of Health Research (CIHR FDN-143263), the Canada Research Chair in Quantitative Magnetic Resonance Imaging, the Fonds de Recherche du Québec - Santé (FRQS 28826), the Fonds de Recherche du Québec - Nature et Technologies (FRQNT 2015-PR-182754), Quebec Bio-Imaging Network (QBIN), the Natural Sciences and Engineering research Council of Canada (NSERC). Tobias Granberg was supported by the Swedish Society for Medical Research. Elena Herranz was supported by the NMSS fellowship FG-1507-05459.References
[1] G. Mangeat, R. Ouellette, C. A. Treaba, T. Granberg, and E. Herranz, “Association between cortical demyelination and structural connectomics in early multiple sclerosis,” 2016.
[2] J. P. Marques, T. Kober, G. Krueger, W. van der Zwaag, P.-F. Van de Moortele, and R. Gruetter, “MP2RAGE, a self bias-field corrected sequence for improved segmentation and T1-mapping at high field,” Neuroimage, vol. 49, no. 2, pp. 1271–1281, Jan. 2010.
[3] G. Mangeat, S. T. Govindarajan, C. Mainero, and J. Cohen-Adad, “Multivariate combination of magnetization transfer, T2* and B0 orientation to study the myelo-architecture of the in vivo human cortex,” Neuroimage, vol. 119, pp. 89–102, Oct. 2015.
[4] G. Mangeat, S. T. Govindarajan, R. P. Kinkel, C. Mainero, and J. Cohen-Adad, “Multivariate combination of magnetization transfer ratio and quantitative T2* to detect subpial demyelination in multiple sclerosis,” in ISMRM, 2015.
[5] D. C. Van Essen, “A Population-Average, Landmark- and Surface-based (PALS) atlas of human cerebral cortex,” Neuroimage, vol. 28, no. 3, pp. 635–662, Nov. 2005.
[6] R. F. Betzel, L. Byrge, Y. He, J. Goñi, X.-N. Zuo, and O. Sporns, “Changes in structural and functional connectivity among resting-state networks across the human lifespan,” Neuroimage, vol. 102 Pt 2, pp. 345–357, Nov. 2014.
[7] P. Bellec, P. Rosa-Neto, O. C. Lyttelton, H. Benali, and A. C. Evans, “Multi-level bootstrap analysis of stable clusters in resting-state fMRI,” Neuroimage, vol. 51, no. 3, pp. 1126–1139, Jul. 2010.
[8] V. Fleischer et al., “Increased structural white and grey matter network connectivity compensates for functional decline in early multiple sclerosis,” Mult. Scler., May 2016.
[9] G. Mangeat et al., “Multivariate combination of quantitative T-2* and T-1 at 7T MRI detects in vivo subpial demyelination in the early stages of MS,” in MULTIPLE SCLEROSIS JOURNAL, 2015, vol. 21, pp. 485–485.
Figures