0019
7T Quantitative Magnetization Transfer (qMT) of Cortical Gray Matter in Multiple Sclerosis Correlates with Cognitive Disability1Department of Biomedical Engineering, Vanderbilt University, Nashville, TN, United States, 2Vanderbilt University Institute of Imaging Science, Vanderbilt University Medical Center, Nashville, TN, 3Department of Radiology and Radiological Sciences, Vanderbilt University Medical Center, Nashville, TN, 4Department of Opthamology, Vanderbilt University Medical Center, Nashville, TN
Synopsis
Cognitive impairment (CI) is a major manifestation of multiple sclerosis (MS) and is responsible for extensively hindering patient quality of life.1 Cortical gray matter damage is critical to CI, but is poorly characterized by conventional MRI. We employed advanced methods by evaluating SIR-qMT-derived indices for differences between MS patients and healthy volunteers at 7T and derived associations with neuropsychological measures of cognitive impairment. We found significant reduction in kmf in cGM of MS patients, unique association with EDSS score, and strong correlation with cognitive performance indicating that kmf may be a significant biomarker of GM damage in MS.
Purpose
Cognitive impairment (CI) is manifest in all subtypes of Multiple Sclerosis (MS) and is responsible for hindering patients’ quality of life.1 Cortical gray matter (cGM) damage is critical to cognitive impairment, but is poorly characterized by conventional MRI due to poor resolution and lack of lesion contrast. MRI brain studies have focused on white matter and lesions;2 we postulate that quantitative magnetization transfer (qMT) can offer biomarkers for GM damage in MS and aid in understanding disease evolution.
We employed Selective Inversion Recovery (SIR) qMT, which can provide physiological constants of tissue sensitive to tissue microenvironment, such as the pool size ratio (PSR) and the rate of MT exchange (kmf)3-10 and offer greater SNR and spatial resolution allowing a quantitative survey of cGM pathology in MS. SIR qMT is well suited for cGM study since it measures the macromolecular-bulk water interactions through an inversion recovery (IR) sequence at short inversion times (Ti)11 which can be tailored for robust B1 and B0 homogeneity at 7T with low SAR. We evaluated SIR-qMT-derived indices for differences between MS patients and healthy volunteers at 7T and derived associations between neuropsychological measures of cognitive impairment in our MS cohort. Importantly, the rate of MT exchange uniquely identifies differences between cGM in patients and controls and is well associated with standard measures of CI.
Methods
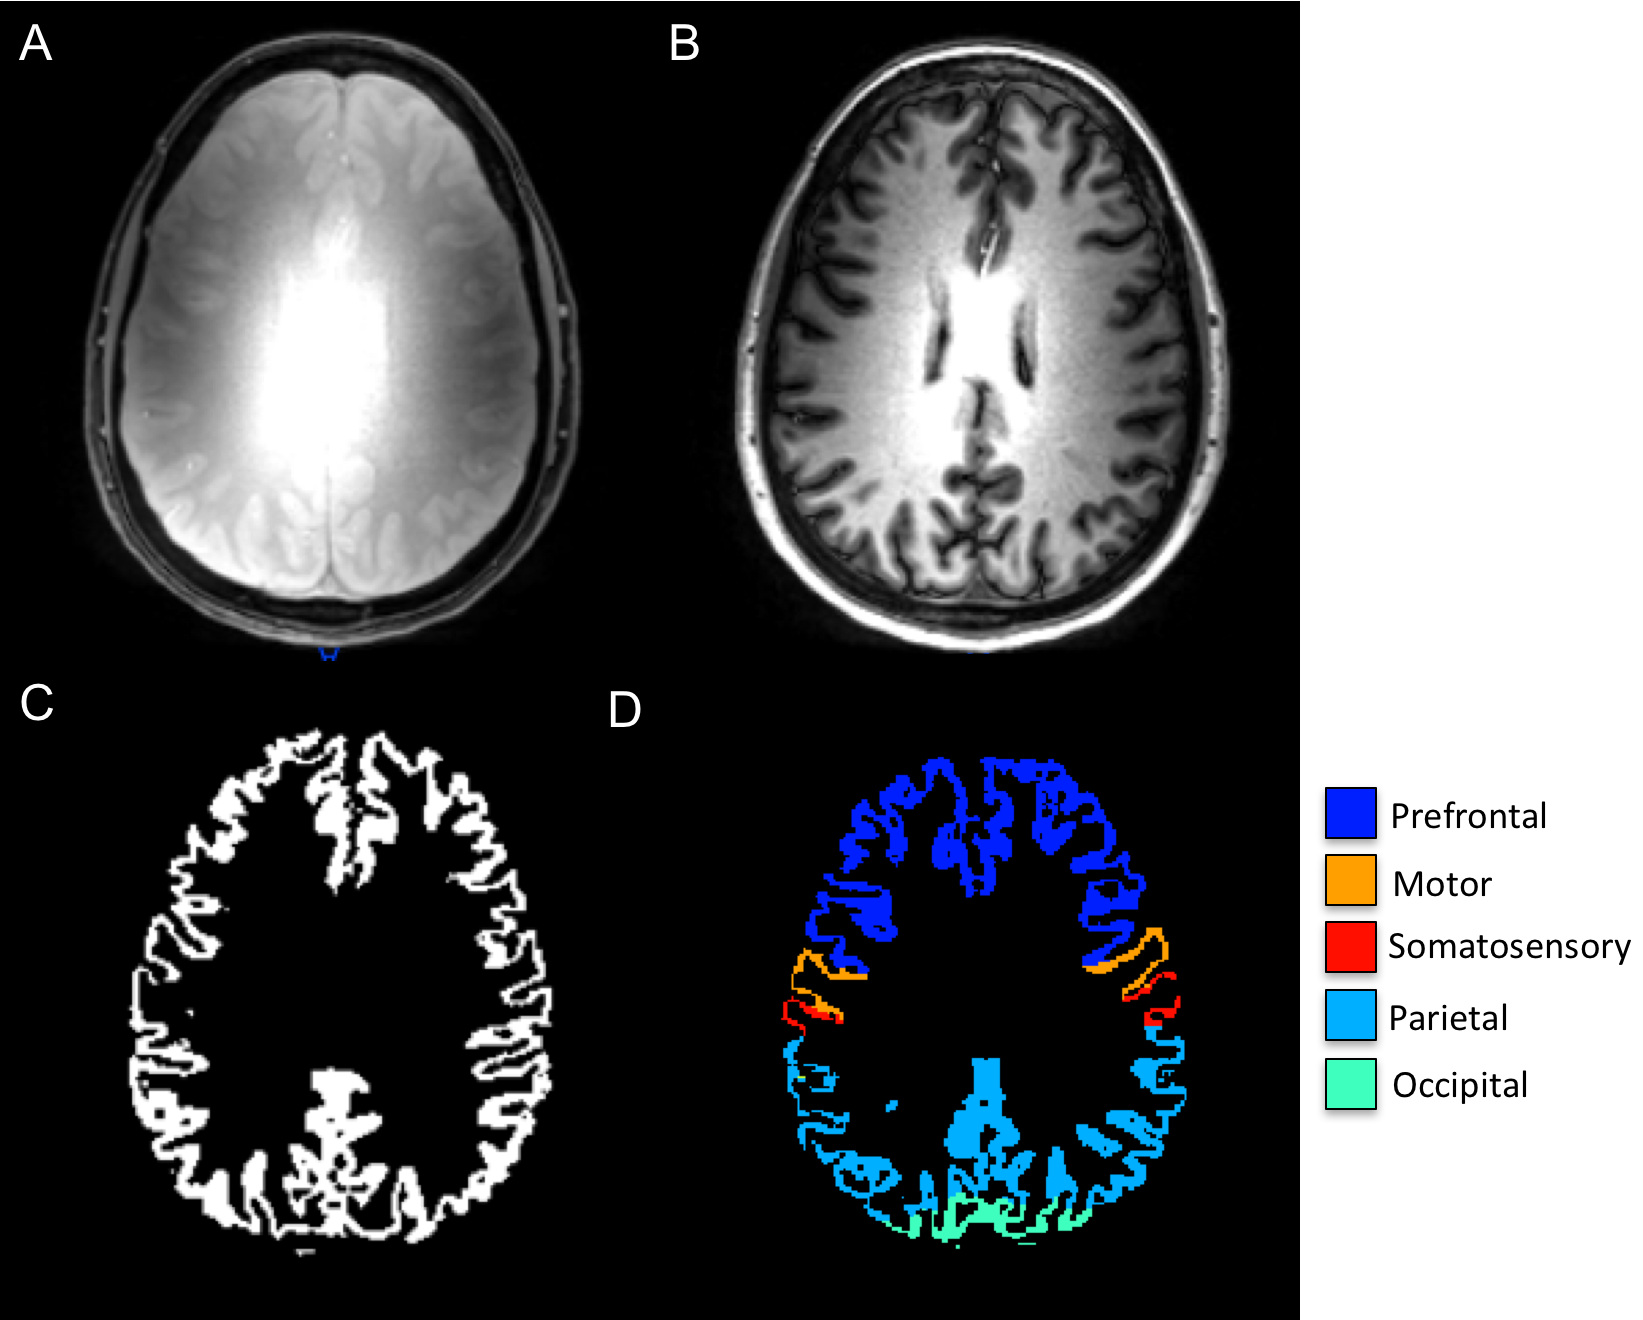
SIR-qMT was performed on a Philips Achieva 7T with 2 channel volume transmit and a 32 channel receive head coil using a modified inversion recovery sequence. Briefly, a short T2-selective inversion recovery was performed with a 3D Turbo Field Echo (TFE factor = 54) readout at 1x1x2mm3 resolution at 14 TI values (logarithmically sampled between 6-8000ms), pre-delay time = 2500ms, composite inversion pulse duration = 2ms, TE = 2.2ms, SENSE = 2 and 5 slices. The inversion recovery data was fit to a 2-pool model including exchange and the PSR, rate of MT exchange (kmf), and longitudinal relaxation rate (R1f) were estimated. All SIR data were coregistered to an acquired MPRAGE using a 12 degree of freedom affine in FLIRT (FSL, Oxford UK). Gray (GM) and white matter (WM) were segmented from the MPRAGE and propagated to the PSR, kmf, and R1f maps, and GM was further segmented into 7 different regions using multi-atlas labeling.12 (Figure 1). After signed, informed consent, SIR qMT data were obtained in 19 MS patients (ages 30-43, 15 female) and 37 healthy controls (ages 21-56, 25 female).
Statistical comparisons were performed in two ways: 1) cross-sectional – mean total cGM PSR, kmf, and R1f were compared across cohorts using a two-tailed, two-sample t-test. 2) PSR, kmf, and R1f derived from 3 functionally eloquent cortices (parietal, somatosensory, and prefrontal) were correlated with measures of CI: symbol digit modality test (SDMT) and choice reaction time (CRT) using partial linear correlation controlling for age. Lastly, each qMT-derived index for all GM was correlated with EDSS using Spearman's correlation coefficient. Significance was determined by the p-value associated with the correlation statistic.
Results
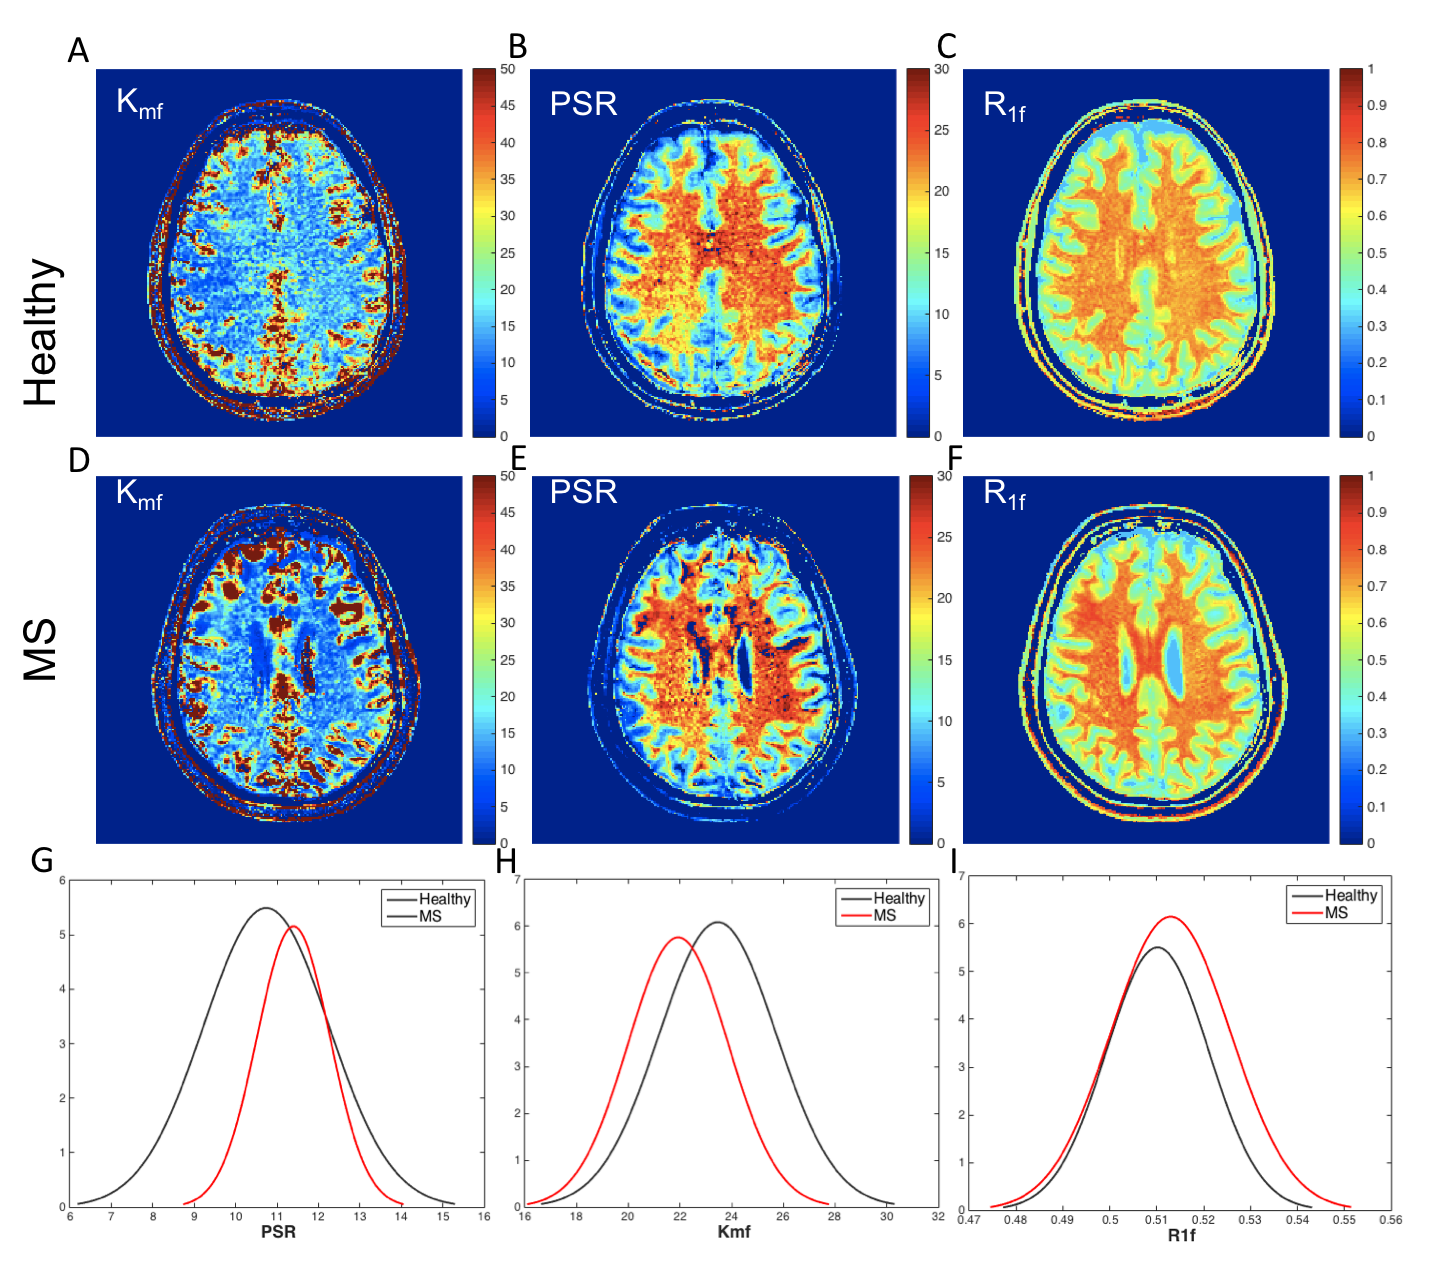
Figure 2 shows SIR-qMT-derived indices in a healthy volunteer and a patient with MS and concomitant CI. Uniquely, the rate of MT exchange (kmf) was the most significant indicator of disease. MS patients exhibited ~10% reduction (p=0.03) in mean kmf over all cGM voxels compared to age-matched healthy controls (Figure 2, G-I). The mean patient kmf was strongly correlated with EDSS (R=-0.79, p=-9.61e-5). Of the eloquent cGM regions, the parietal cortex exhibited the most significant kmf reduction (~8%, p=0.047).
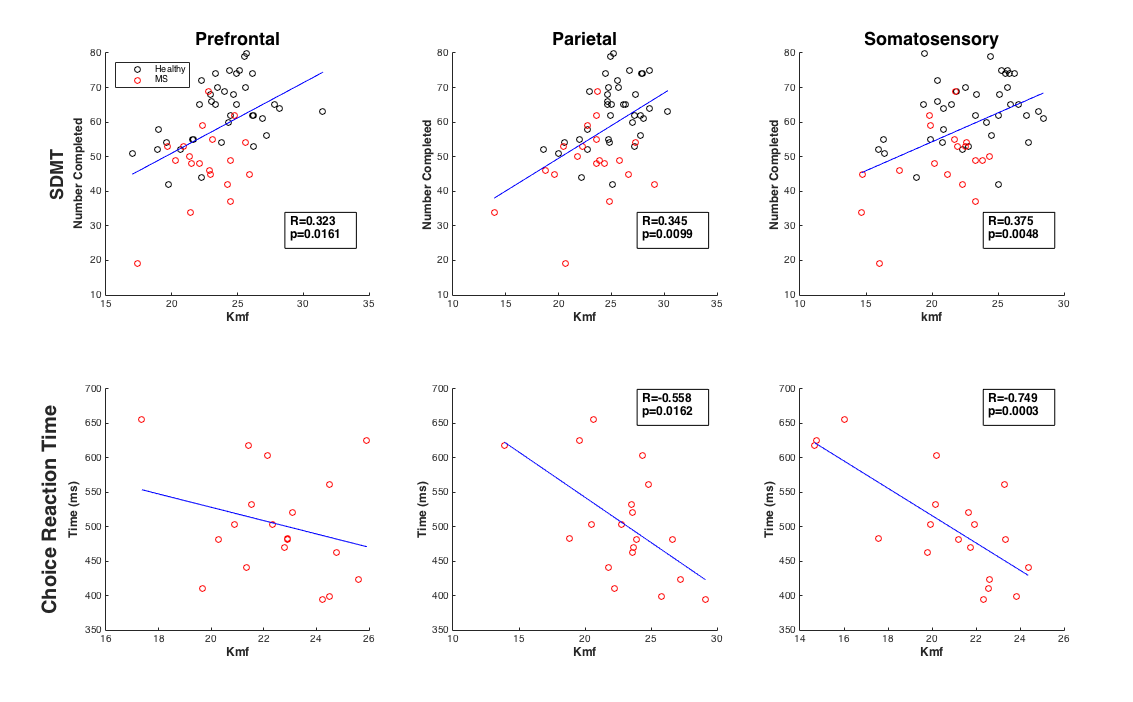
When compared with cognitive performance (SDMT, CRT), kmf correlated most strongly with SDMT in all cGM (patients and controls), and in prefrontal, parietal, and somatosensory cortices (Figure 3). Contrary to our hypothesis, the PASAT test did not show the most associations with the total cGM qMT parameters; however, in the patient cohort, prefrontal kmf was significantly associated with PASAT (R=0.52, p=0.03). Significant correlations between kmf and CRT were uniquely higher in the patient sample than the combined sample for the total cGM and the parietal and somatosensory cortices (Figure 4).
Discussion and Conclusion
Often, kmf is ignored in qMT analysis. However, we found a significant reduction in kmf in cGM of MS patients using SIR-qMT, unique association with EDSS score, and strong correlation with cognitive performance indicating that kmf may be a significant biomarker of GM damage in MS and should not be ignored with conventional qMT analysis. 7T qMT has not been studied in MS patients and we present for the first time a method to understand damage to the cGM and its relationship to cognition using advanced, quantitative methods.Acknowledgements
The authors would like to acknowledge all of the patients and control subjects who volunteered for our study, Dr. Paul Newhouse for help with design of cognitive testing methods, and our MRI technologists; Kristin George-Durrett, Leslie McIntosh, Clair Jones, and Chris Thompson. This work was supported in part by funding from DOD W81XWH-13-0073, NIH/NIBIB R21 NS087465-01, NIH/NIBIB R01 EY023240 01A1 (Smith), and The National MS Society.References
1. Chiaravalloti ND, DeLuca J. Cognitive impairment in multiple sclerosis. Lancet Neurol 2008;7(12):1139-1151.
2. Brownell B, Hughes JT. The distribution of plaques in the cerebrum in multiple sclerosis. J Neurol Neurosurg Psychiatry 1962;25:315-320.
3. Dortch RD, Li K, Gochberg DF, Welch EB, Dula AN, Tamhane AA, Gore JC, Smith SA. Quantitative magnetization transfer imaging in human brain at 3 T via selective inversion recovery. Magn Reson Med;66(5):1346-1352.
4. Gochberg DF, Gore JC. Quantitative magnetization transfer imaging via selective inversion recovery with short repetition times. Magn Reson Med 2007;57(2):437-441.
5. Ropele S, Seifert T, Enzinger C, Fazekas F. Method for quantitative imaging of the macromolecular 1H fraction in tissues. Magn Reson Med 2003;49(5):864-871.
6. Sled JG, Pike GB. Quantitative imaging of magnetization transfer exchange and relaxation properties in vivo using MRI. Magn Reson Med 2001;46(5):923-931.
7. Smith SA, Golay X, Fatemi A, Mahmood A, Raymond GV, Moser HW, van Zijl PC, Stanisz GJ.Quantitative magnetization transfer characteristics of the human cervical spinal cord in vivo: application to adrenomyeloneuropathy. Magn Reson Med 2009;61(1):22-27.
8. Stanisz GJ, Kecojevic A, Bronskill MJ, Henkelman RM. Characterizing white matter with magnetization transfer and T(2). Magn Reson Med 1999;42(6):1128-1136.
9. Tozer D, Ramani A, Barker GJ, Davies GR, Miller DH, Tofts PS. Quantitative magnetization transfer mapping of bound protons in multiple sclerosis. Magn Reson Med 2003;50(1):83-91.
10. Yarnykh VL, Yuan C. Cross-relaxation imaging reveals detailed anatomy of white matter fiber tracts in the human brain. Neuroimage 2004;23(1):409-424.
11. Gochberg DF, Gore JC. Quantitative magnetization transfer imaging via selective inversion recovery with short repetition times. Magn Reson Med 2007;57(2):437-441.
12. Asman A.J. and Landman B.A. Hierarchical performance estimation in the statistical label fusion framework. Medical image analysis, 2014. 18(7): p. 1070-81.
Figures