0018
Towards in vivo spinal cord cyto- and myelo-architecture deciphering using multi-modal MRI parcellation at 7T1CRMBM, Aix-Marseille Univ, CNRS, Marseille, France, 2Pôle d'imagerie médicale, Hôpital de la Timone, CEMEREM, AP-HM, Marseille, France, 3iLab-Spine international associate laboratory, Marseille/Montréal, France
Synopsis
Ultra-high-field MRI offers exciting perspectives for the in vivo structural characterization of central nervous system tissues. Based on high-resolution multi-parametric imaging at 7T, this preliminary work focuses on the generation of new spinal cord (SC) templates, hence proposing a high-resolution T2*-w MR average with exquisite anatomical details. Parcellation of the SC substructures into individual WM tracts and motoneurone clusters was also investigated using classification methods and multimodal data (T1/T2*/DTI). Preliminary promising results revealed some insights in the underlying SC cyto- and myelo-architecture. Future developments will extend to the whole cervical cord, holding tremendous promises for studying more specific pathophysiological impairments.
Introduction
Ultra-high-field MRI offers exciting perspectives for tissue structural characterization using in vivo high-resolution multi-parametric imaging. Already employed extensively in the brain1-3, UHF opens promising new horizons for spinal cord (SC) investigations4,5. In this work, using multi-parametric MRI (mp-MRI) data and benefiting from the increased contrasts and resolution offered by the 7T, we generate a new SC template with unprecedented resolution and investigate the potential of image clustering methods and multimodal parcellation to reveal the underlying SC cyto- and myelo-architecture.Material and methods
MR acquisitions
Eight subjects (22±2y.o,4M/4F) were scanned on a 7T scanner (Siemens Healthineers, Erlangen, Germany) with a dedicated 8-ch cervical cord transceiver array (Rapid Biomedical, Rimpar, Germany). After B0 shimming and B1+ mapping, high-resolution axial 2D multi-echo GRE (0.18x0.18x3mm3, 4 echoes) and DTI single-shot-SE-EPI (0.8x0.8x3mm3, b=0,800s/mm2) sequences were acquired centered on C3, along with a 3D T1-w MP2RAGE6 (0.7x0.7x0.7mm3, TI1/2 0.7/2s). The individual GRE echoes were denoised using a non-local-means algorithm7. Highly-contrasted T2*-w images were generated after bias field removal using N48 and sum-of-square combination. T2* maps were reconstructed using mono-exponential fit to the signal decay. T1 maps were calculated after B1+ correction4. DTI metrics (FA/ADC/AD/RD) were calculated offline after eddy-current and reversed phase-encode blips distortion corrections9.
Template construction
The SC was semi-automatically segmented on the T2*-w images using PropSeg10, then non-linearly (NL) registered to a resampled version of the AMU40 T2*-w template11 to match the 7T resolution. This initial template was then used as target for an iterative (n=4) NL registration (using ANTs SyN12) of all the T2*-w data to generate a refined template taking benefits of the 7T contrast and resolution. All the transformations were forwarded to the AMU40-based WM/GM segmentations11 (to provide 7T-based probabilistic maps), and to all mp-MRI data (T1/T2*/DTI).
Multi-parametric classification - WM/GM clustering
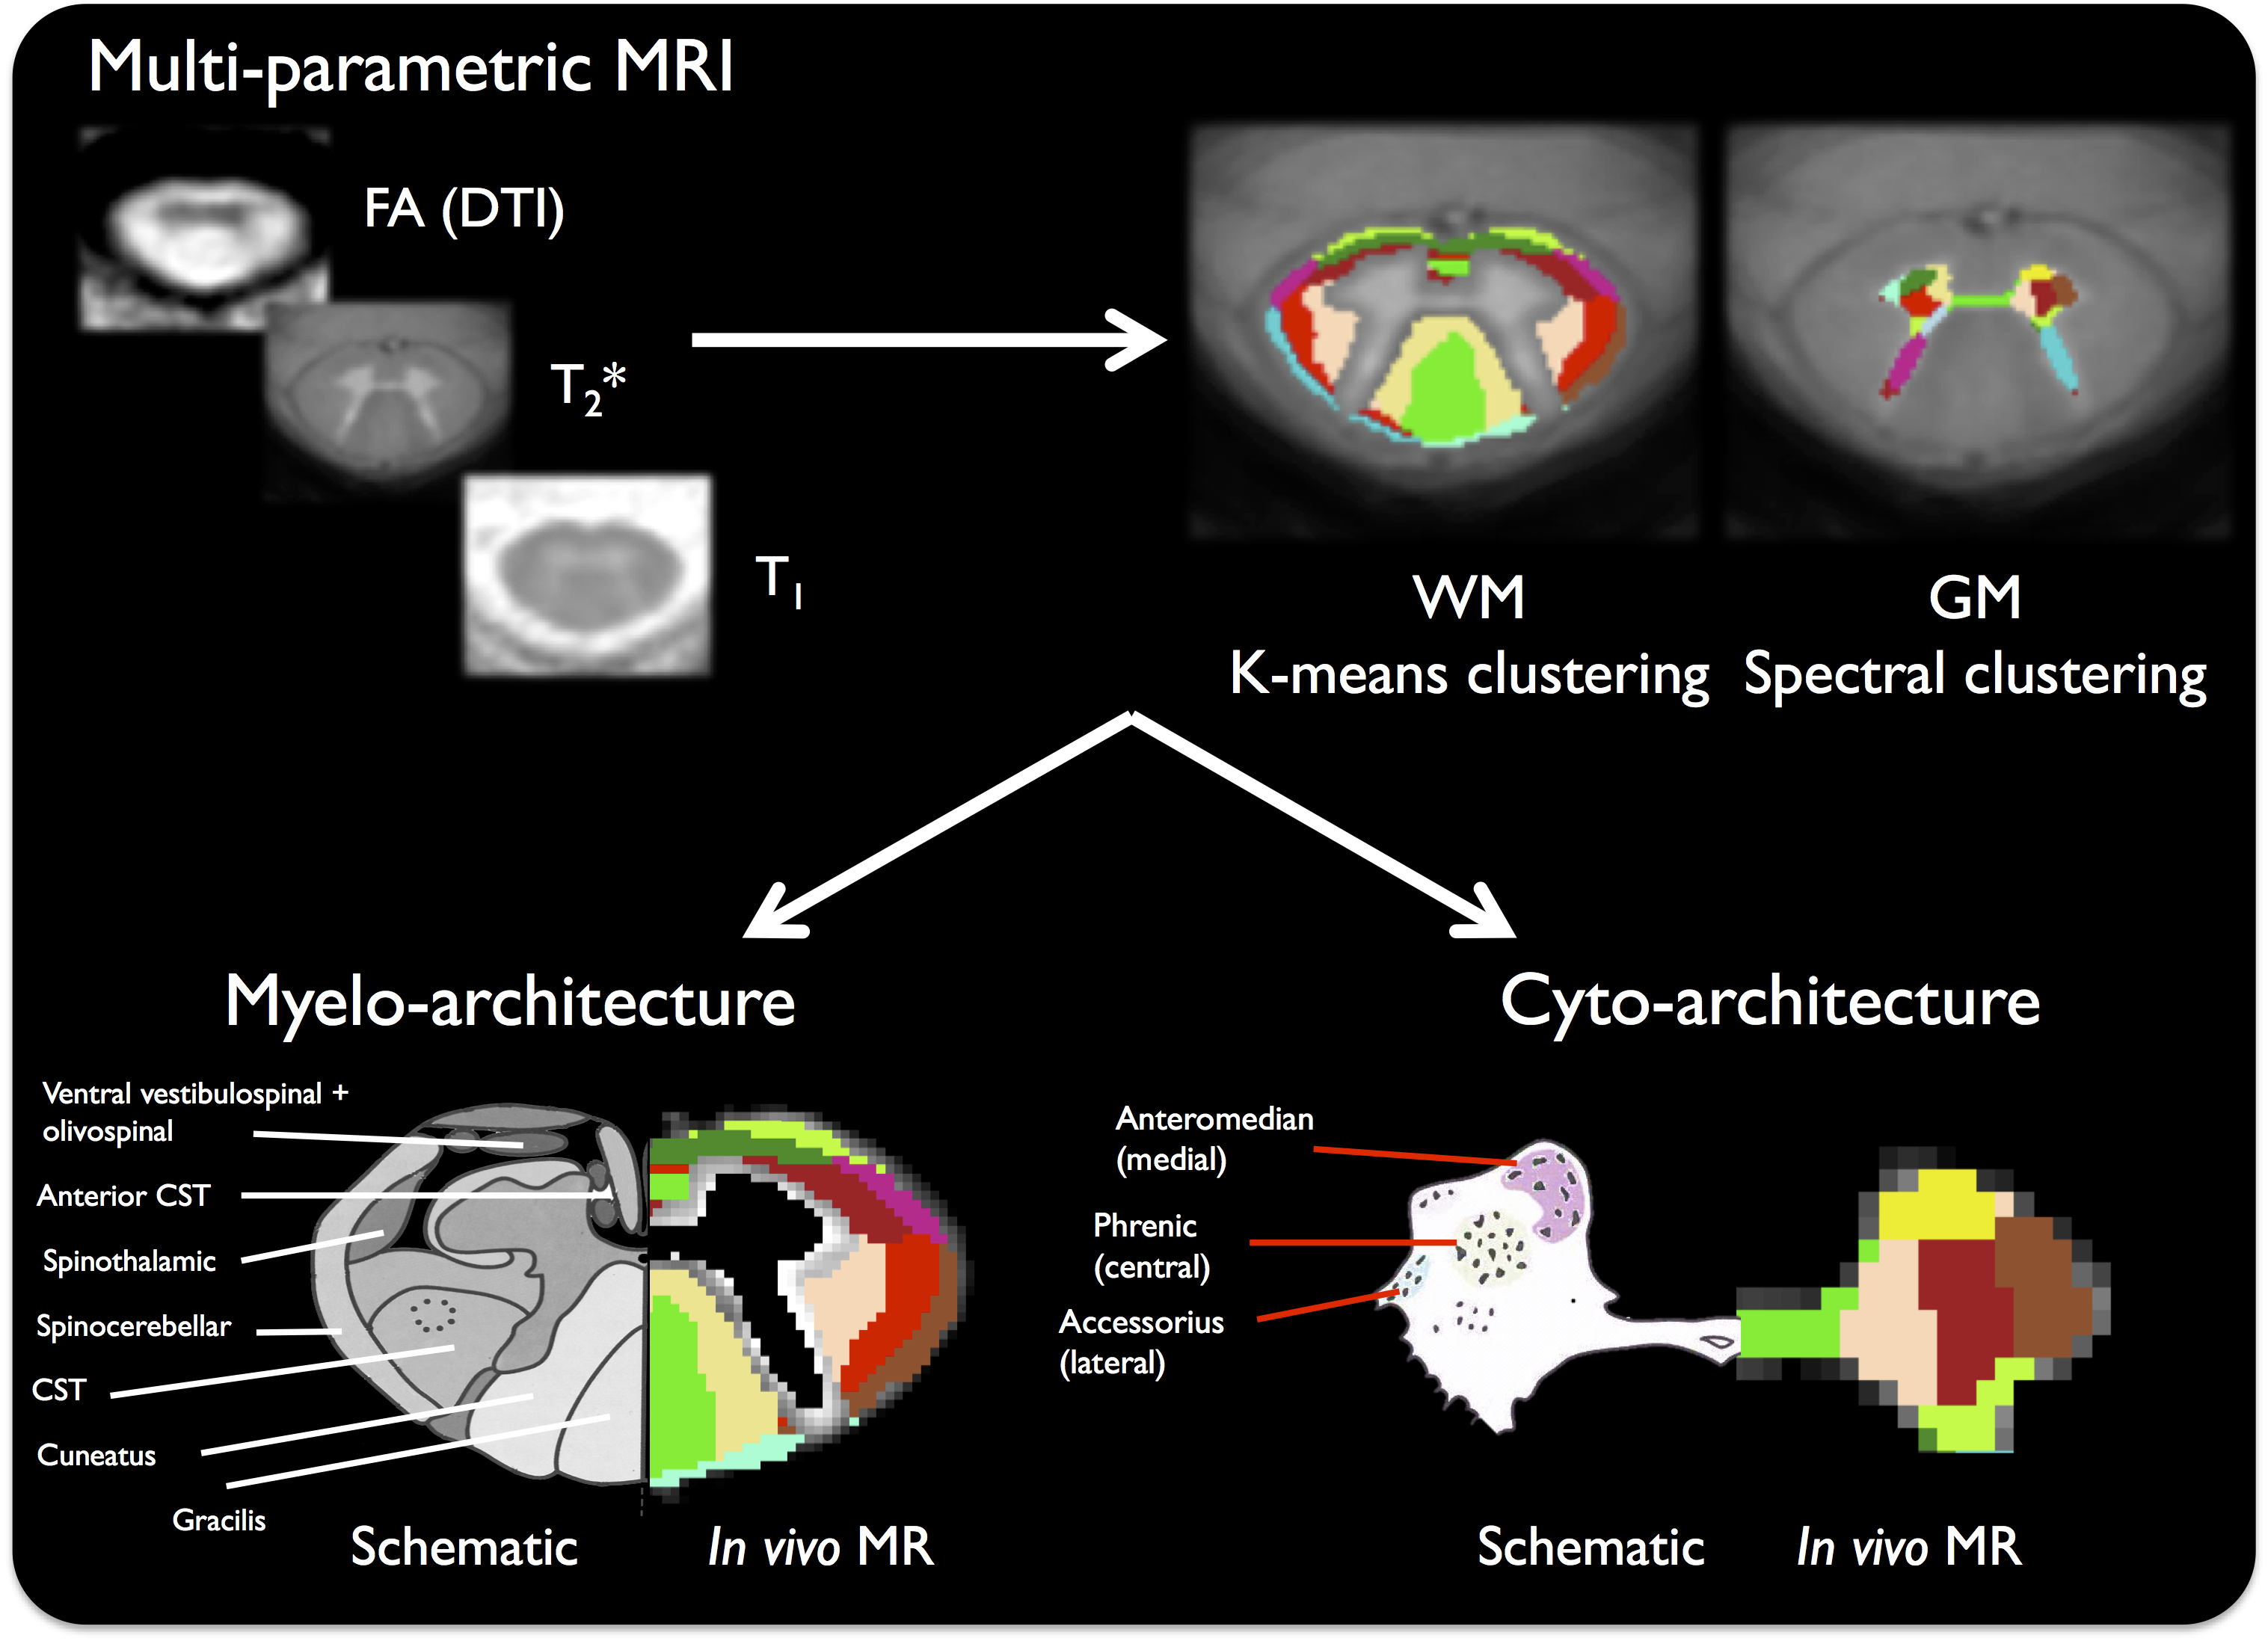
Due to important susceptibility artifacts affecting the T2* map near the posterior bony structures, WM parcellation was performed using the T2*-w, T1 map and DTI metrics, which were masked using the WM atlas thresholded at 99% to limit partial volume effect (PVE) influence. A k-means clustering was performed (under MATLAB), using all individual normalized data, without spatial constraint, from 10 to 20 classes iteratively. For the GM, both T2*/T1 maps and DTI metrics were used, masked using a 50% threshold and classified using a spectral clustering method13 (pertinent with multiple quantitative information) under MATLAB, also screening from 10 to 20 classes.
Results
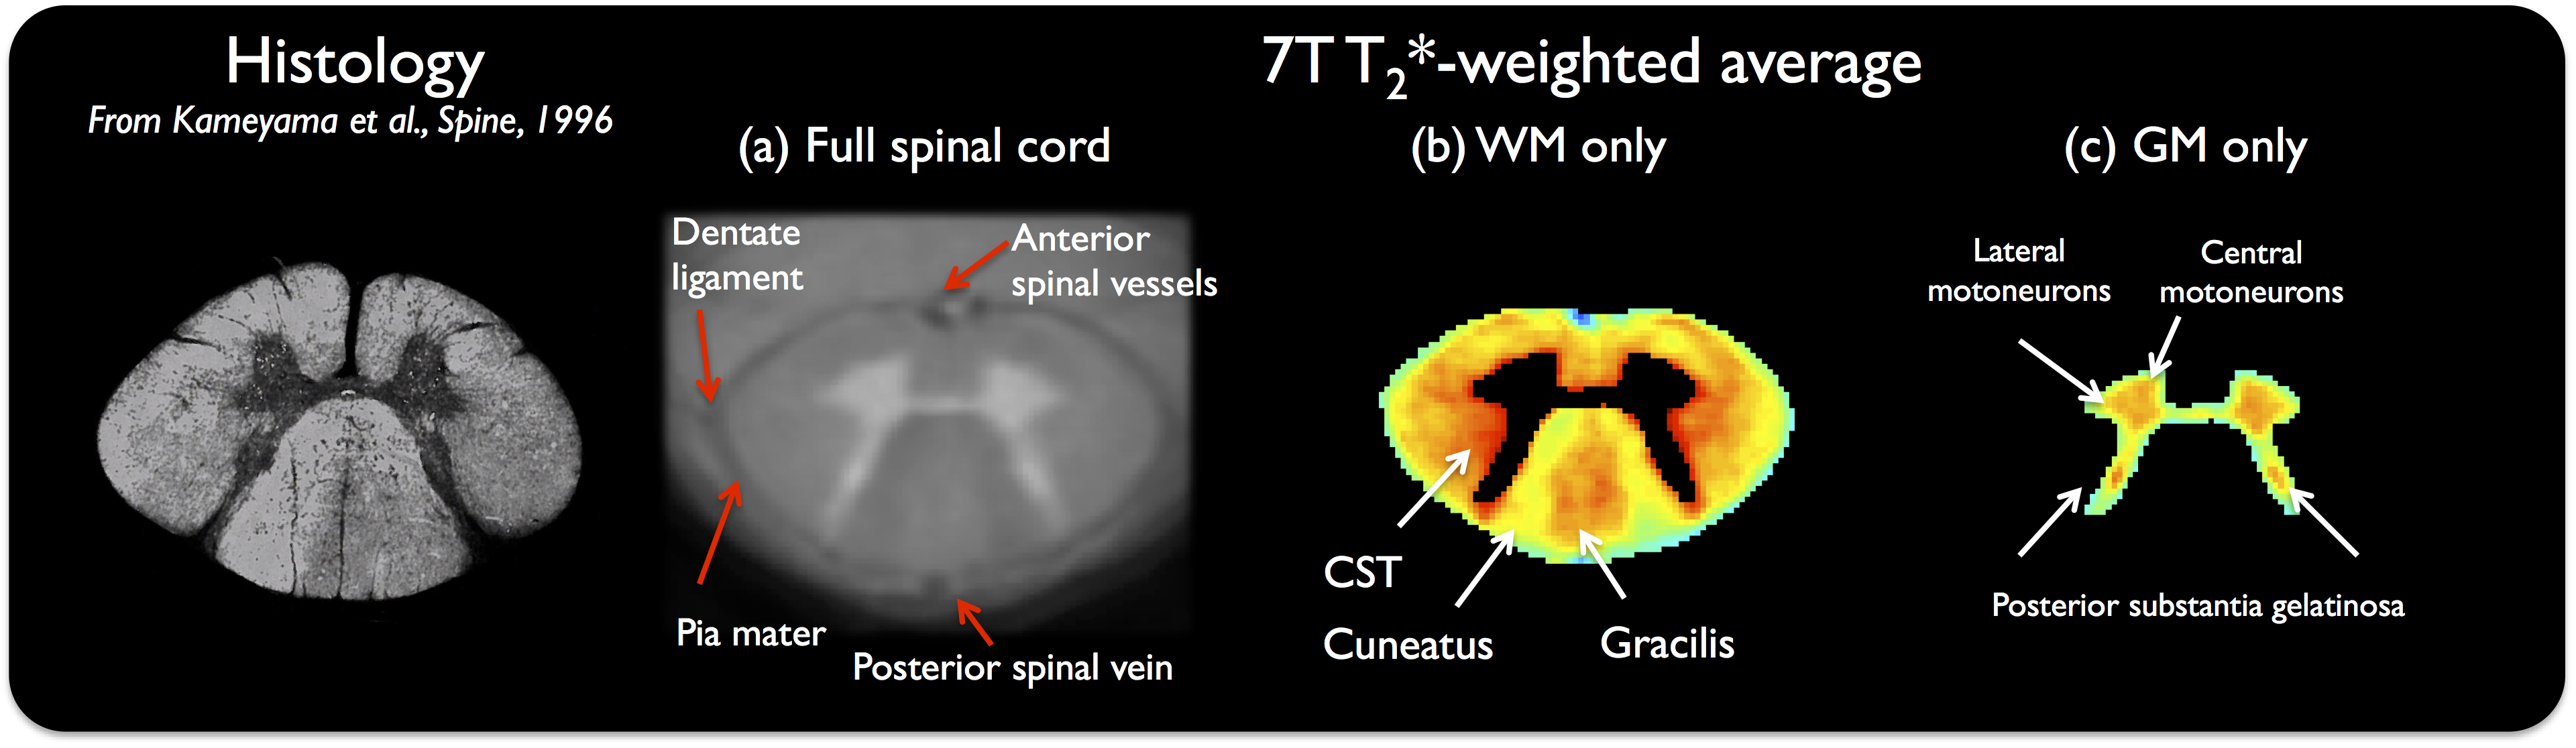
Fig.1 presents the resulting average T2*-w template at C3, in grayscale (1a), hence providing exquisite anatomical details such as meninges (pia mater) and sharp WM/GM delineation, as well as in color (b,c) to further enhance visualization of WM/GM substructures (substantia gelatinosa, gracilis and cuneatus fascicles…).
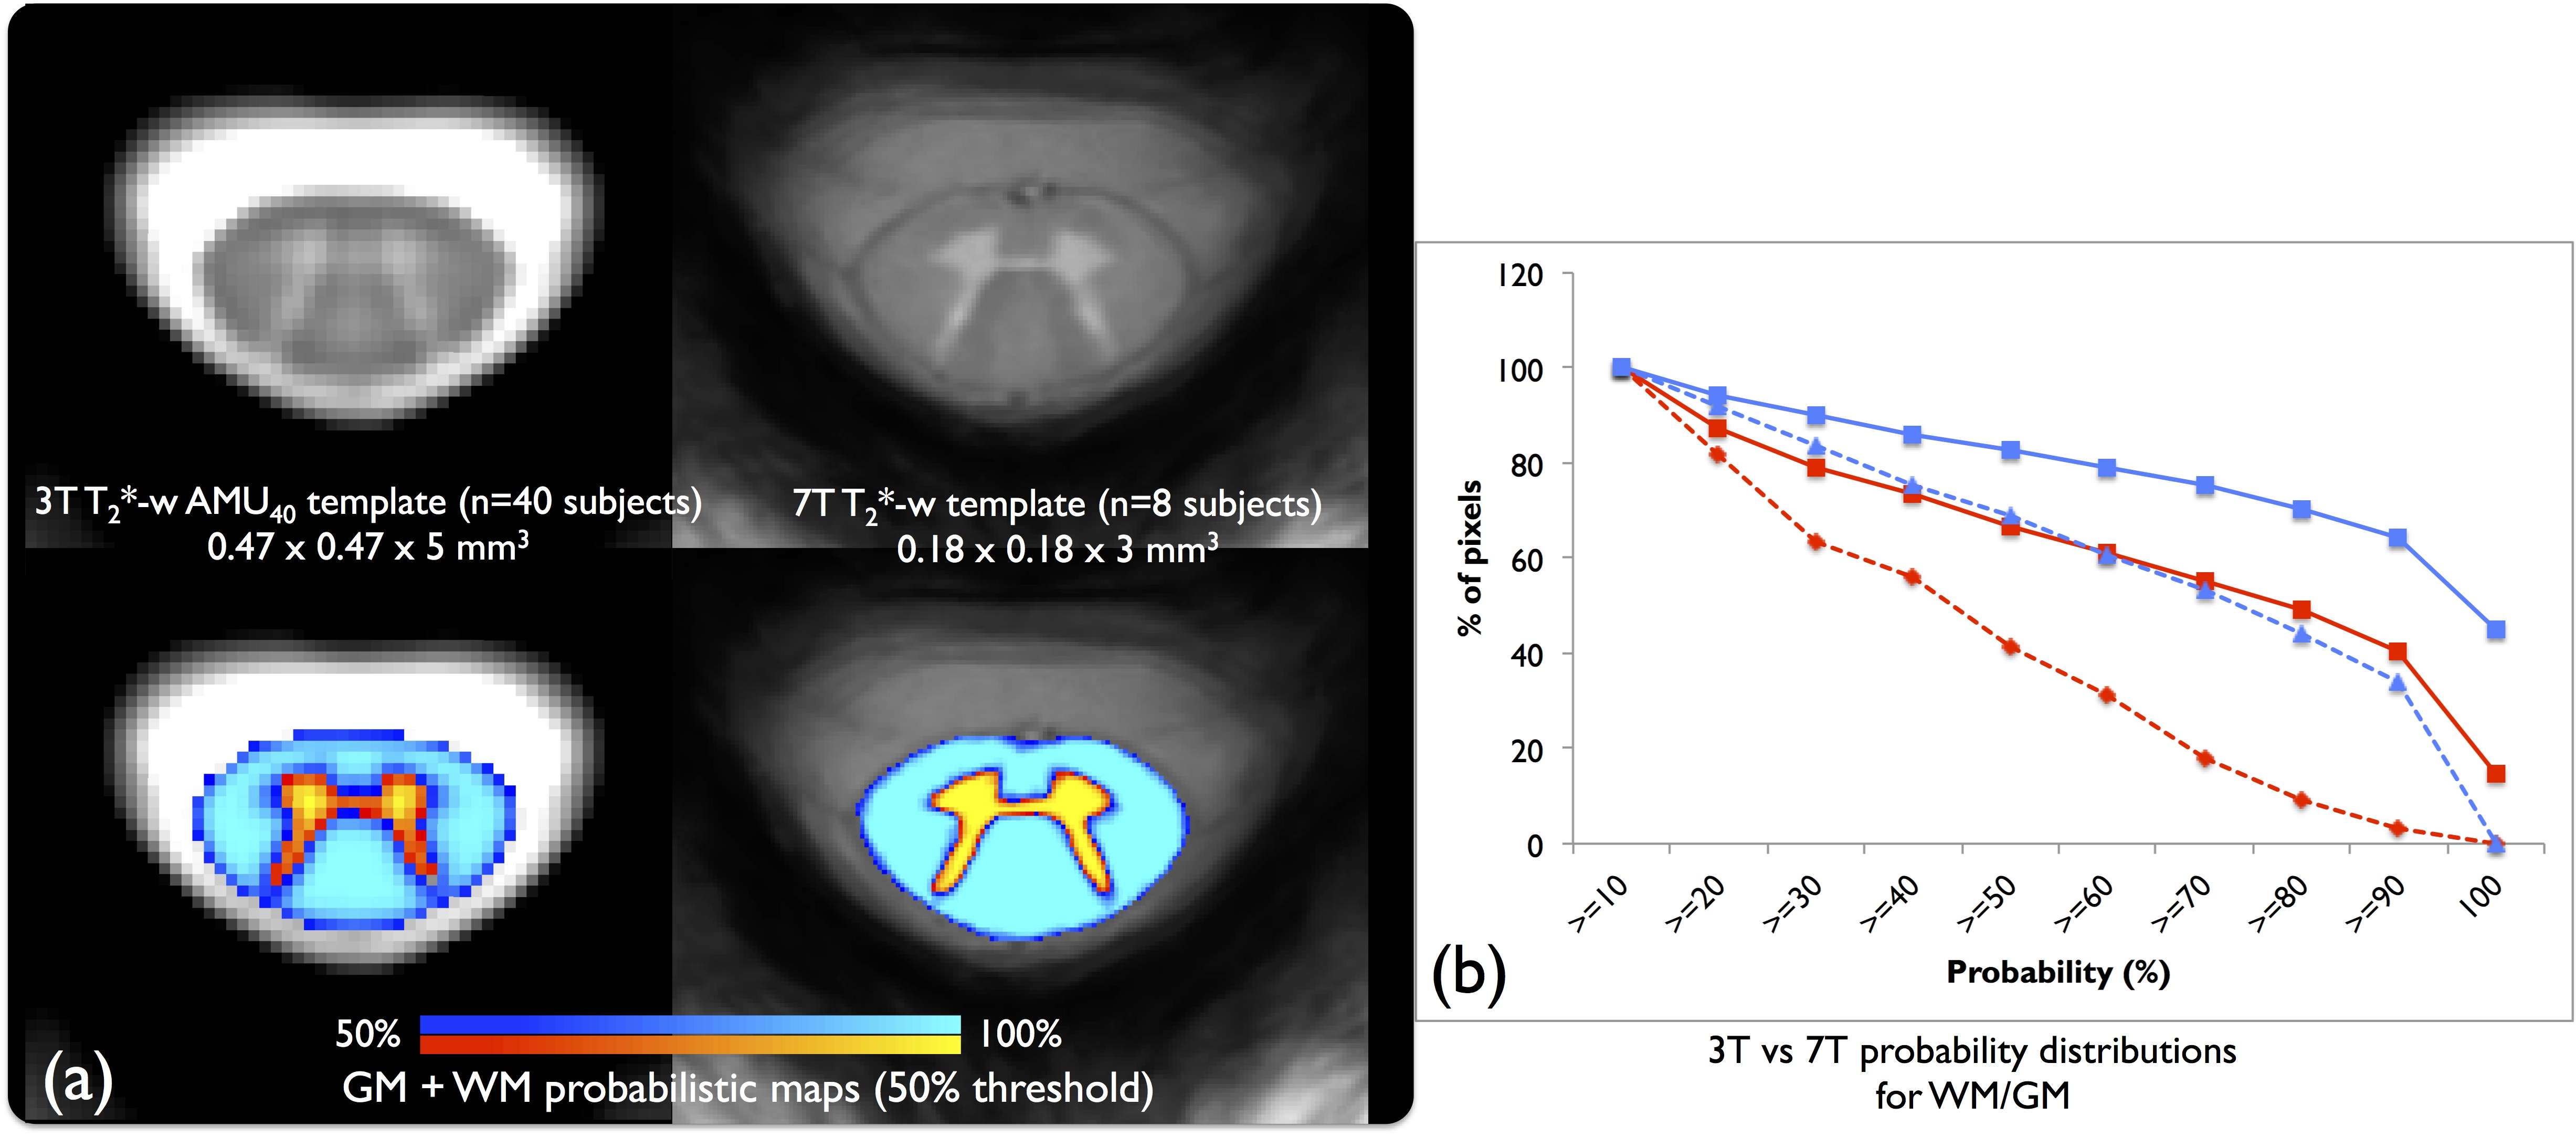
As a preliminary comparison, the 3T AMU4011 and 7T templates are presented in fig.2a to see the obvious gain in sharpness, resolution and contrast offered by the 7T. The probabilistic maps also present significant improvement compared to AMU40, with a higher pixel-count >80% in both WM/GM at 7T (fig.2b).
Finally, fig.3 shows the results of the clustering to reveal the cyto and myelo-architecture of the SC. When comparing the in vivo MR-based and schematic delineations14, the anatomical consistency of the MR-based delineation looks similar to the known organization of the SC in both WM (with 11 clusters) and GM (with 13 clusters), allowing distinguishing at least 4 main motoneuron clusters in the horns of the GM for the first time, but also numerous WM pathways. This may help further refine the only available WM template available so far, which is currently based on schematics drawn from the literature15. It is worth noting that some WM clusters could be attributed to residual PVE (on its outer edges, representing 5/11 clusters).
Discussion and conclusion
By taking benefits of the different contrasts (T1/T2*/DTI) and higher resolution offered by the 7T and image clustering methods, we propose not only a template of the SC, but also preliminary in vivo investigations of the SC cyto- and myelo-architecture. Currently limited at the C3 level, future developments will focus on whole cervical cord coverage and increased database so as to confirm those preliminary results. Higher-resolution mp-MRI data (T1/DTI), with higher diffusion models and additional contrast (e.g. MT), will also be beneficial to limit the PVE influence on the resulting SC parcellation, and to increase its accuracy, respectively. With WM/GM subdivisions coming from in vivo data, such developments may help refining existing schematic-based atlases used so far. Made publicly available, they should hold tremendous interest to conduct more robust substructure specific alterations encountered in various pathologies affecting the CNS (e.g. corticospinal and motoneurone impairment in ALS).Acknowledgements
ANR-11-EQPX-0001, A*MIDEX-EI-13-07-130115-08.38-7T-AMISTART, A*MIDEX ANR-11-IDEX-0001-02, CNRS, FLI.References
1. Cohen-Adad J, Polimeni JR, Helmer KG, et al. T(2)* mapping and B(0) orientation-dependence at 7 T reveal cyto- and myeloarchitecture organization of the human cortex. Neuroimage 2012;60:1006-1014
2. Waehnert MD, Dinse J, Schäfer A, et al. A subject-specific framework for in vivo myeloarchitectonic analysis using high resolution quantitative MRI. NeuroImage 2016;125:94-107
3. Dinse J, Härtwich N, Waehnert MD, et al. A cytoarchitecture-driven myelin model reveals area-specific signatures in human primary and secondary areas using ultra-high resolution in-vivo brain MRI. NeuroImage 2015;114:71-87
4. Massire A, Taso M, Besson P, et al. High-resolution multi-parametric quantitative magnetic resonance imaging of the human cervical spinal cord at 7T. Neuroimage 2016;143:58-69
5. Dula AN, Pawate S, Dethrage LM, et al. Chemical exchange saturation transfer of the cervical spinal cord at 7 T. NMR in Biomedicine 2016;29:1249-1257
6. Marques JP, Kober T, Krueger G, et al. MP2RAGE, a self bias-field corrected sequence for improved segmentation and T1-mapping at high field. Neuroimage 2010;49:1271-1281
7. Coupe P, Yger P, Prima S, et al. An optimized blockwise nonlocal means denoising filter for 3-D magnetic resonance images. IEEE transactions on medical imaging 2008;27:425-441
8. Tustison NJ, Avants BB, Cook PA, et al. N4ITK: improved N3 bias correction. IEEE transactions on medical imaging 2010;29:1310-1320
9. Andersson JL, Skare S, Ashburner J. How to correct susceptibility distortions in spin-echo echo-planar images: application to diffusion tensor imaging. Neuroimage 2003;20:870-888
10. De Leener B, Kadoury S, Cohen-Adad J. Robust, accurate and fast automatic segmentation of the spinal cord. Neuroimage 2014;98:528-536
11. Taso M, Le Troter A, Sdika M, et al. A reliable spatially normalized template of the human spinal cord - Applications to automated white matter/gray matter segmentation and tensor-based morphometry (TBM) mapping of gray matter alterations occurring with age. Neuroimage 2015;117:20-28
12. Avants BB, Epstein CL, Grossman M, et al. Symmetric diffeomorphic image registration with cross-correlation: evaluating automated labeling of elderly and neurodegenerative brain. Med Image Anal 2008;12:26-41
13. Chen WY, Song Y, Bai H, et al. Parallel Spectral Clustering in Distributed Systems. IEEE Transactions on Pattern Analysis and Machine Intelligence 2011;33:568-586
14. Altman J, Bayer SA. Development of the human spinal cord : an interpretation based on experimental studies in animals. Oxford ; New York, N.Y.: Oxford University Press; 2001
15. Levy S, Benhamou M, Naaman C, et al. White matter atlas of the human spinal cord with estimation of partial volume effect. Neuroimage 2015;119:262-271
Figures