0017
The relationship between cortical myeloarchitecture and functional connectivity in the human brain1Sir Peter Mansfield Imaging Centre, School of Physics and Astronomy, University of Nottingham, Nottingham, United Kingdom
Synopsis
The human brain relies upon the dynamic formation and dissolution of functional networks to support ongoing cognition. The goal of this study is to establish a relationship between functional and structural networks. Using ultra-high field MRI, structural network defined by grey matter myelination is measured via quantitative Magnetization Transfer. Magnetoencephalography (MEG) was used to elucidate functional networks representing the major electrophysiological pathways of communication in the brain. Our study sheds new light on the way in which cortical microstructure supports functional networks.
Purpose
The human brain relies upon the dynamic formation and dissolution of functional networks to support ongoing cognition. The goal of this study is to seek a relationship between functional and structural networks. Using ultra-high field MRI, structural networks defined by variations in grey matter myelination across subjects was assessed via quantitative Magnetization Transfer Imaging. Magnetoencephalography (MEG) was used to elucidate functional networks representing the major electrophysiological pathways of communication in the brain1.Methods
58 healthy volunteers (age=39±12, 27 male) took part in the study.
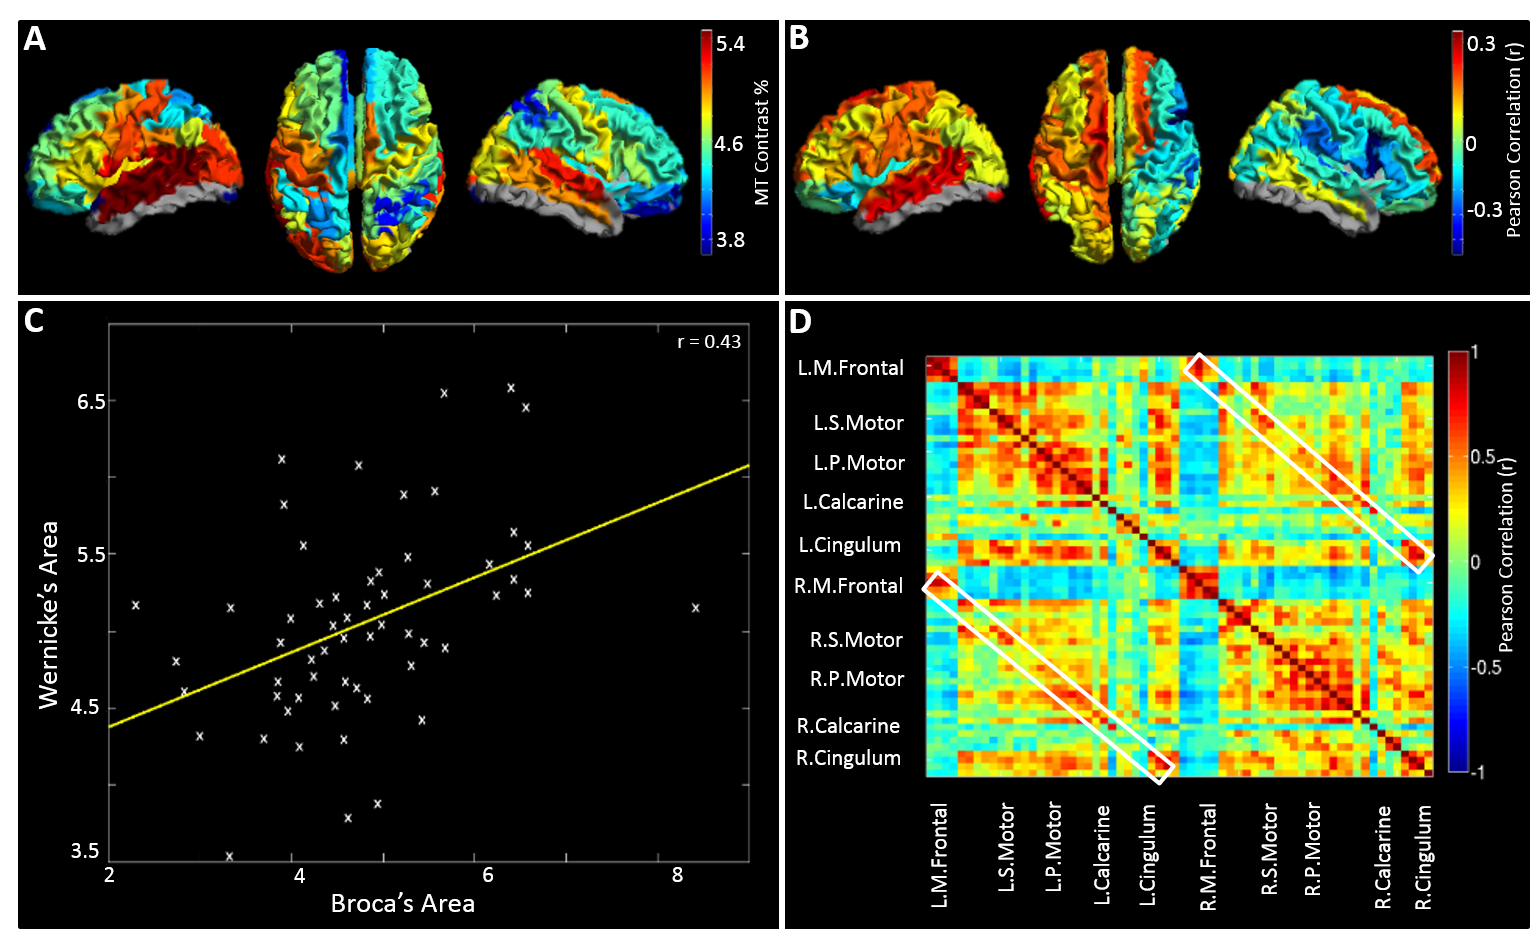
MRI: MRI data were collected using a Phillips Achieva 7T system. A T1-weighted image based on a Phase Sensitive Inversion Recovery sequence (PSIR; FOV=240x216x160mm3, 0.8mm isotropic resolution, TI1/TI2=780ms/1600ms) was acquired and used for segmentation, T1 mapping and MEG coregistration. Z-spectra data were acquired using a MT-TFE sequence2. Z-spectra were corrected for B0 variation and fitted to a database of simulated spectra to extract MT maps3, assumed to be related to myelination. The PSIR image was segmented using SPM4. Grey-matter-masked MT data were classified using the AAL atlas and a mean MT value was extracted for each region, for each participant. The modal value for each individual’s MT data was regressed from that individual’s regional values. Pearson correlation, measured across subjects, was used to quantify the relationship between MT values measured in AAL region pairs (Figure 1C). These correlation values form elements of the structural matrix in Figure 1D. An average MT map (Figure 1A) was also generated by averaging regional MT values over participants. The relationship between myelination and handedness was probed via correlation between MT and handedness score (Figure 1B).
MEG: 300s of eyes-open resting-state MEG data were acquired using a 275 channel CTF MEG system (sampling frequency of 1200Hz). Coregistration between MEG system geometry and individual brain space was achieved by matching the digitised head surface to the anatomical MRI. A scalar beamformer was used to obtain a single MEG signal representative of each AAL region, and subsequently frequency filtered into frequency bands (5) of interest. A Hilbert transform was applied to generate the amplitude envelope of oscillations. Pearson correlation was computed between envelopes for each region pair. A single adjacency matrix was generated for each subject, and frequency band, representing whole brain connectivity5. These matrices were averaged over subjects.
Results
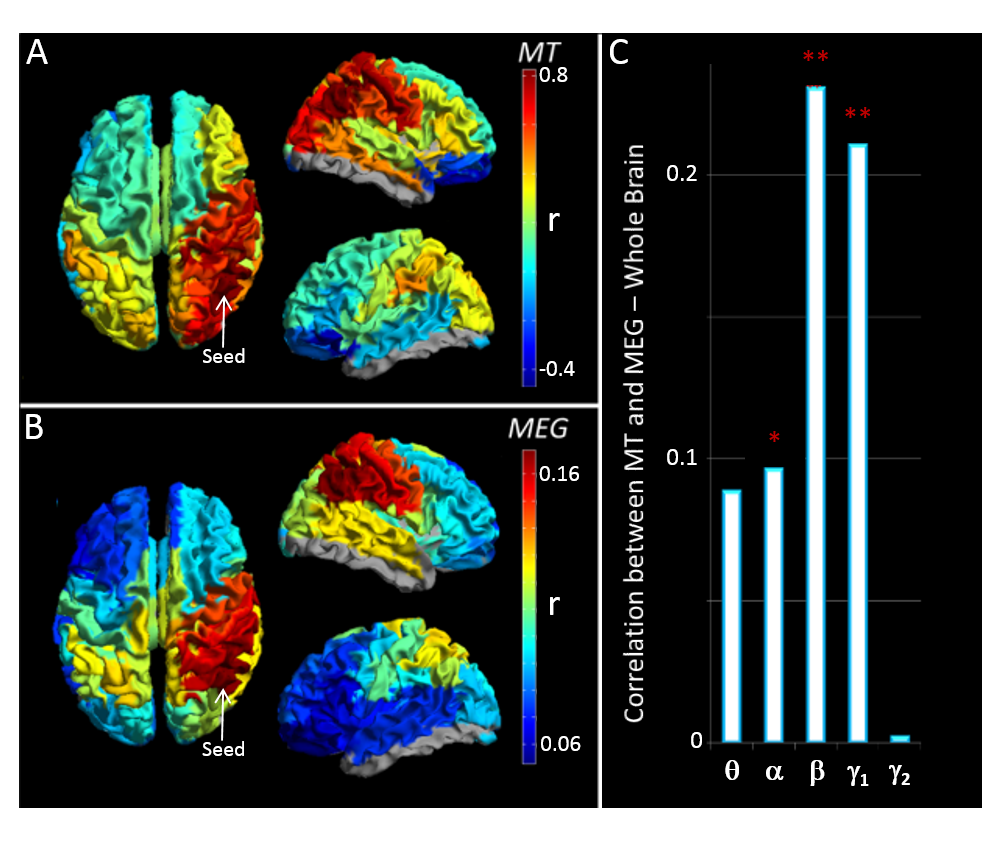
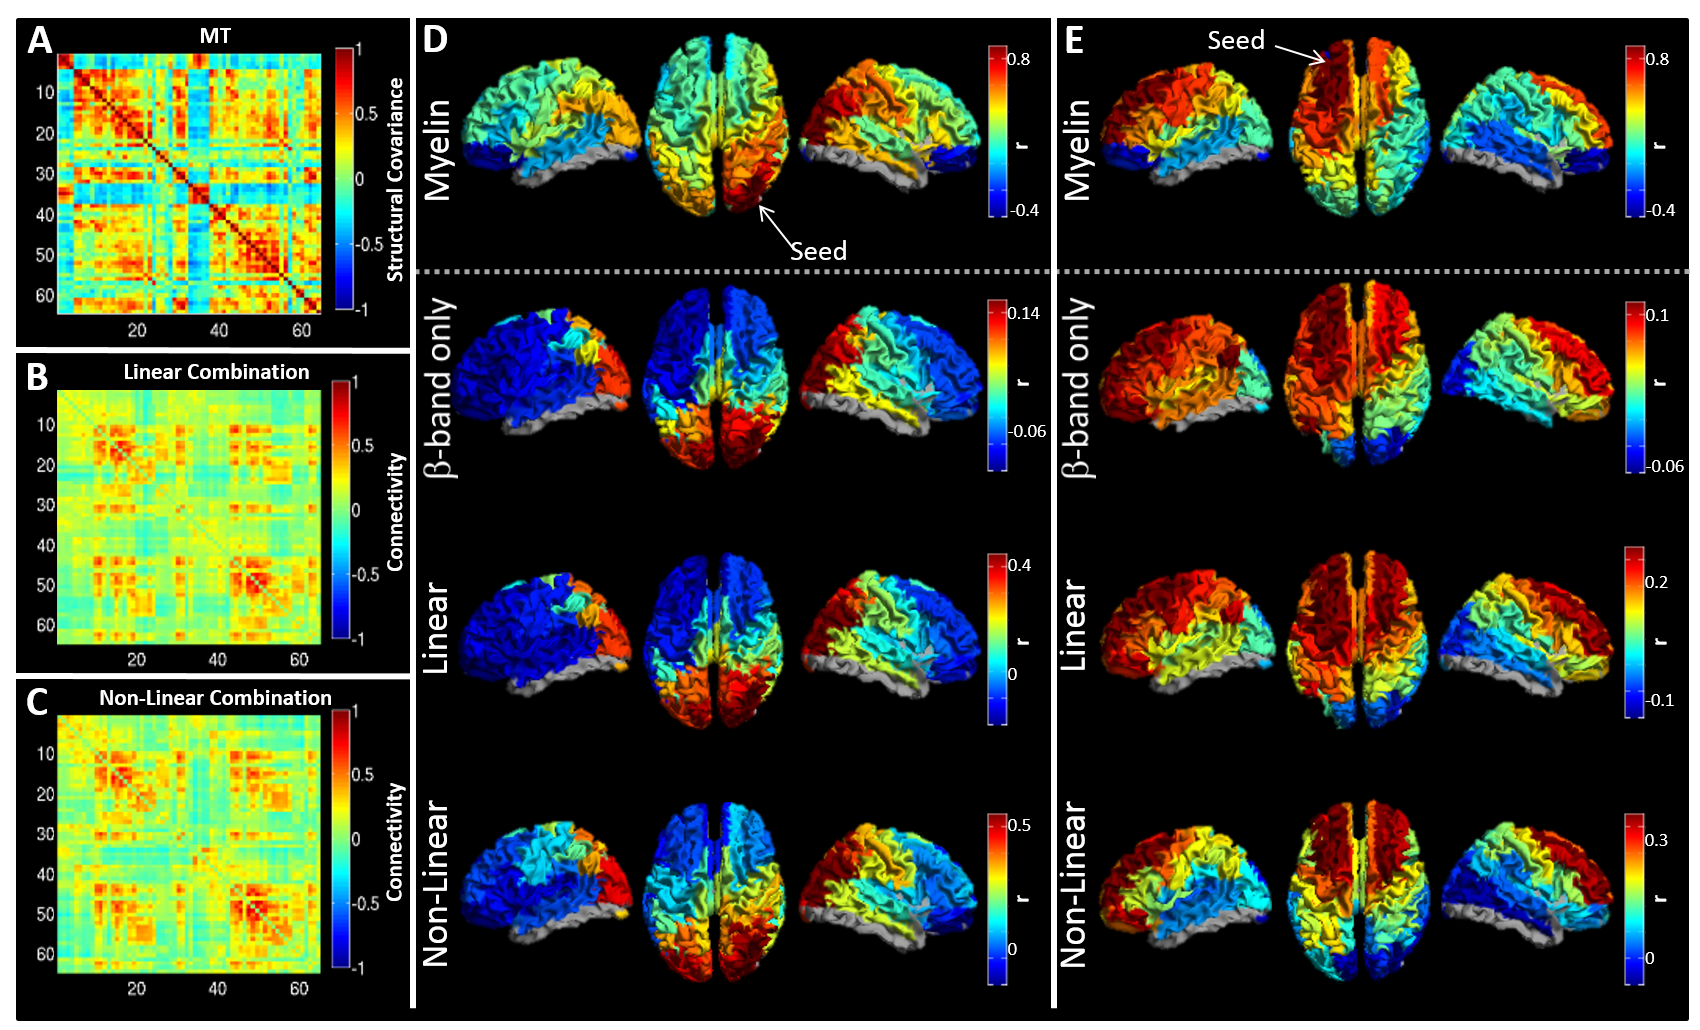
High MT was observed in primary sensory cortices (Figure 1A). Figure 1B maps the cortical variation of correlation between MT and handedness (measured using the Edinburgh Handedness Inventory). A high absolute correlation denotes regions where MT was higher in one group (positive: right handers, negative: left handers). Note a significant (p<0.05) split in the polarity of the correlation between hemispheres. Equivalent correlations can be derived between all possible AAL region pairs (Figure 1D). Figure 2A shows a ‘seed-based’ structural covariance map from a seed in the right inferior parietal cortex. Figure 2B shows the equivalent seed based map calculated using beta band MEG data. Note the strong similarity between the functional (2B), and the structural (2A) network. This relationship can be tested for all possible seed regions, computing correlation between the full MT matrix and the group averaged functional connectivity matrices for all bands. The resulting r2 values (bar chart in Figure 2C) show that only functional networks measured in the beta and low gamma bands predict significantly the spatial pattern of structural covariance. Figures 3A-C show connectivity matrices representing the structural network (A) and its prediction based upon linear (B) and non-linear (C) combinations of MEG networks. These relationships, along with that for the best single frequency band, are further visualised in Figures 3D and E which show ‘seed-based’ structural covariance (top column) alongside equivalent maps made using the beta band (upper middle), the best linear combination (lower middle) and the best non-linear combination (bottom).Discussion and conclusion
This study identifies a significant relationship between cortical myeloarchitecture as assessed by MT and functional connectivity in the human brain, with significant correlation between the structural network and functional networks mediated by neural oscillations in the beta and low gamma bands. This relationship became stronger when integrating MEG networks across frequency bands, suggesting that myeloarchitecture supports networks at all measurable electrophysiological time scales. This is a significant step towards understanding the role of myelin in shaping large scale neural networks. Our results extend recent work showing that electrical activity promotes myelination, and adds significant weight to the argument that neural oscillations are a core mediator of brain connectivity.Acknowledgements
This work was funded by Medical Research Council (MRC) UK Partnership Grant, MR/K005464/1, MRC New Investigator Research Grant (MR/M006301/1), and MRC Doctoral Training Grant, MR/K501086/1.References
1. Brookes MJ, et al. Investigating the electrophysiological basis of resting state networks using magnetoencephalography. Proc. Natl Acad. Sci. 2011, 108(40): 16783–16788.
2. Mougin O, et al. High-resolution imaging of magnetization transfer and nuclear Overhauser effect in the human visual cortex at 7 T. NMR Biomed 2013, 26(11): 1508-1517
3. Geades N, et al. Quantitative Z-spectrum Analysis of the Healthy Human Brain at 7T. Magn Reson Med. 2016, Early View.
4. SPM: http://www.fil.ion.ucl.ac.uk/spm/
5. Bookes MJ, et al. A multi-layer network approach to MEG connectivity analysis. Neuroimage 2016, 132: 425–438.
Figures