0016
The effects of B1+ correction of MP2RAGE on estimating cortical thickness and T1 at 7T1Department of Cognitive Neuroscience, Maastricht University, Maastricht, Netherlands
Synopsis
B1+ inhomogeneities can significantly affect the quantitative T1 values derived from MP2RAGE data and also automatic tissue classification, in particular in the inferior temporal and frontal lobes. Here, we investigated the effects of post-hoc correction at 7T on the T1 and apparent cortical thickness using a B1+ map for the residual transmit inhomogeneities in MP2RAGE data. We found that B1+ correction reduces these inhomogeneities leading to (1) a lower inter-subject variability, (2) enhanced localization of the GM-CSF border and (3) more accurate cortical thickness measurements.
Purpose
Ultra high magnetic field MRI (7T and higher) allows the acquisition of sub-millimeter resolution data with high signal-to-noise (SNR) and contrast-to-noise ratio (CNR) within a clinically tolerable time frame. However, confounds from transmit and receive radiofrequency fields become more problematic when going up in magnetic field strength. This can be partially circumvented by quantitative approaches, such as the one implemented in the magnetization prepared 2 rapid acquisition gradient echoes (MP2RAGE) sequence that allows whole-brain T1 characterization1. Nevertheless, residual transmit field inhomogeneities, especially in the inferior temporal and frontal lobes, are still present that significantly affect the quantitative values and automatic tissue classification. Here, we investigate the effects of post-hoc correction at 7T for these transmit inhomogeneities in the MP2RAGE data using a B1+ map2, as described previously1, on the T1 and apparent cortical thickness measured using FreeSurfer.Methods
Subjects and MRI: Nine healthy volunteers (aged 39.7 ± 8.9, 3 males) were included in this study. MP2RAGE and B1+ maps were acquired using a whole-body 7T scanner (Siemens Medical Systems, Erlangen, Germany) using a 32-channel phased-array coil (Nova Medical, Wilmington, USA). MP2RAGE datasets were acquired with a 0.7 mm isotropic resolution using the following parameters: TR/TE/TI1/TI2 5000/2.47/900/2750 ms, α1/α2 = 5°/3°, GRAPPA 3 for MP2RAGE and TR/TE = 2400/0.78 ms, TD1/TD2 = 580/1800 ms, α1/α2 = 4°/11° and GRAPPA 2 for SA2RAGE. Dielectric pads were placed proximal to the temporal lobe area to locally increase the transmit B1+ field and to improve its homogeneity across the brain3. Analysis: First, MP2RAGE and B1+ maps datasets were aligned with each other using SPM8 (Wellcome Department of Imaging Neuroscience, University College London, London, UK). Next, B1+ corrected MP2RAGE and T1 maps were obtained using the code and procedure as previously described1. The CBS tools 3.0.2 (Max Planck Institute for Human Cognitive and Brain Sciences, Leipzig, Germany) plugin for MIPAV 7.1.1 (Center for Information Technology, NIH, Bethesda, USA) was used for pre-processing (skull and dura mater stripping) the MP2RAGE volumes prior to the automatic segmentation by FreeSurfer using a modified version of the HCP high-res anatomical pipeline2. FreeSurfer analysis was run twice, using the (1) original or (2) B1+-corrected MP2RAGE volume as input, followed by coregistration to ‘fsaverage’ using mri_surf2surf to compare T1 and cortical thickness surface maps.Results
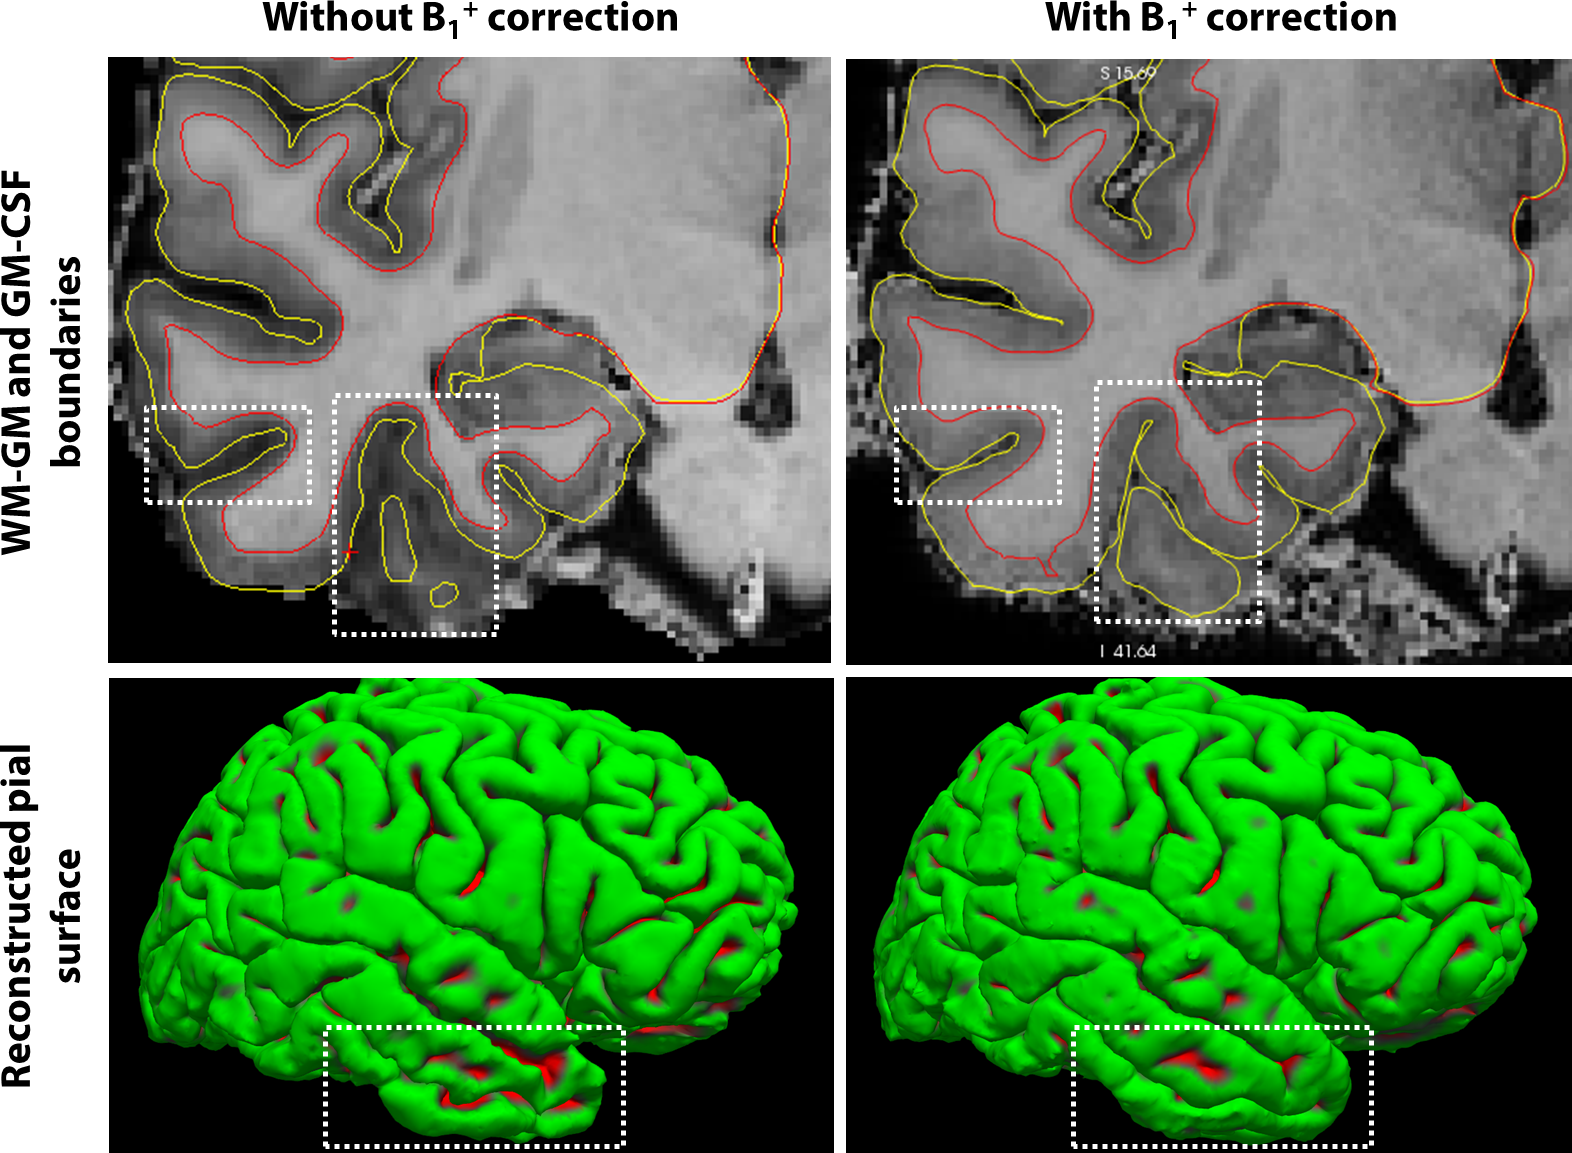
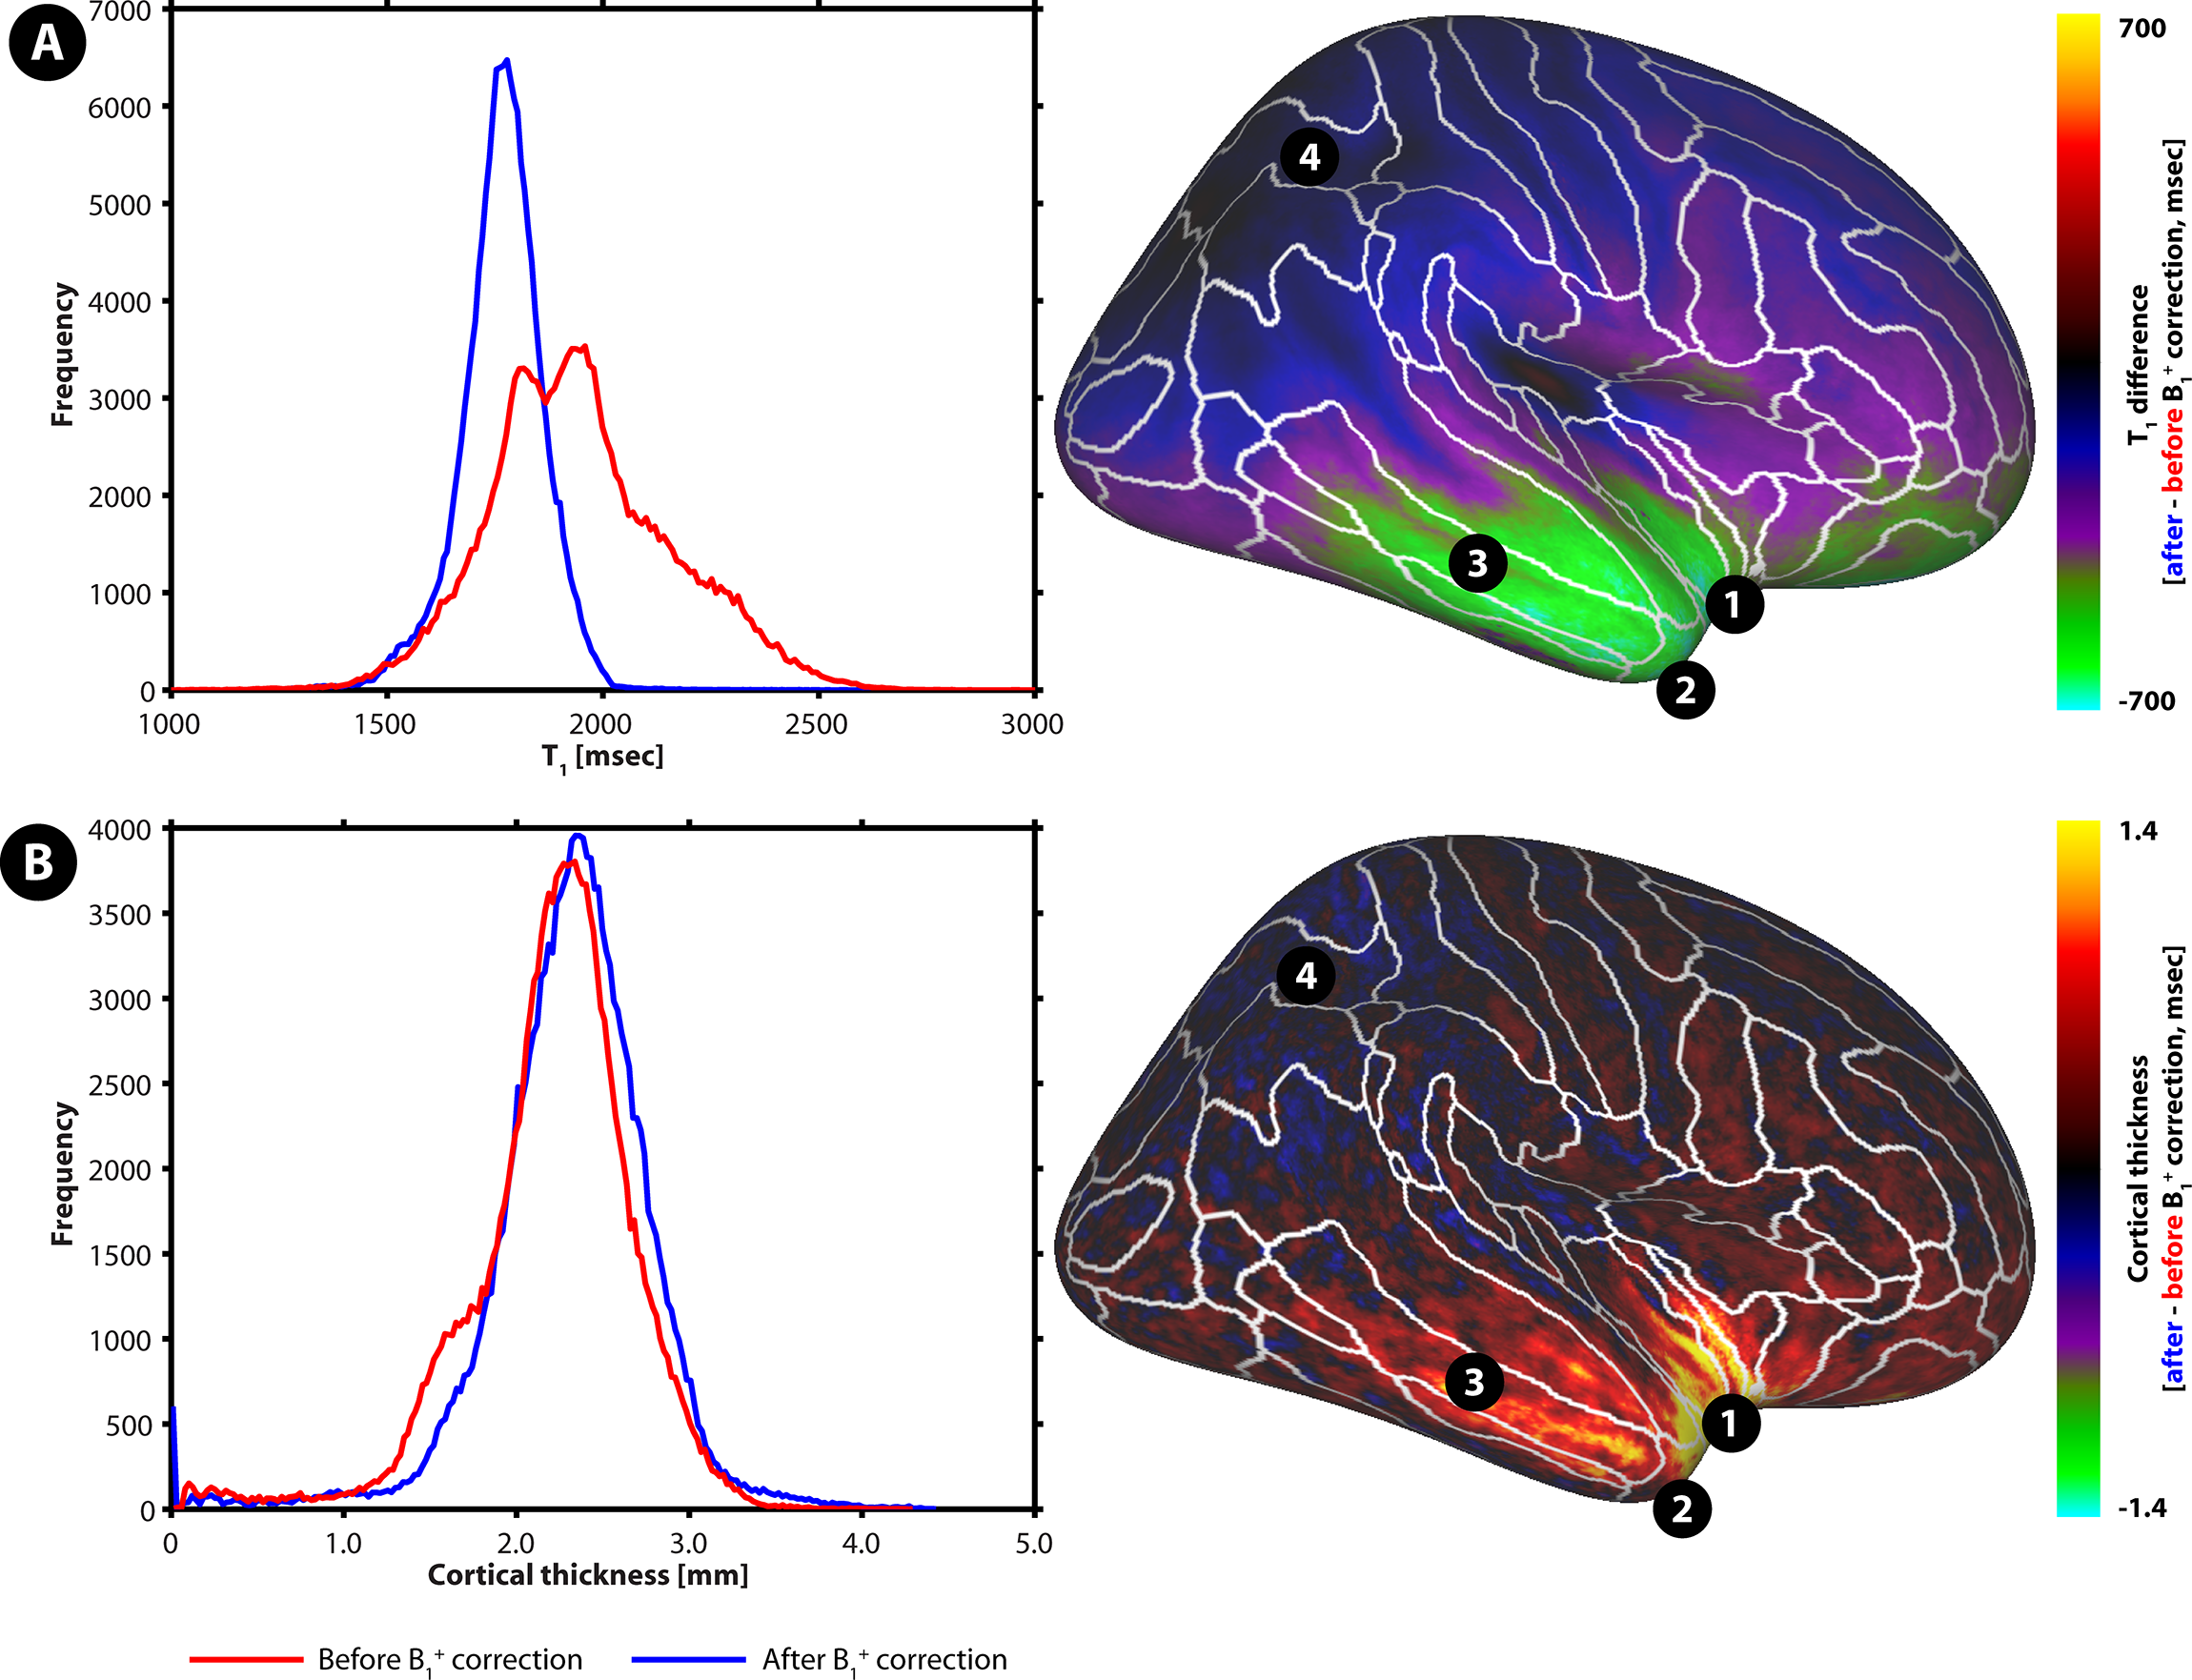
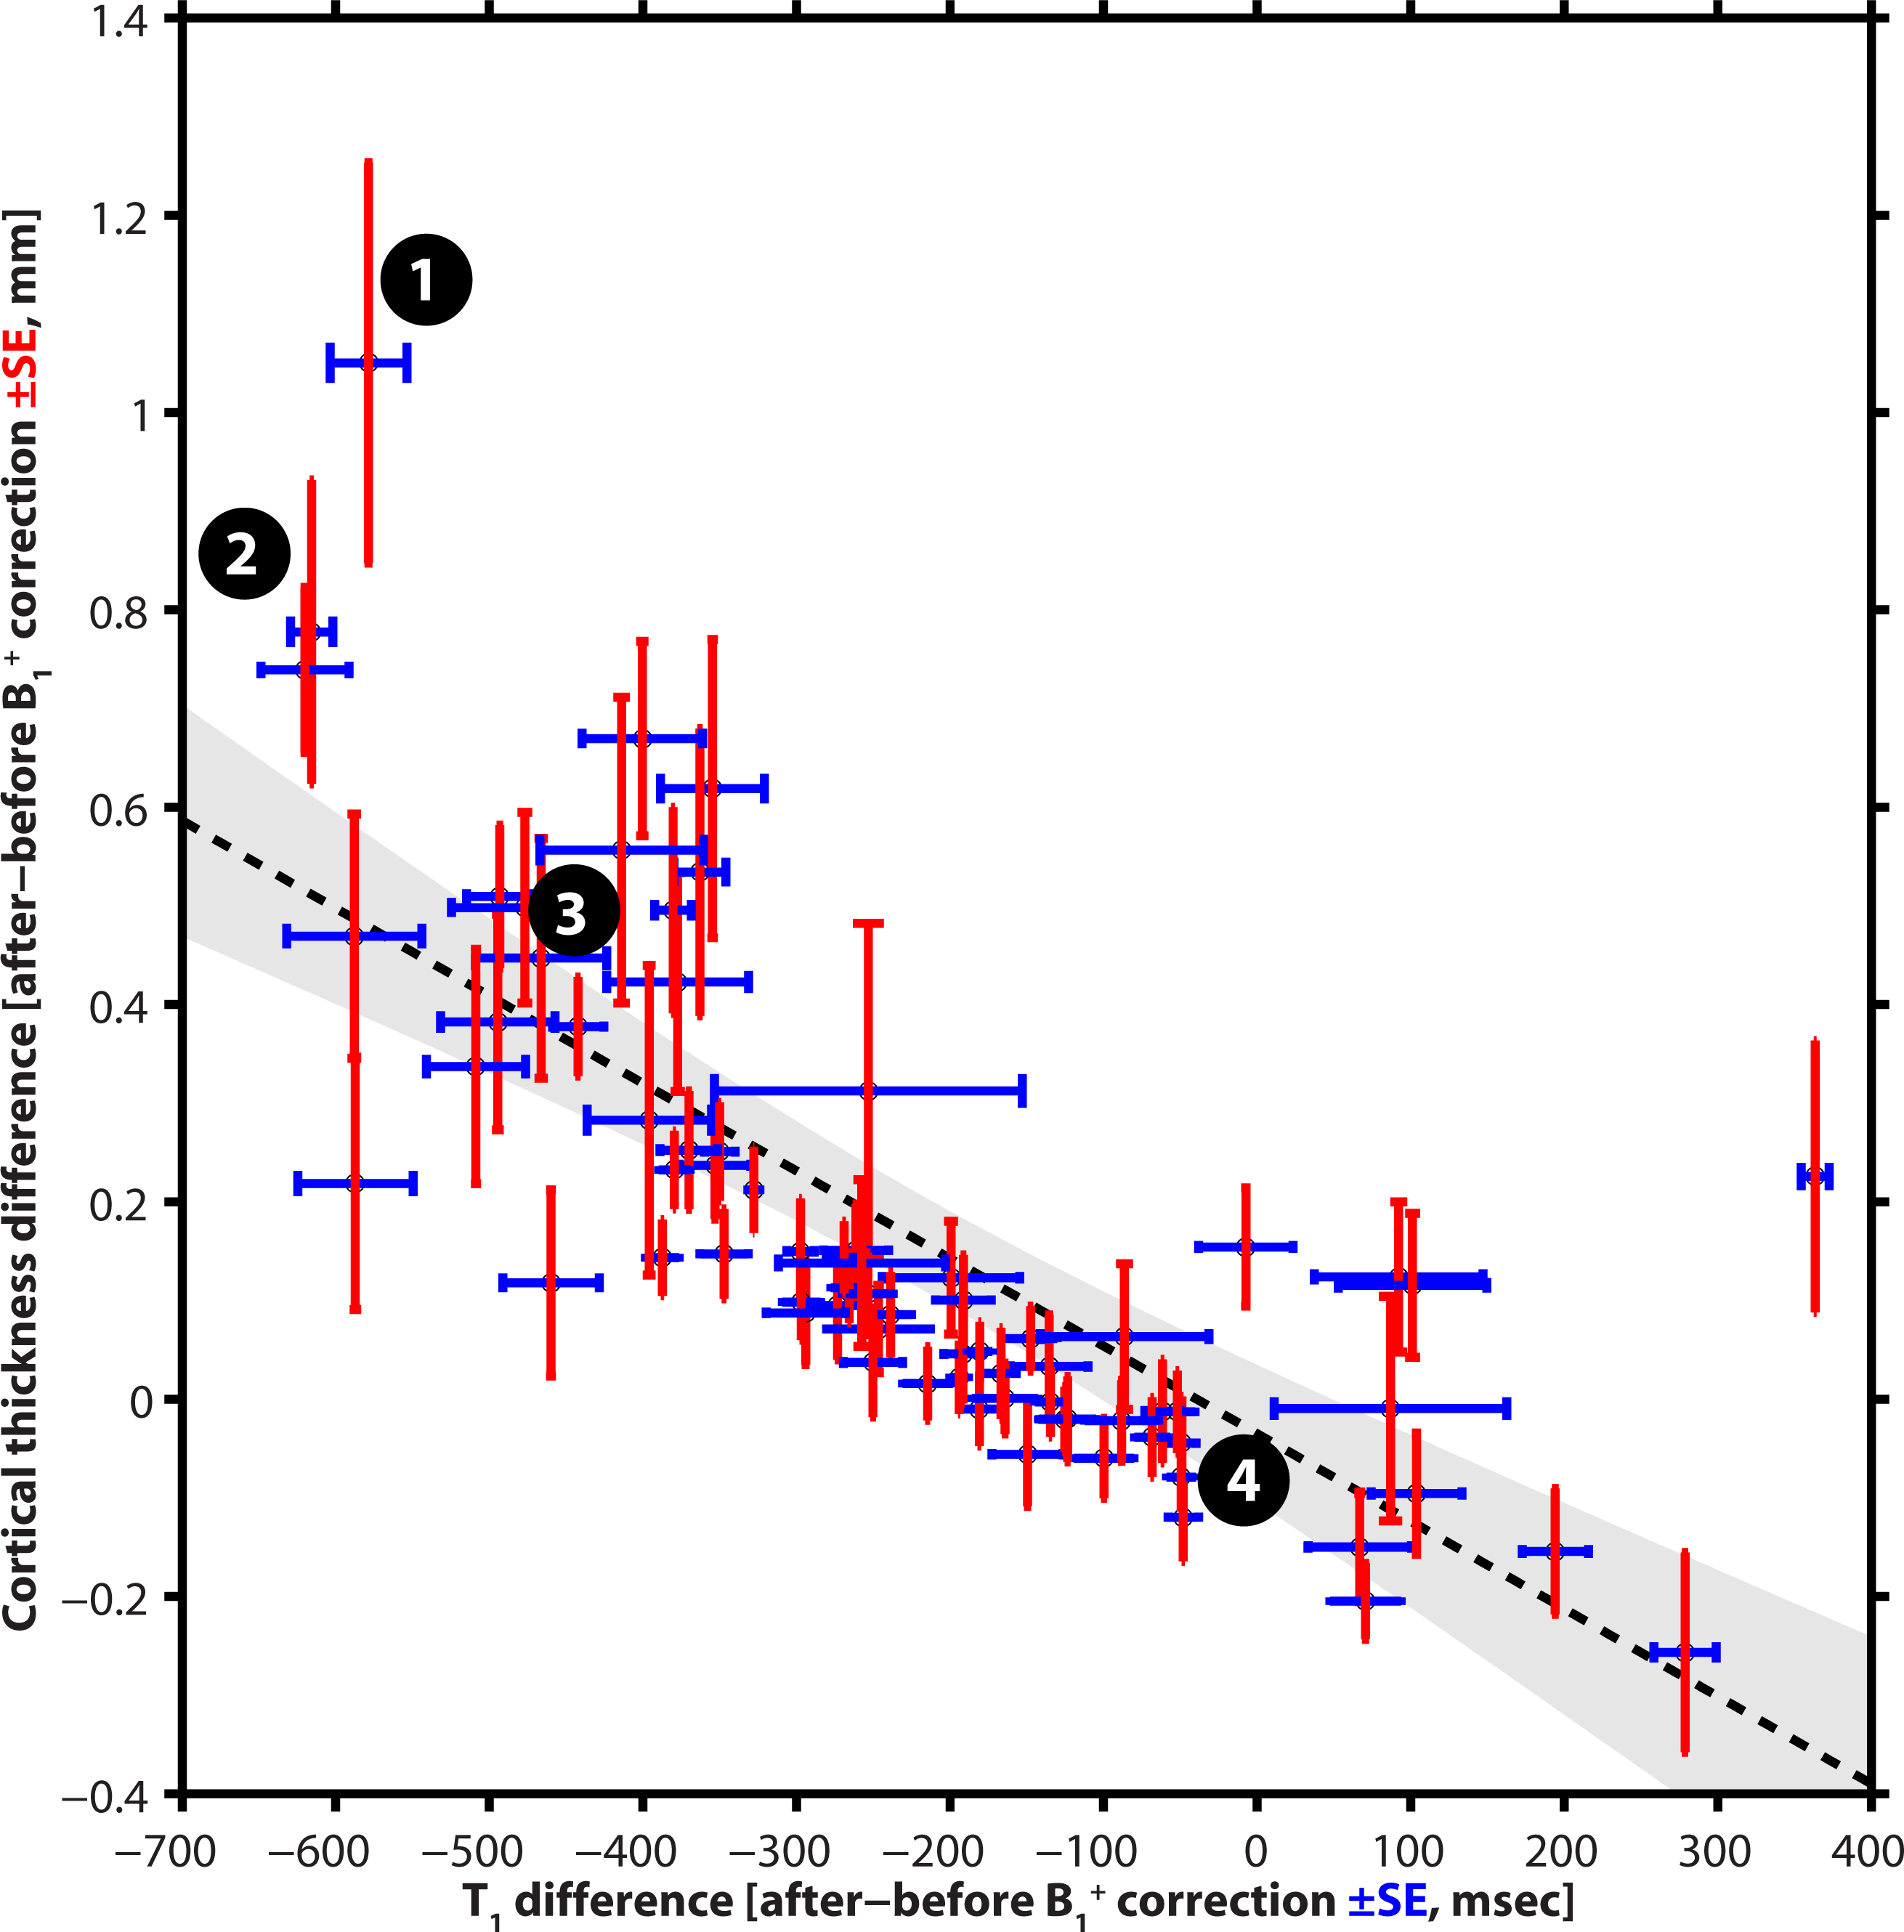
Fig. 1, top row, shows the white matter-gray matter (WM-GM) and the GM-cerebral spinal fluid (CSF) boundaries (red and yellow solid lines, respectively) within the temporal lobe of a representative subject. Especially in the inferior part, clear differences are visible with regards to the GM-CSF boundary, as also observed after reconstruction of the pial surface (bottom row, see white boxes). A more narrow-shaped cortical T1 distribution (averaged across subjects) is observed after B1+ correction, that particularly adjusts the T1 estimation in the lower temporal and frontal lobes (i.e. by a factor of ±1.3, see Fig. 2A), which are also characterized by the largest difference in estimated cortical thickness (see Fig. 3A). In addition, the differences in T1 and cortical thickness observed between both datasets (with and without B1+ correction) are significantly correlated (r = -0.7562, p < 0.0001).
Discussion
Large residual transmit inhomogeneities in MP2RAGE data lead to clear displacements of the GM-CSF border during the automatic cortical segmentation in the affected regions. The apparent cortical thickness in the lower temporal and frontal lobes is highly under-estimated, leading e.g. to potentially erroneous layer-dependent analyses and cortical mapping in these regions, since both heavily rely on this5. B1+ correction of the MP2RAGE volumes, prior to FreeSurfer analyses, reduces these inhomogeneities leading to (1) a lower inter-subject variability (i.e. based on the histograms), (2) enhanced localization of the GM-CSF border and (3) more accurate cortical thickness measurements. However, the latter statement needs to be validated using samples for which the ground truth is known.Acknowledgements
The authors are indebted to Prof. Dr. Andrew Webb (Leiden University Medical Centre, Leiden, Netherlands) and Dr. José Marques (Donders Institute for Brain, Cognition and Behaviour, Nijmegen, Netherlands) for providing the dielectric pads and the MATLAB code to perform the post-hoc T1 correction used in this study, respectively.References
[1] Marques and Gruetter, PLoS One. 2013 Jul 16;8(7). [2] Eggenschwiler et al. Magn Reson Med. 2012 Jun;67(6). [3] Teeuwisse et al. Magn Reson Med. 2012 Apr;67(4). [4] Glasser et al., Neuroimage. 2013 Oct 15;80. [5] Lutti et al. Neuroimage. 2014 Jun;93.
Figures