0012
Patient specific modeling of deep brain stimulation patients for MRI safety studies1Radiology, Massachusetts General Hospital, Charlestown, MA, United States, 2Harvard Medical School, Boston, MA, United States, 3Division of Biomedical Physics, OSEL, CDRH, US Food and Drug Administration, Silver Spring, MD, United States, 4Mechanical Engineering, University of Maryland, College Park, MD, United States, 5Neurology, Massachusetts General Hospital, MA, United States, 6Psychiatry, Massachusetts General Hospital, MA, United States
Synopsis
We propose a semi-automatic processing pipeline for the generation of realistic radiofrequency models of deep brain stimulation (DBS) patients. The whole process takes ~72 hours for model generation and field computation and models the exact DBS path, without intersections, the internal structure of the implant and the patient’s anatomical structures (e.g., brain, bones, muscles, lungs). We show that simplification of the DBS implant model results in high (up to 75%) differences in the estimation of energy absorption. The proposed framework allows for fast and precise modeling, which may be needed, pending experimental validation, to evaluate MRI RF-induced heating.
Target audience
MR physicists & RF engineers.Purpose
Current MRI RF safety studies of deep brain stimulation (DBS) patients rely on simplistic implant geometries with simplified internal structures [1-5] and lead paths (e.g., no loops [1-3] and no extension cables, resulting in incorrect electric length [1-5]). Additionally, no modeling of the implant pulse generator (IPG) [1,4,5] is included. We propose a semi-automatic pipeline for generating anatomically precise models of both the DBS implant and the patient’ anatomy from a CT and a MRI T1 head image and assess the impact of model simplification on SAR prediction.Methods
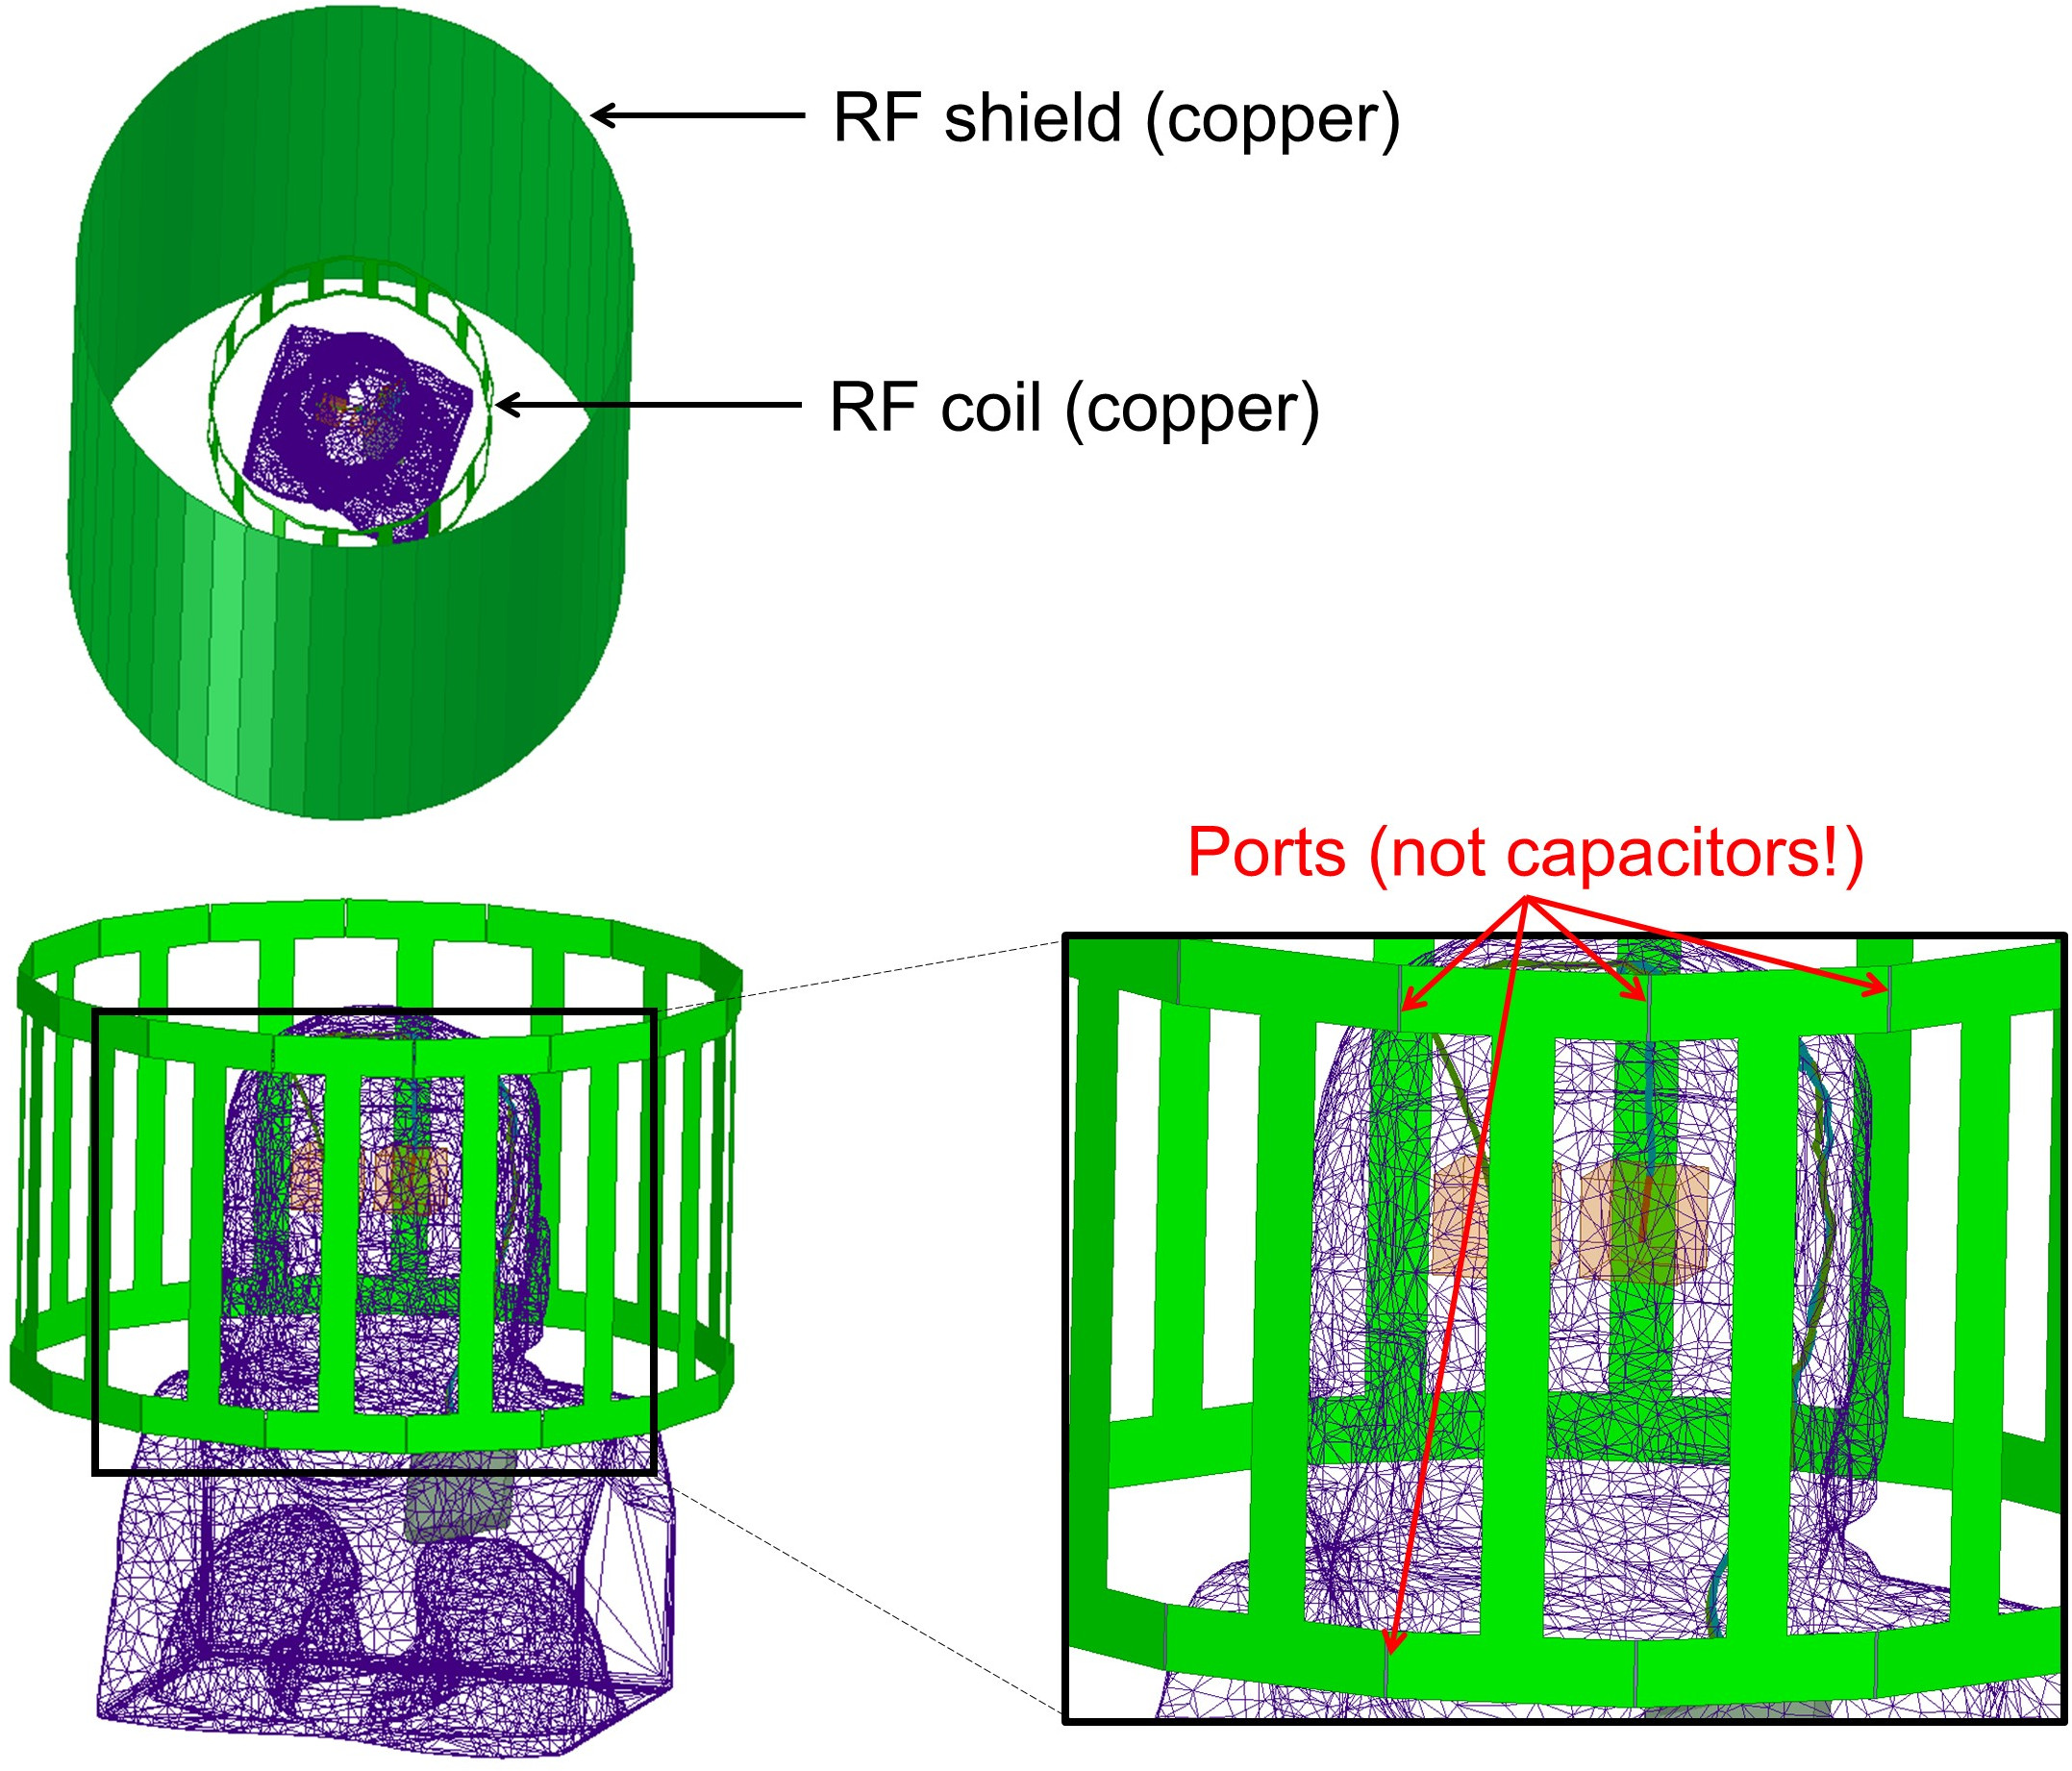
DBS implant: From a post-surgical CT volume of a DBS patient, we extracted a wireframe path of the implant leads by 1) thresholding of the CT data and 2) skeletonization of the resulting binary mask. This wireframe representation of the left and right DBS lead paths may self-intersect however, because of the limited resolution of the CT image. We automatically corrected these topological defects by solving an optimization problem that finds the closest path to the initial wireframe path but does not self-intersect (non-convex quadratic optimization with thousands of quadratic constraints accelerated using a GPU). We then added the internal details of the DBS implant and the IPG onto this wireframe model. Patient anatomy: From the CT data, we segmented bones, air and soft tissues using the EM segmenter with training (no atlas) of 3D Slicer [7]. Additionally, we segmented the white matter, grey matter and CSF from a T1 MRI image of the same patient using 3D Slicer’ brain segmenter with atlas [7]. We generated surface meshes of the tissue classes using the marching cube algorithm, which we then simplified using MeshMixer. Coil: We modeled a 3 T head birdcage transmit coil using a co-simulation process based on HFSS and ADS [8,9].Results
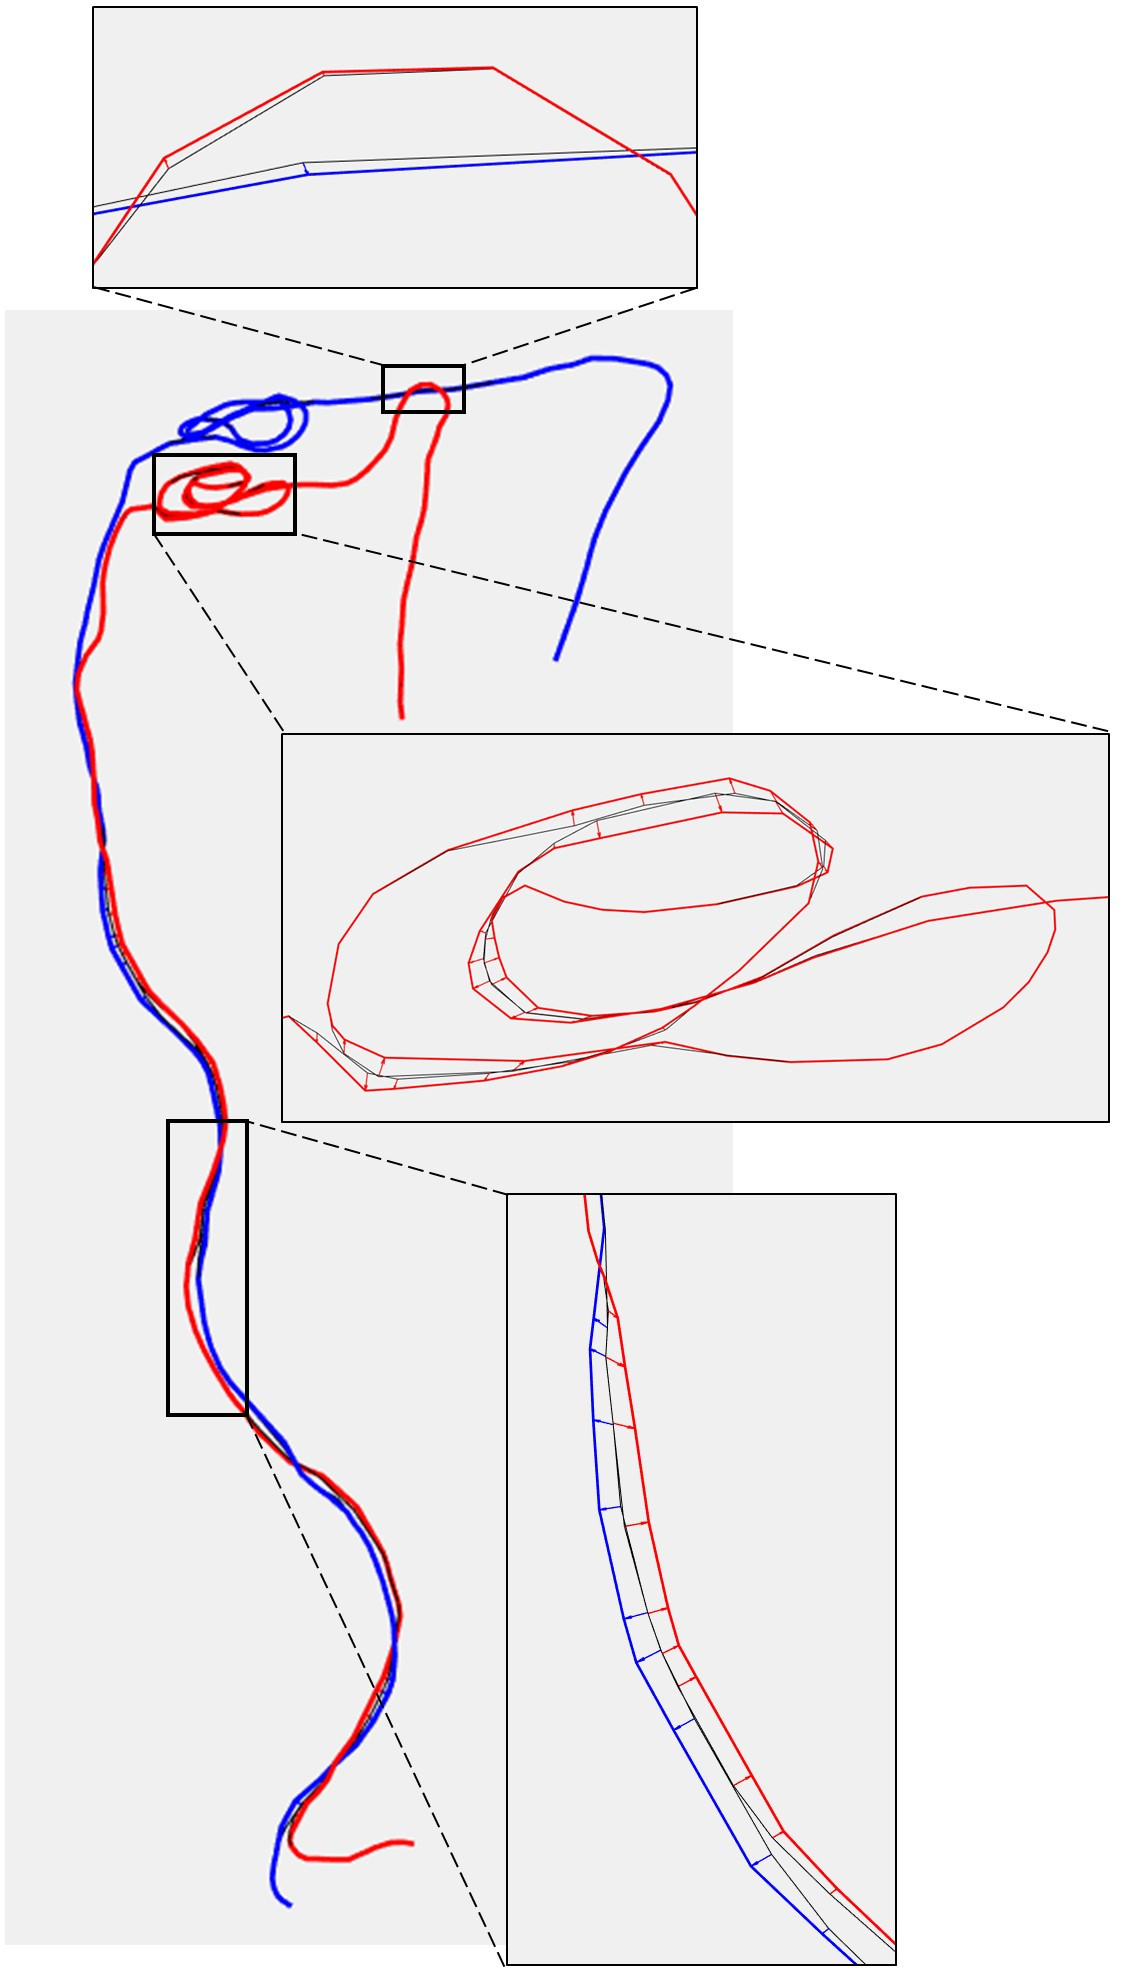
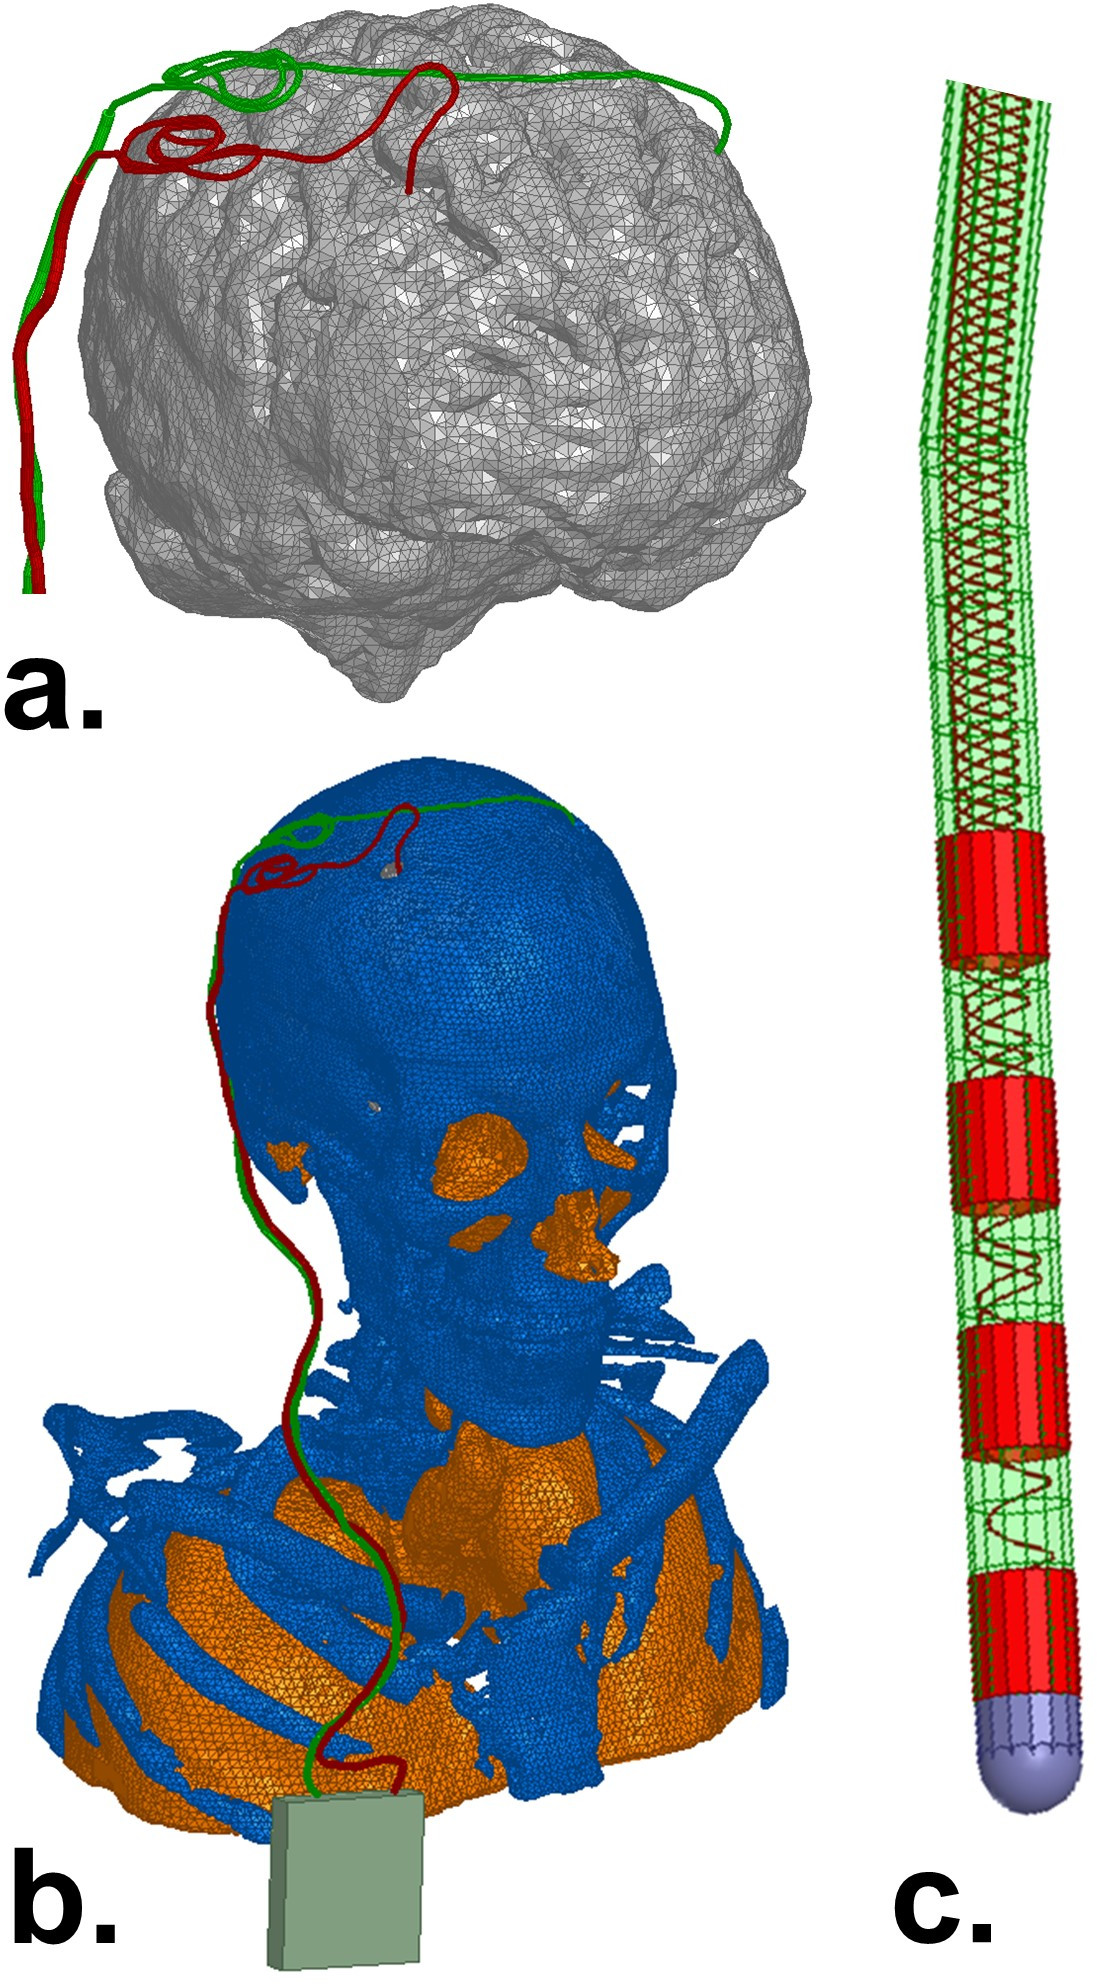
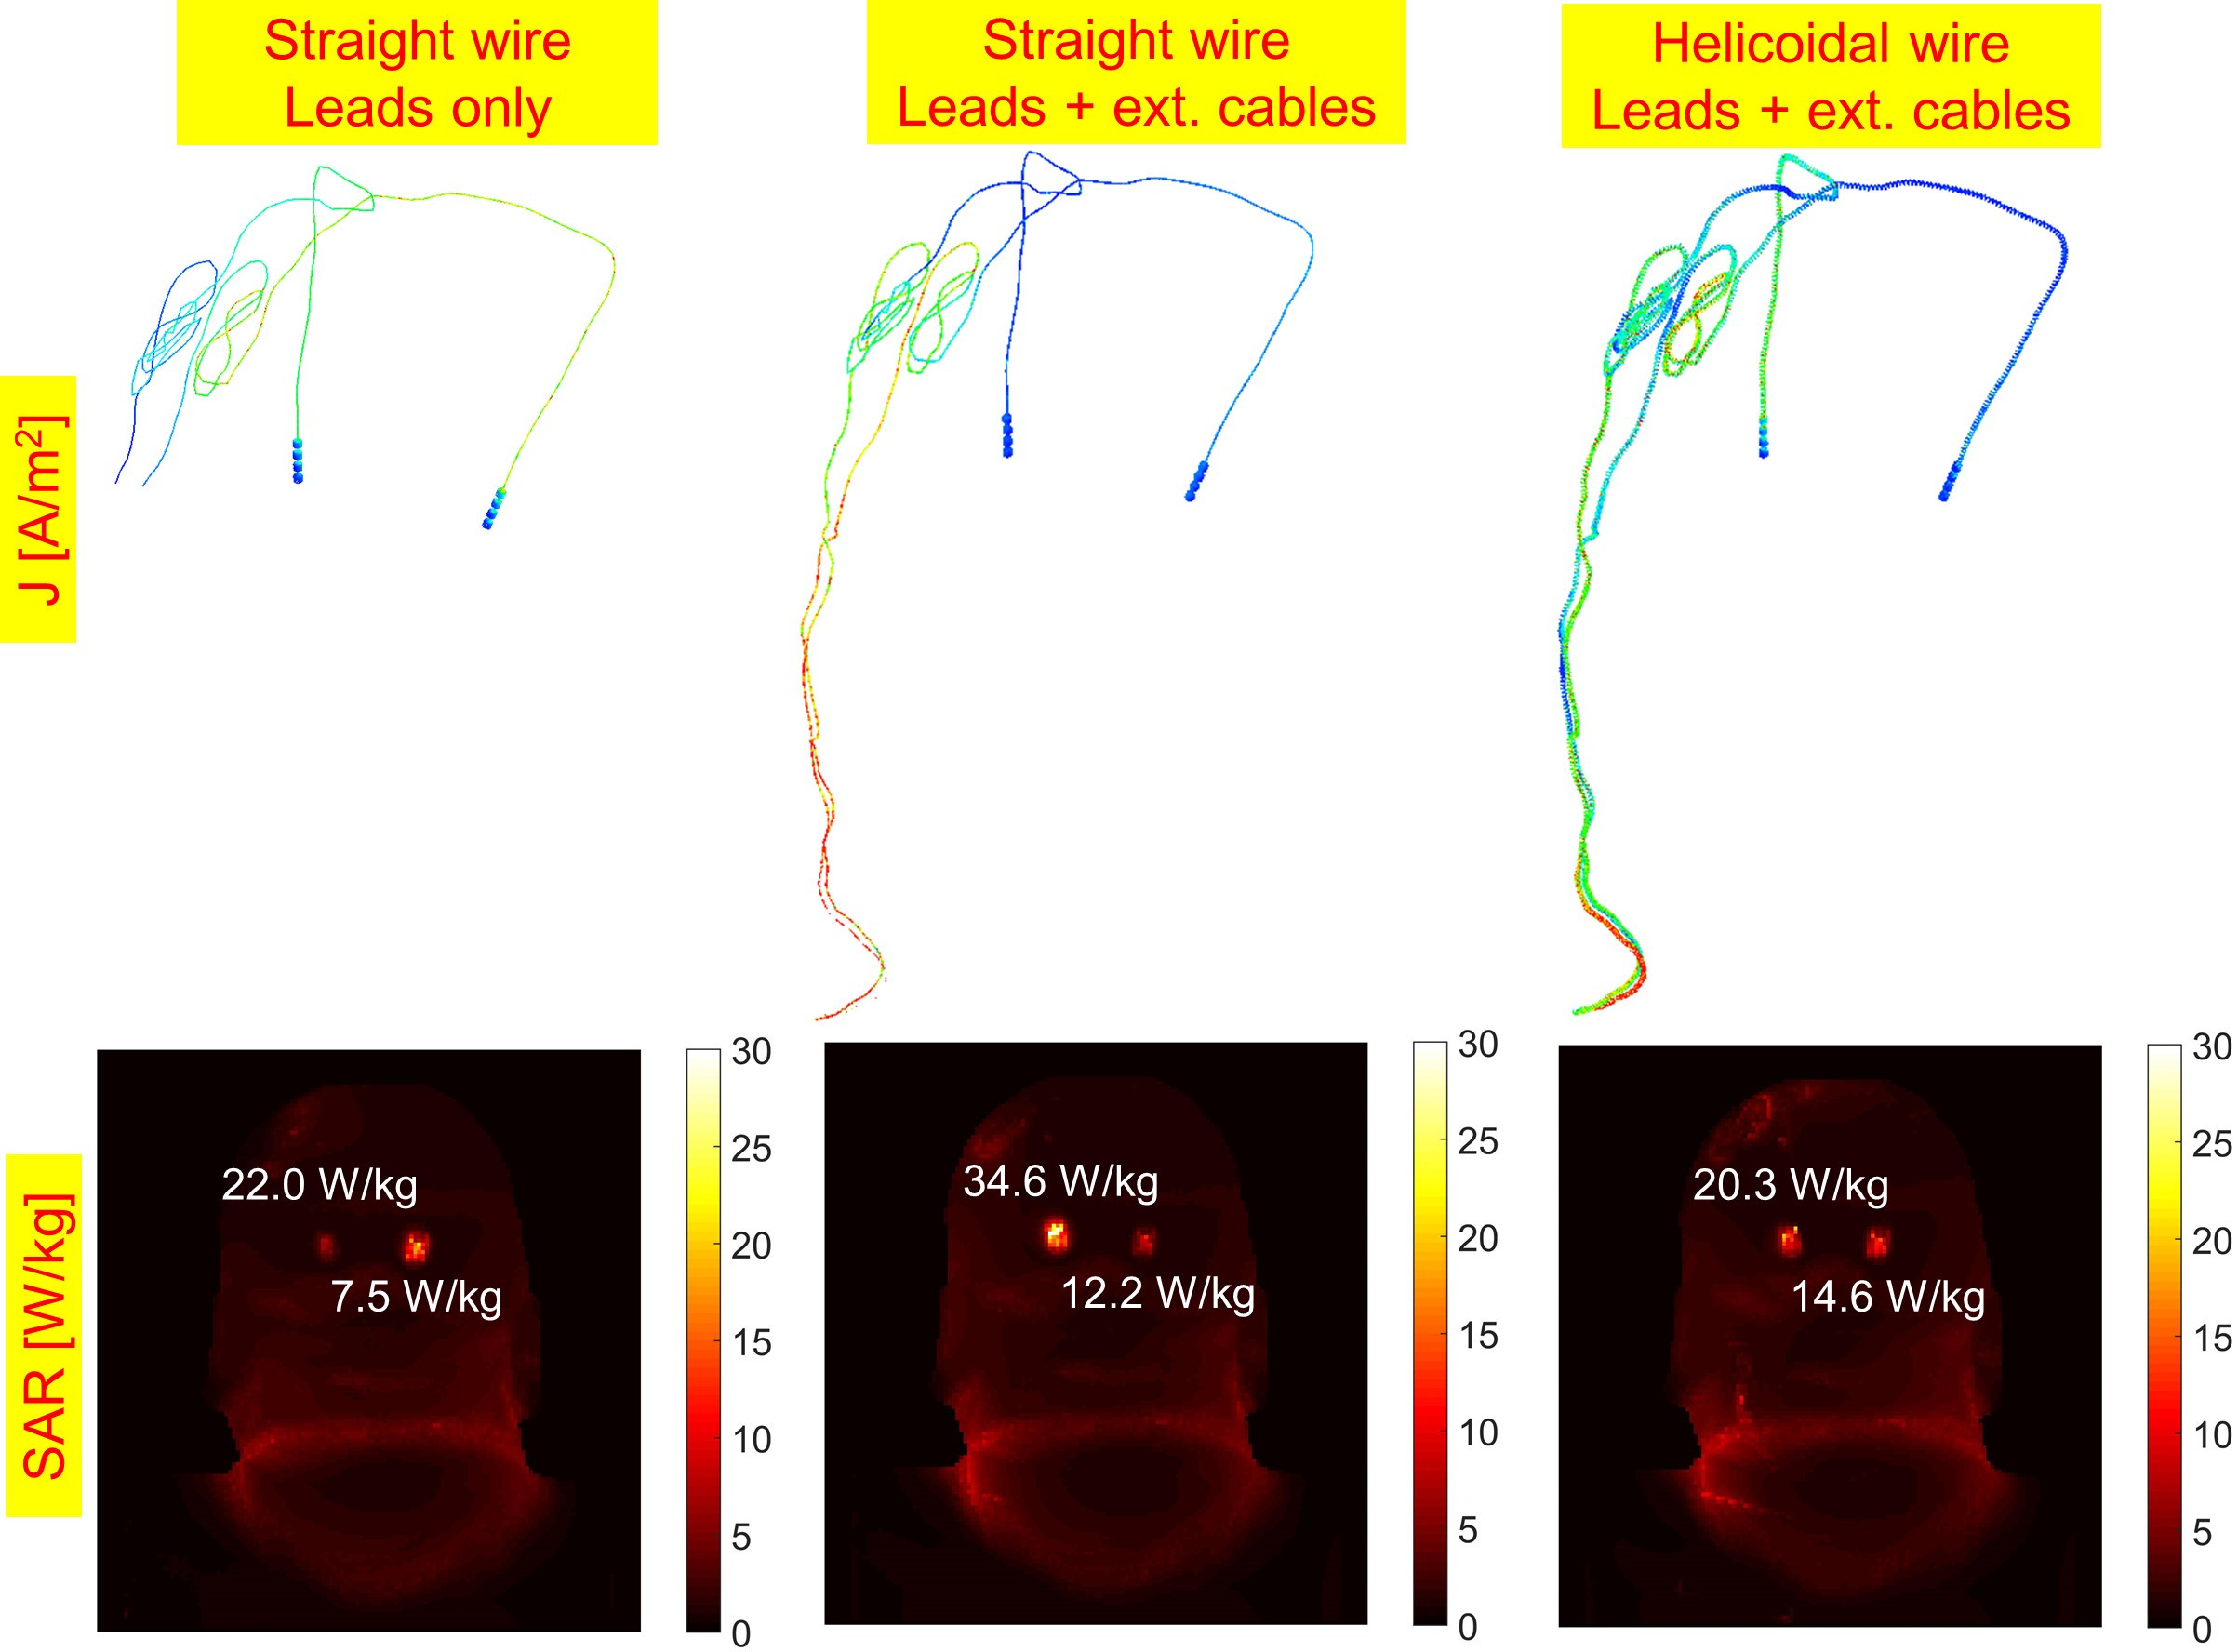
Fig. 1 shows the CT-derived wireframe model of the DBS path (black lines) as well as the topology-corrected paths in blue (left lead) and red (right lead). The blue and red arrows show path displacements enforced by the topology correction algorithm to remove intersections. Both intersections within a single lead and between the two bilateral leads are removed by the optimizer, as visible in the zoom inserts. The top zoom insert shows the creation of a “bridge” where the right lead goes “over” the left lead to avoid intersecting. The second zoom shows a complex entangling of the right lead, modeling the “loops” typically used by the neurosurgeon to leave slack in the cables, corrected automatically by the algorithm. Such corrections would be difficult to perform manually. Finally, the bottom zoom insert shows a “splitting” of the extension cable wireframe path into two distinct left and right paths, merged because of the limited resolution of the CT volume. After topology correction, the lengths of the left and right leads were 79.5 cm and 79.4 cm, respectively, which is close to the known value (80 cm). Fig. 2 shows the mesh model of the DBS implant and the patient’s anatomy. Fig. 2c shows details of the implant internal structure including the tip electrodes and the helicoidal connection wires between the electrodes and the IPG. Fig. 4 shows the surface current induced on the DBS leads and the SAR in the patient for three simulations with increasing level of accuracy for the DBS implant model. These results show that the length of the implant model (lead-only vs. lead with extension cables) and the detailed internal structure of the conductor wires (straight vs. helicoidal conductor wires) have a large impact on SAR prediction at the lead tips. The impact of these model simplifications are spatially-dependent as they do not affect the left and right leads equally.Conclusion
We have proposed a processing pipeline that allows simulation of patients implanted with complex, bilateral DBS implants within reasonable time (48 hours for generation of the implant/patient model + 24 hours for simulation/field generation). The numerical results show high differences (up to 75%) between complex and simplified models, suggesting the need to further analysis on the need of more complex models, including experimental validation. Improved models and RF-assessment may allow for increased access of DBS patients to anatomical, functional and diffusion MRI with improved image quality, which could help elucidate the mechanisms of action of DBS in vivo. NOTE: The mention of commercial products, their sources, or their use in connection with material reported herein is not to be construed as either an actual or suggested endorsement of such products by the Department of Health and Human Services.Acknowledgements
NIH grant K99EB019482References
[1] Angelone LM et al (2010). "Analysis of specific absorption rate (SAR) at 3T MRI with variable Deep Brain Stimulation (DBS) lead resistivity". IEEE Trans Medical Imaging; 29(4):1029-1038.
[2] Iacono M et al. (2013). "MRI-based multiscale model for electromagnetic analysis in the human head with implanted DBS." Computational and Mathematical Methods in Medicine; DOI: 10.1155/2013/694171
[3] Cabot E et al. (2013). “Evaluation of the RF heating of a generic deep brain stimulator exposed in 1.5 T magnetic resonance scanners.” Bioelectromagnetics 34(2): 104-113
[4] Eryaman Y et al. (2014). “Parallel transmit pulse design for patients with deep brain stimulation implants”. Magnetic Resonance in Medicine 73(5): 1896-1903
[5] Golestanirad L (2016). “Local SAR near deep brain stimulation (DBS) electrodes at 64 and 127 MHz: A simulation study of the effect of extracranial loops”. Magnetic Resonance in Medicine; DOI: 10.1002/mrm.26535
[6] Golestanirad L (2016). “Feasibility of using linearly polarized rotating birdcage transmitters and close-fitting receive arrays in MRI to reduce SAR in the vicinity of deep brain simulation implants”. Magnetic Resonance in Medicine; DOI: 10.1002/mrm.26220
[7] Fedorov A et al (2012). “3D Slicer as an Image Computing Platform for the Quantitative Imaging Network”. Magnetic Resonance Imaging; 30(9):1323-41
[8] Kozlov M and Turner R (2009). "Fast MRI coil analysis based on 3-D electromagnetic and RF circuit co-simulation." Journal of Magnetic Resonance 200(1): 147-152.
[9] Guérin B et al. (2015). "Comparison of simulated parallel transmit body arrays at 3 T using excitation uniformity, global SAR, local SAR and power efficiency metrics." Magnetic resonance imaging 73(3): 1137-1150
Figures