0010
2D Multi-Spectral Thermometry for Monitoring Focused-Ultrasound Sonications Near Metallic Hardware1Radiology, Stanford University, Stanford, CA, United States, 2Comparative Medicine, Stanford University, Stanford, CA, United States
Synopsis
The lack of a technique for MR thermometry near metallic hardware excludes a growing patient population from MR-guided focused ultrasound treatments. In this work, we explore the temperature-induced signal change in fast two-dimensional multi-spectral imaging for monitoring sonications near metallic hardware. We demonstrate initial feasibility in phantom and ex vivo experiments as well as a patient treatment.
Purpose
To enable MR-guided focused ultrasound (MRgFUS) treatments of patients with metallic hardware.Introduction
MR thermometry ensures safety and efficacy during MRgFUS treatments such as thermal ablation of bone tumors. However, lack of a technique to monitor sonications in the presence of large metallic hardware such as hip replacements excludes a growing patient population from these promising treatments. Here, we propose two-dimensional multi-spectral imaging (2DMSI) for fast thermometry near metallic hardware (“2DMSI thermometry”). We demonstrate general feasibility by monitoring short sonications close to metallic hardware in both a phantom and a porcine cadaver. We further present the first in vivo application of 2DMSI thermometry in a patient without metallic hardware as a proof of concept.Methods
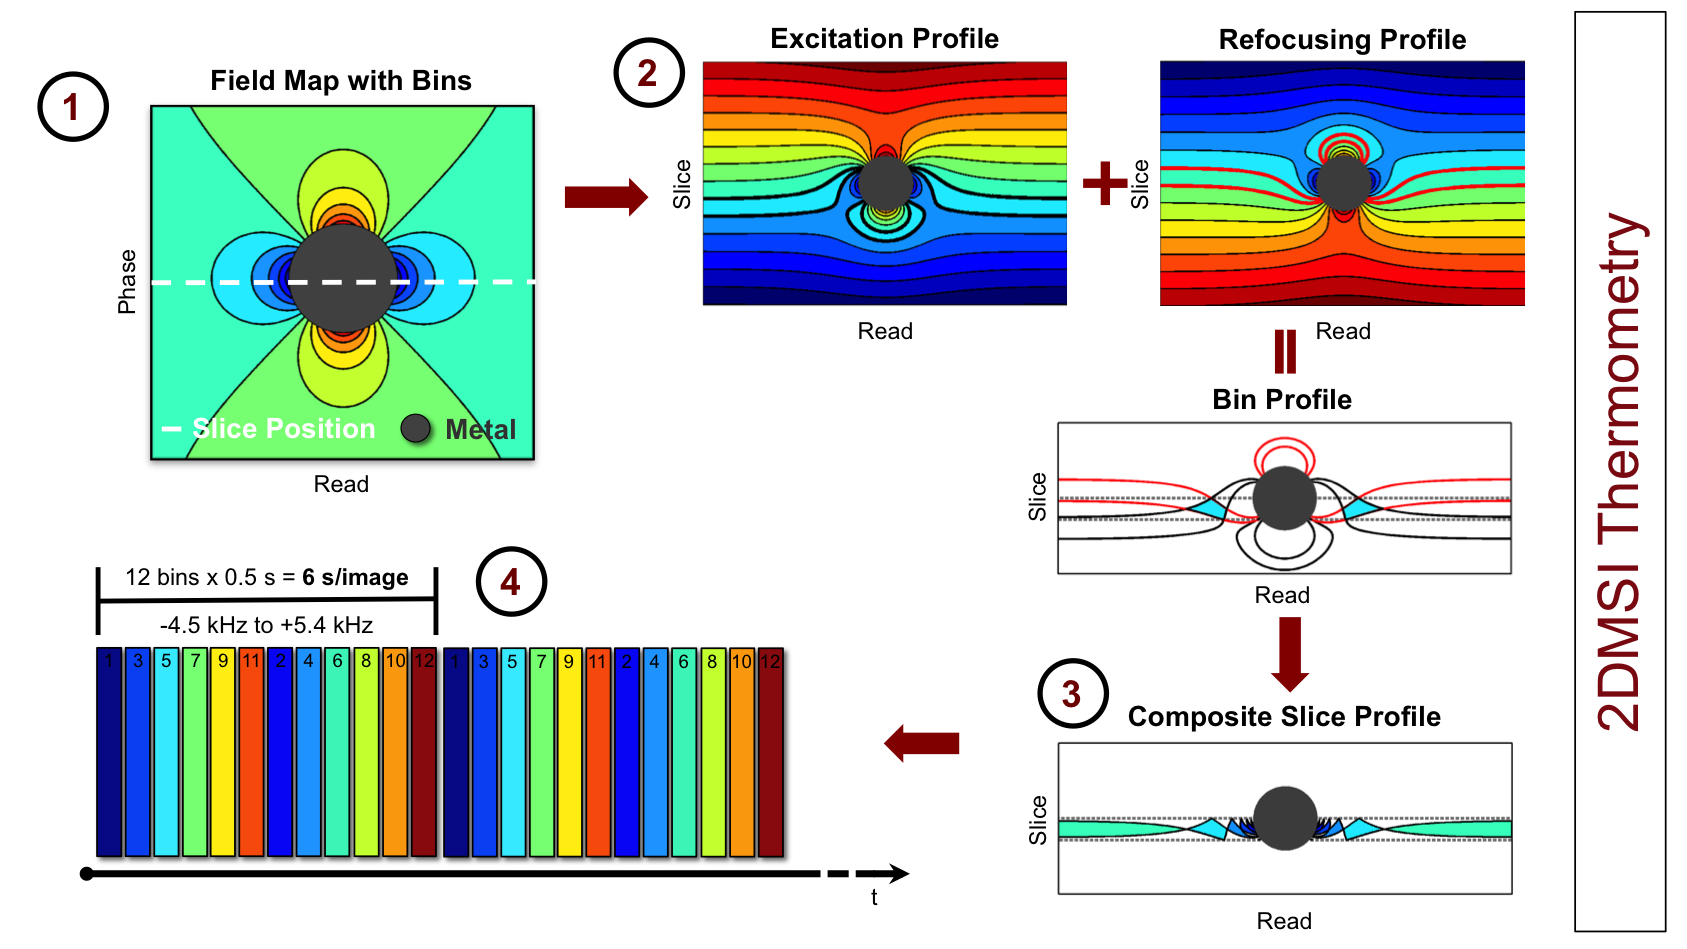
2DMSI enables fast artifact-reduced imaging near metallic hardware, by segmenting the slice into spectral regions (“bins”) that can be imaged with minimal artifact [1] (Fig. 1). Although a single-shot 2DMSI image is intrinsically T2-weighted, rapid, repeated acquisition of a series of 2DMSI images enables T1-weighting for increased temperature sensitivity. Temperature-induced signal change throughout the 2DMSI series is determined on a voxel-by-voxel basis with respect to the steady-state baseline image.
All experiments were performed on a 3T whole-body MRI system, equipped with an ExAblate 2000 focused ultrasound system (InSightec, Haifa, Israel) and using the body coil for signal transmission and a surface coil for reception. 2DMSI series were acquired with a temporal resolution of 6 s/image. Each 2DMSI image was composed of 12 frequency bins covering off-resonance values from -4.5 kHz to +5.4 kHz, with TE=30 ms, 280 x 280 mm FOV, 5 mm slice thickness and 256 x 128 matrix size (half Fourier).
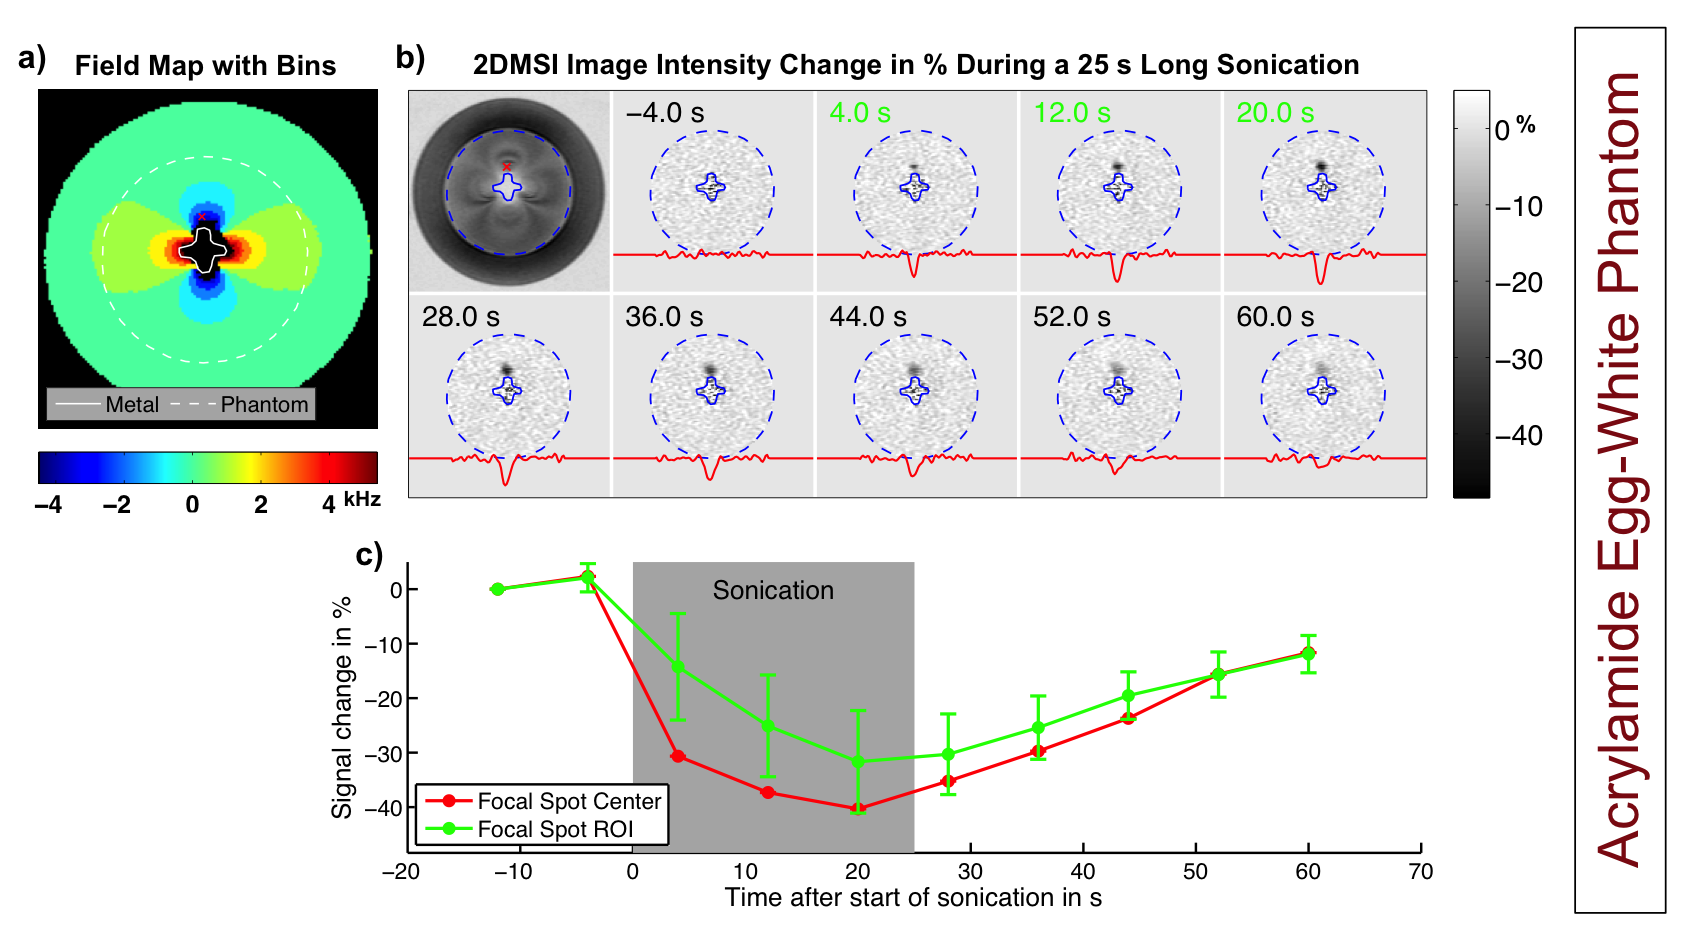
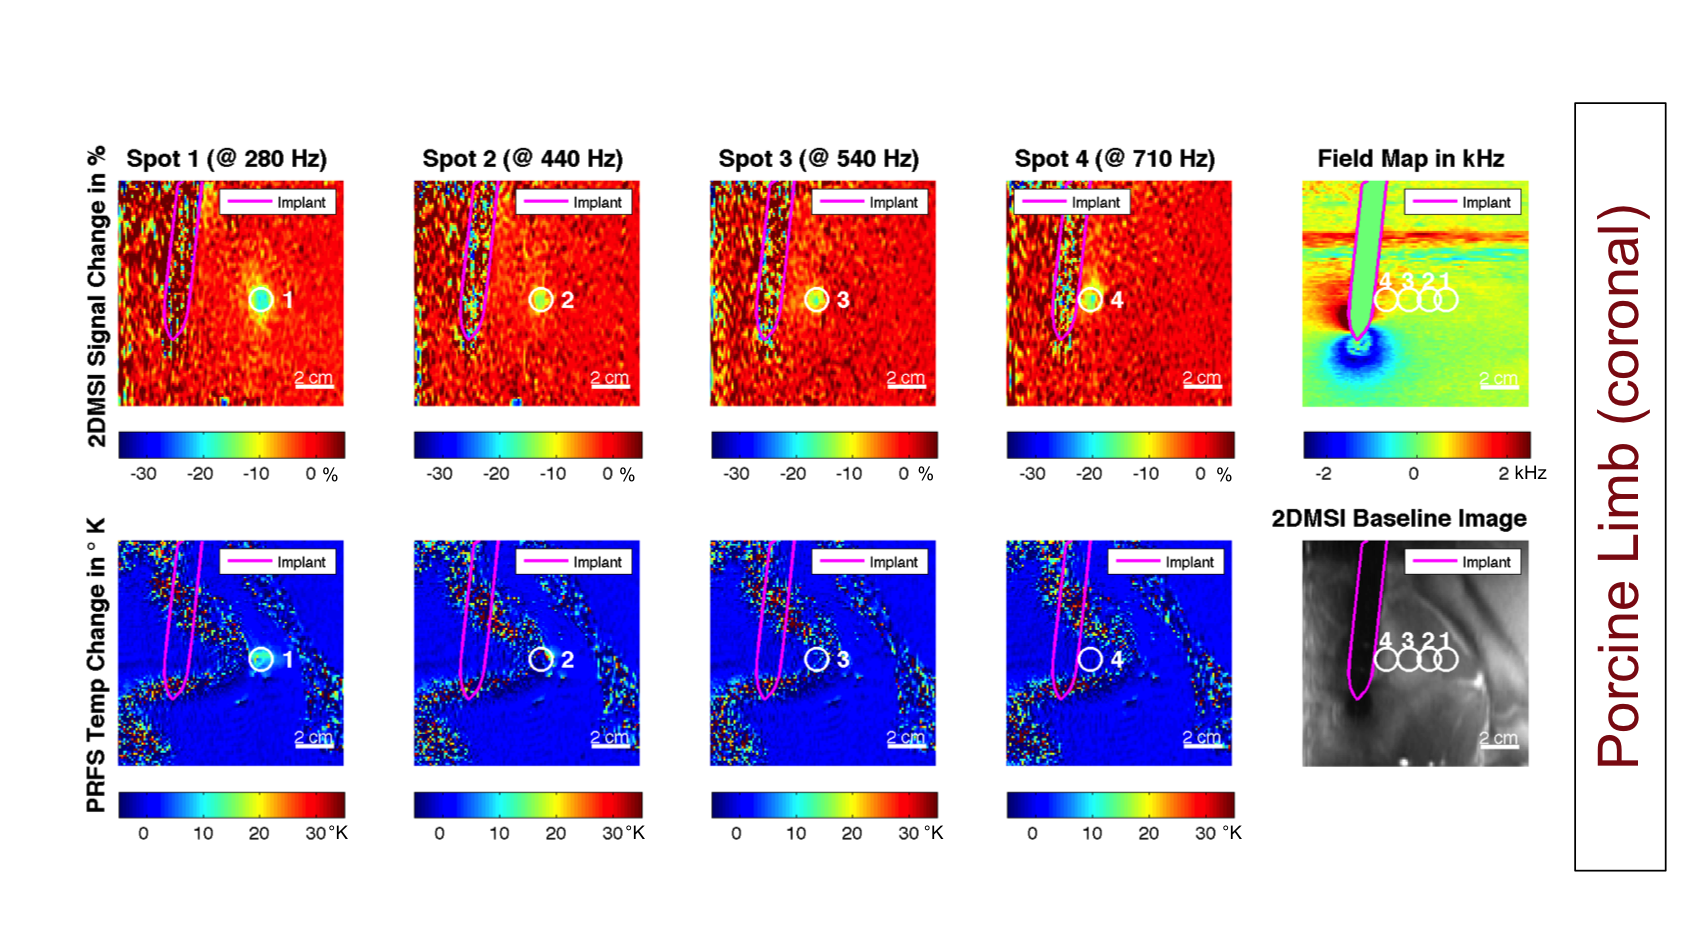
As a benchmark experiment, we monitored a 25 s long sonication in an acrylamide phantom with the focal spot located next to the CoCr stem of a knee implant. Next, we performed 2DMSI thermometry in an isolated porcine limb with the CoCr stem of a hip implant placed in the muscle to monitor sonications located at varying distance to the stem. We repeated the experiment with conventional proton resonance frequency shift (PRFS) thermometry to demonstrate its limitations near metal. To test in-vivo temperature sensitivity, we applied 2DMSI thermometry during MRgFUS treatment of a 65-year-old patient with metastases in the right pelvis without metallic hardware. As a reference, the 25 s long sonications were repeated with PRFS thermometry.
Results & Discussion
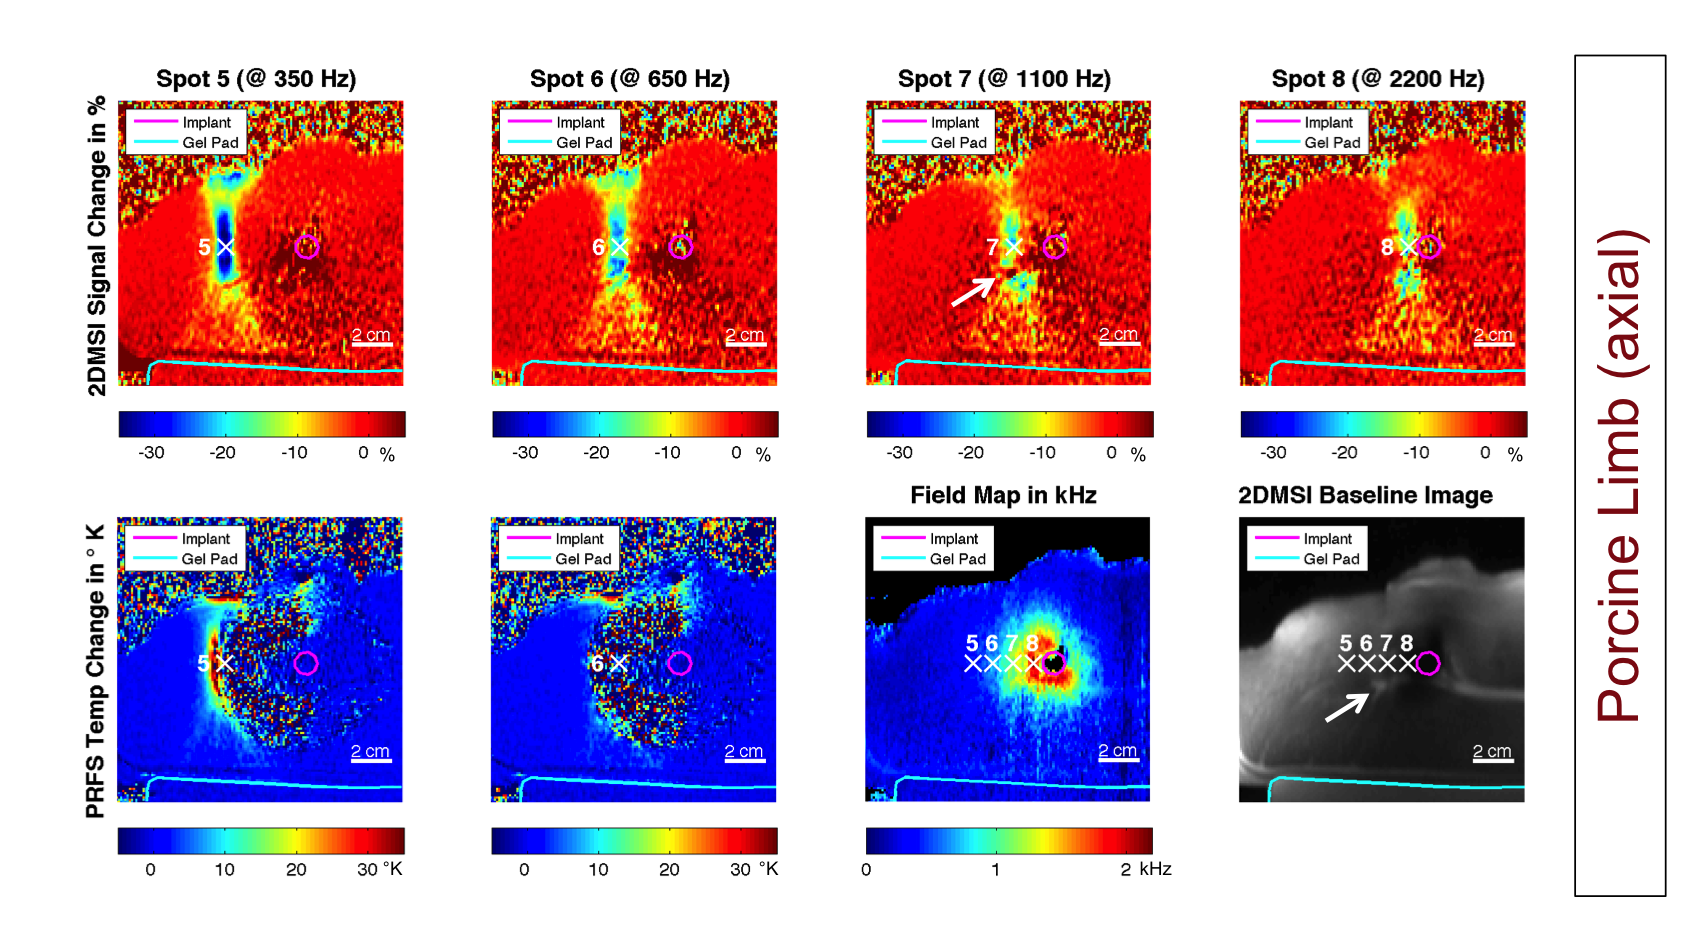
Figure 2 shows the temperature-induced 2DMSI signal change in the acrylamide phantom. The difference images demonstrate the temperature build-up of the focal spot next to the metal during and its decay after sonication. As the bin map reveals, the focal spot is located in an area exhibiting off-resonances as high as 2700 Hz. Figures 3 & 4 show the results for the sonications in the ex vivo porcine limb. Whereas PRFS thermometry fails for off-resonances of 440 Hz and above, the 2DMSI signal change maps visualize the focal spot even next to the implant for off-resonances as high as 2200 Hz. Both experiments demonstrate the general ability of 2DMSI thermometry to measure fast temperature changes reliably despite close proximity to metallic hardware, where conventional PRFS thermometry fails.
Although designed for thermometry in aqueous tissues, 2DMSI thermometry has the potential to detect temperature changes also in fatty tissues where the signal change is primarily driven by the T2 temperature sensitivity [2]. As comparison with the 2DMSI baseline image reveals, spot 7 (Fig. 4, arrow) crosses a fat layer. Within the cross section, signal is increased instead of decreased.
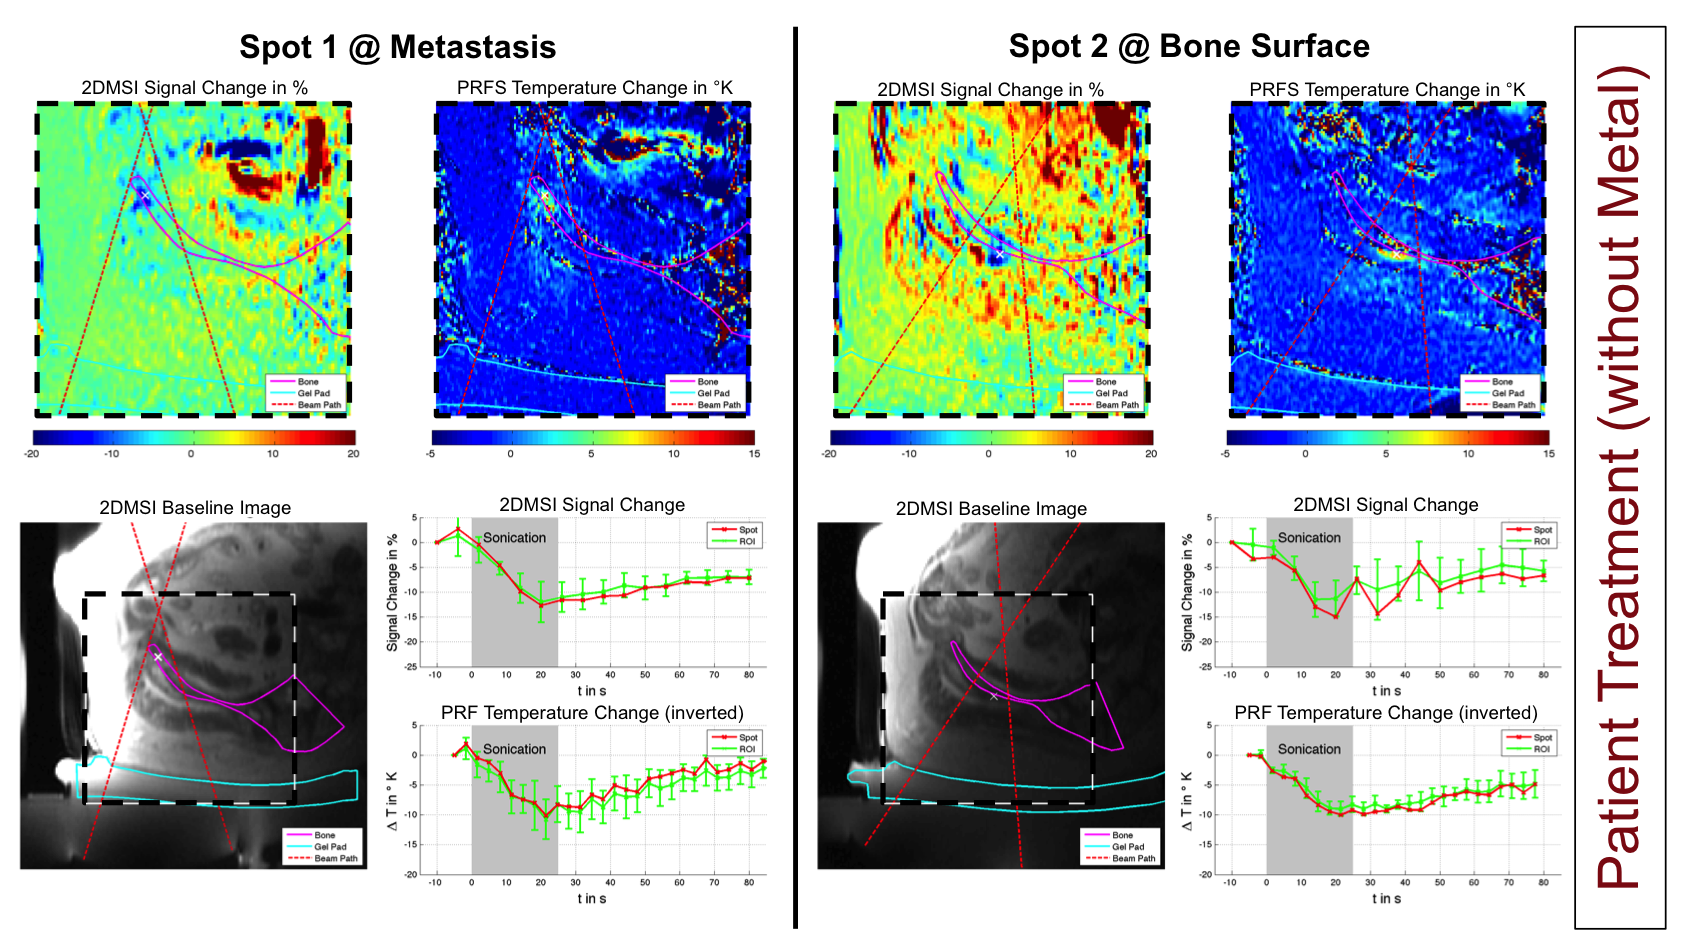
Figure 5 shows the results from the treatment of the patient without metallic hardware. The 2DMSI signal changes indicating heating inside the metastasis (spot 1) and above and below the bone (spot 2) visually match with the PRFS results. Using the PRFS temperature as a reference yields a 2DMSI signal sensitivity in the order of 1 %/°C. Based on the given SNR of 20-40 and a minimum contrast-to-noise ratio of 3, the 2DMSI signal sensitivity can detect temperature changes of 7-15 °C and above. Although this is already sufficient to monitor sonications during bone or soft tissue tumor treatments, where the target peak temperature during a sonication is approximately 65 °C, 2DMSI thermometry is expected to greatly benefit from receiving coils tailored to the ultrasound transducer. Decreasing off-resonance coverage by reducing the number of bins would allow for both increasing temporal resolution and temperature sensitivity due to higher T1 weighting.
Conclusion
Overall, the proposed 2DMIS thermometry has the potential to allow MRgFUS treatments for patients with metallic hardware and thus for a larger patient population.Acknowledgements
This work was supported by NIH (R01 EB017739, R21 EB019723, P01 CA159992) and GE Healthcare.References
[1] Hargreaves BA, Taviani V, Yoon D. Fast 2D Imaging for Distortion Correction Near Metal Implants. Proc ISMRM 22. 2014, #615.
[2] Rieke V, Butts Pauly K. MR Thermometry. J Magn Reson Imaging. 2008; 27:376-390.
Figures