0002
Optical-based probe for real time assessment of RF electrical field during MRI exam1Univ. Lyon, CREATIS ; CNRS UMR 5220 ; INSERM U1206 ; INSA-Lyon ; UJM-Saint-Etienne ; Université Lyon1, Villeurbanne, France, 2Univ. Savoie-Mont-Blanc, IMEP-LAHC, Le Bourget-du-Lac, France, 3Kapteos, Sainte-Hélène-du-Lac, France
Synopsis
During MRI exam, Specific Absorption Rate (SAR) is essential to be controlled and can be evaluated by measuring either indirectly for instance the rise in temperature or directly the radiofrequency induced electrical E-field. In the current study, we proposed an optical probe based on the Pockels effect for subcentimeter resolution measurements of the E-field without altering the surrounding media. Measurements were performed at 4.7 T and 3.0 T. Results show that the probe has an excellent linear response and allow a real time estimate of the three components of the E-field produced during MRI examination.
Introduction
Patient safety is controlled during an MRI exam by estimating the global specific absorption rate (SAR). Without dedicated devices such radiofrequency (RF) traps, the electrical E-field induces RF currents, resulting heating near metallic conductor. The SAR-parameter is determined either by the E-field or the temperature rise. E-field probes are fast and more sensitive than thermal sensors but hard to implement. Dipole-based probes were largely used to measure the E-field in MRI1-3. However, their metallic structure may perturb the electromagnetic fields and the spatial resolution is limited by the probe’s dimensions. Recently, optical-based methods were used to measure the E-field4, 5. But, the value of the E-field was not precisely determined, besides only one component of the E-field was estimated. In the following, the characteristics of the optical probe and real time measurements of the three components of the RF E-field are presented.Methods
Birefringence characterizes crystals that change their reflective indices with an applied E-field. Based on this principle, a sub-cm optical probe using isotropic crystals (ZnTe, BSO…) was designed and built. A probe with isotropic crystal allows the measurement of both x- and y-orientations of the E-field so-called transverse probe. The z-component is measured by a longitudinal probe. A fiber optic was connected to the crystal to drive a laser diode (λ = 1.55 μm, relative intensity noise (RIN) < 150 dB/Hz) having an incident polarization that changes with the applied E-field. The modulation of the polarization was analyzed using a processing unit (eosens, Kapteos, France) and then converted into an electrical signal using a photodiode. A spectrum analyzer was used to display the envelope of the detected electro-optical (EO) signal on a fixed and narrow frequency bandwidth (30 kHz). First, the E-field measurements were performed on 4.7 T preclinical MRI (Bruker). A high-pass 60 mm-diameter linear transceiver birdcage with capacitors placed on the two end sides was used. The probe was fixed on a 3-axis translation bench (Fig 1). The measurements were performed in air in order to verify the sensing abilities of the probe. The probes were calibrated outside the MRI to obtain the proportionality factor between the EO signal and the E-field. A FLASH sequence with 1 ms Hermite shape RF excitation pulse was ran. In order to determine the relation between the emitted magnetic B1-field and the detected E-field, the flip angle of the RF pulse was varied and the corresponding E-field was measured. Besides, the two transverse and longitudinal probes were used separately to measure the three components of the E-field along the z-axis. Finally, this measuring protocol was also applied on a 3.0 T clinical MRI (GEHC MR750). MR images of an orange with and without inserted probe were acquired.Results
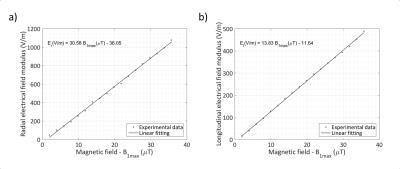
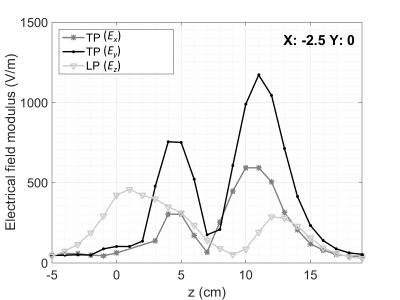
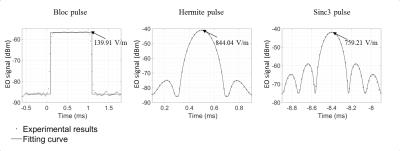
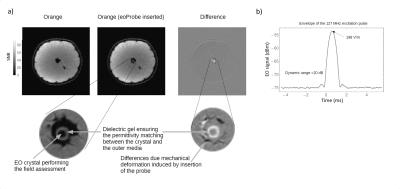
Figure 2 exhibits an excellent linearity between E- and B1-fields for both probes measuring radial and longitudinal components. The B1-field was derived from the shape (Hermite equation) and amplitude (flip angle). The maximum values of the E-field were measured at 1078 V/m and 488 V/m for transverse and longitudinal probes, respectively. The sensitivity was established at Emin=0.27V/m.Hz-1/2 for transverse probe and Emin=0.087V/m.Hz-1/2 for longitudinal probe. Figure 3 displays the three components of the E-field along z-axis. Two maximum peaks were found at Z=5cm and Z=11cm for all curves. Next, the exact shapes of three different excitation pulses having the same excitation time (1ms) and power (138W) were detected by the optical probe (Fig 4). The difference between the MR images of the orange with and without the inserted probe is negligible and the measured E-field was equal to 198 V/m (Fig 5).Discussion
The E-field has a linear dependence with respect to the B1-field. The highest value of the E-field is obtained when the flip angle is equal to 90˚ which corresponds to the highest value of the emitted B1-field. The EO probe is highly sensitive to the variation of the E-field value regarding the RF pulse shape. The y-component of the E-field is the dominant component noting that the RF B1 excitation pulse is linear and emitted along the x-axis. The detected peaks along z-direction are spatially separated by about 60 mm which is the birdcage length. The high-concentrations of the E-field happen near the capacitor areas. Finally, based on MR images comparisons, the probe has not noticeable impact on the B1-field.Conclusion
The described optical probe device is a suitable to measure E-field within MRI tunnel without altering the B1-field. An excellent linearity and a good sensitivity of this optical-based probe were demonstrated. Besides, the probes can be used at different B0.Acknowledgements
This work was supported by the Rhône-Alpes region and performed within the framework of LABEX-PRIMES (ANR-11-LABX-0063), and the program “Investissements d’Avenir” (ANR-11-IDEX-0007) operated by the French National Research Agency.References
1. H. C. Taylor, et al. Experimental verification of numerically predicted electric field distributions produced by a radiofrequency coil. Phys. Med. Biol.1997;42(7):1395–1402
2. A. Kangarlu, et al. Electric field measurements and computational modeling at ultrahigh-field MRI. Magn. Reson. Imaging 2007; 25(8):1222–1226.
3. P. Nordbeck, et al. Spatial distribution of RF-induced E-fields and implant heating in MRI. Magn. Reson. Med. 2008; 60(2):312–319.
4. B. Loader, et al. Evaluation of an optical electric field sensor for measurement of specific absorption rate (SAR) during magnetic resonance imaging. 2012 International Symposium on Electromagnetic Compatibility (EMC EUROPE); 2012
5. S. Reiss, et al. An optical setup for electric field measurements in MRI with high spatial resolution. Phys. Med. Biol. 2015; 60(11): 4355–4369
Figures


