5068
Effect of Intense Utilization of Gradients in Magnetic Resonance Current Density Imaging and its Removal1Electrical and Electronics Engineering Dept., METU, Ankara, Turkey, 2Electrical and Electronics Engineering Dept., Bartın University, Bartın, Turkey
Synopsis
Intense utilization of gradients causes spatial and temporal variations of the main magnetic field which are consistent with resistive heating of the magnet structures. Since MR phase measurements are sensitive to the errors related to the $$$B_0$$$ inhomogeneities correction strategies are required. Here, it is shown that field variations due to the temperature change of MR equipment in Magnetic Resonance Current Density Imaging (MRCDI) using Induced Current Nonlinear Encoding-Spoiled Multi Gradient Echo (ICNE-
Introduction
In phase-sensitive MR protocols, the homogeneity and stability of the magnetic field are important for measurement accuracy 1. In gradient echo based Magnetic Resonance Current Density Imaging 2 (MRCDI) and Magnetic Resonance Electrical Impedance Tomography (MREIT) pulse sequences such as Induced Current Nonlinear Encoding-Spoiled Multi Gradient Echo 3 (ICNE-SPMGE), intense gradient utilization causes main magnetic field variation ($$$\triangle{B_0}$$$) 1. Therefore, to obtain true values of noise standard deviation and SNR level for the current-induced magnetic field, $$$B_z$$$, measurements, $$$\triangle{B_0}$$$ shifts must be removed by post-processing.
Methods
To investigate the effect of main magnetic field variation on the measured $$$B_z$$$ a set of $$$N=50$$$ measurements (magnitude and phase) are acquired using the ICNE-SPMGE sequence with the parameters given in Fig. 1(b). In order to remove systematic phase components from MR phase measurements, a single measurement is acquired without current injection.
Therefore, the obtained phase measurement related to $$$j^{th}$$$ echo ($$$\widetilde{\phi}_j(x,y)$$$) of ICNE-SPMGE sequence can be given as:
$$\widetilde{\phi}_j(x,y)={\zeta_\phi}_j(x,y)+\phi_j(x,y)\quad\quad{j=1...NE}\quad\quad\quad(1)$$
where $$${\zeta_\phi}_j(x,y)$$$ is the noise component in the phase image introduced by current injection, $$$\phi_j(x,y)$$$ is the current induced phase, and $$$NE$$$ is the number of echoes. By scaling $$$\widetilde{\phi}_j(x,y)$$$ with the gyromagnetic constant of the proton ($$$\gamma=267.513×10^{6}\,rad\,s^{-1}\,T^{-1}$$$) and the current injection duration, $$$T_c$$$, $$$B_z$$$ distributions can be obtained.
It is assumed that the noise distribution ($$$\zeta_{B_{z_j}}(x,y)$$$) of $$$B_z$$$ measurements is independent and identically distributed (i.i.d) complex Gaussian random noise with zero mean. Therefore, to estimate the distribution, $$$D_j^{\,i}(x,y)$$$ and the variance $$$\widehat{\sigma}_{\zeta_{B_{z_j}}}^2$$$ of noise for each echo, the sample mean, $$$\widehat{\mu}_j(x,y)$$$, of $$$N=50$$$ $$$B_z$$$ measurements is calculated as:
$$$\widehat{\mu}_j(x,y)=\frac{1}{N}\sum_{i=1}^N\widetilde{B}_{z_j}^{\,i}(x,y)\quad\quad\quad j=1...NE\quad\quad N=50\quad\quad\quad(2)$$$
where $$$\widetilde{B}_{z_j}^{\,i}(x,y)$$$ is the noisy magnetic flux density distribution of the $$$i^{th}$$$ measurement of the $$$j^{th}$$$ echo. Therefore, $$$N=50$$$ noise distributions ($$$D_j^{\,i}(x,y)$$$) of each echo can be obtained as:
$$D_j^{\,i}(x,y)=\sum_{i=1}^N(\widetilde{B}_{z_j}^{\,i}(x,y)-\widehat{\mu}_j(x,y))\quad\quad\quad j=1...NE\quad\quad N=50\quad\quad\quad(3)$$
Then, the noise variance of each echo can be calculated as:
$$\frac{1}{MN}\sum_{m=1}^M\sum_{i=1}^N(\widetilde{B}_{z_j}^{\,i}(x,y)-\widehat{\mu}_j(x,y))^{2}=\widehat{\sigma}_{\zeta_{B_{z_j}}}^2\quad\quad\quad{j=1...NE}\quad\quad{N=50}\quad\quad\quad(4)$$
where $$$M$$$ is the total number of pixels.
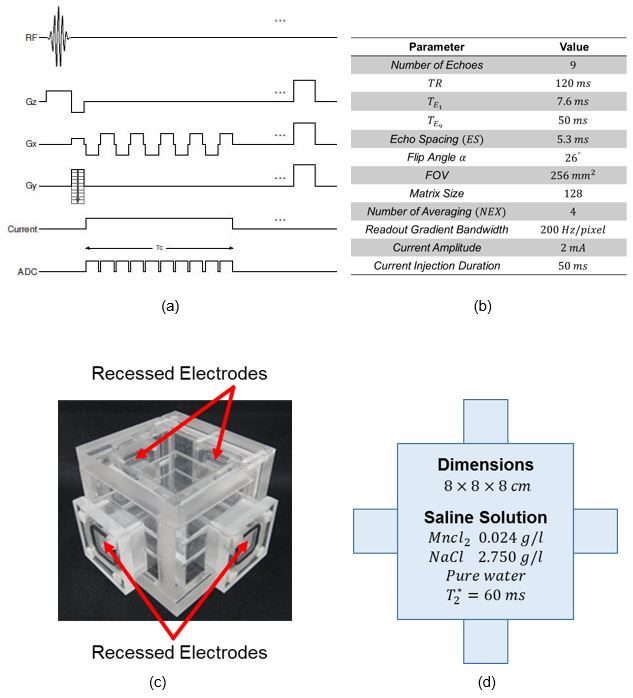
Experimental Setup and Sequence Parameters
A $$$3\,T$$$ clinical MRI scanner (MAGNETOM TRIO, SIEMENS) with $$$70\,cm$$$ bore diameter and $$$45\,mT\,m^{-1}$$$ maximum gradient strength is used. Data acquisition is performed using a single channel body coil. Current pulses with $$$2\,mA$$$ amplitude are injected to the imaging phantom in synchrony with SPMGE pulse sequence Fig.1(a), with the parameters given in Fig. 1(b). Current injection is performed by a programmable current source 4 via shielded cables and recessed cupper sheet electrodes. A single current injection (horizontal) profile is used. The experimental phantom in Fig. 1(c) is made of Plexiglas filled with a saline solution. Properties of the saline solution are given in Fig. 1(d).Results and Discussions
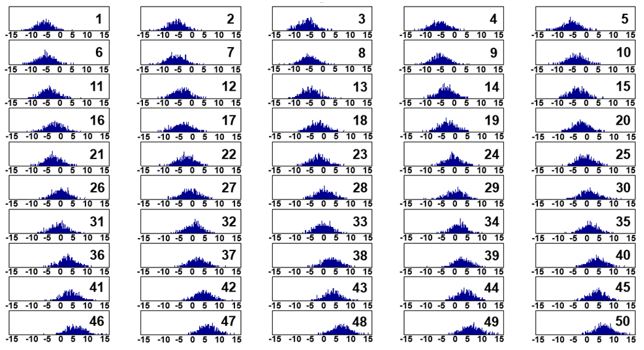
Noise distributions of $$$B_z$$$ images for $$$N=50$$$ measurements of the $$$9^{th}$$$ (last) echo are shown in Fig. 2
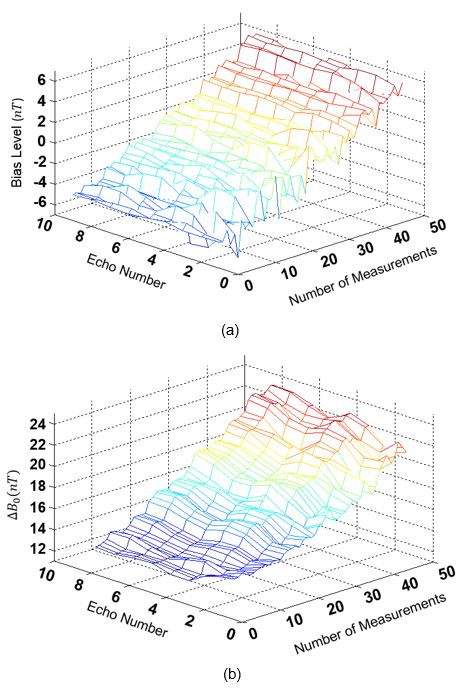
The noise means for $$$N=50$$$ measurements of entire 9 echoes is shown in Fig. 3(a).
The effect of intense gradient utilization on main magnetic field variation ($$$\triangle{B_0}$$$) can be calculated as 1:
$$\triangle{B_0}(\overrightarrow{r},t_2-t_1,T_{E_j})=\frac{\triangle{\phi}(\overrightarrow{r},t_2-t_1,T_{E_j})}{\gamma\,{T_{E_j}}}\quad\quad\quad{j=1...NE}\quad\quad\quad\quad\quad(5)$$
where $$${T_{E_j}}$$$ is the echo time of the $$$j^{th}$$$ echo, $$$\triangle{\phi}(\overrightarrow{r},t_2-t_1,T_{E_j})$$$ is difference between the two phase images acquired with the same $$$T_E$$$ at different time instants ( $$$t_1$$$ and $$$t_2$$$). The results for $$$\triangle{B_0}$$$ calculations is shown in Fig. 3(b).
To calculate $$$\triangle{B_0}$$$ values as given in Eq. (5), the difference of phase images that are acquired with the same $$$T_E$$$ at different time instances is calculated. As, the temperature of the scanner increases during successive measurements, $$$\triangle{B_0}$$$ values become positive whereas, the $$$B_z$$$ noise means moves from negative through positive values. Therefore, there is a “DC offset” between the two measurements while the amount of total shift is the same.
$$$\triangle{B_0}$$$ shift (bias level) can be removed from the $$$B_z$$$ images by subtracting the bias level or mean value of each $$$B_z$$$ measurement from the corresponding $$$B_z$$$ image.
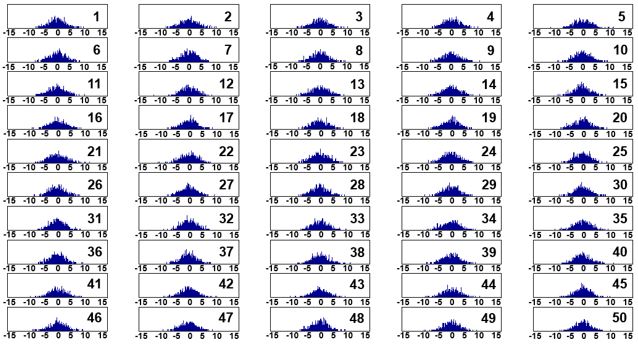
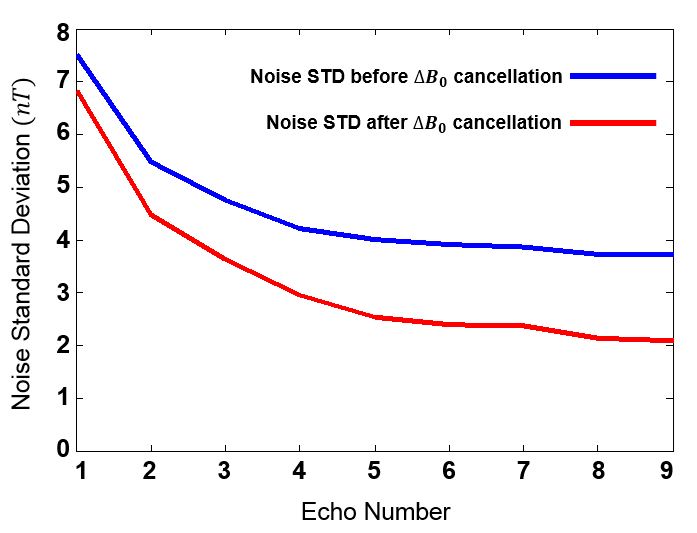
Therefore, the $$$\triangle{B_0}$$$ shift (bias level) can be removed from the $$$B_z$$$ images successfully. After $$$\triangle{B_0}$$$ shift cancellation, the sample mean is recalculated and the noise distributions and the standard deviations are obtained as shown in Fig. 4-5.
Conclusion
The intensive utilization of MRI scanner gradients causes a shift in the main magnetic field ($$$\triangle{B_0}$$$) which can be calculated using the method in 1. Here, it is observed that the $$$\triangle{B_0}$$$ shift is introduced to $$$B_z$$$ measurements of ICNE-SPMGE sequence as the mean of noise distribution (bias value). Therefore, to obtain true values for the noise standard deviation and SNR level of $$$B_z$$$ measurements bias values are removed using two methods. After bias cancellation the noise standard deviation decreases which result in SNR enhancement.Acknowledgements
This work is supported by the Scientific and Technological Research Council of Turkey (TÜBİTAK) under Research Grant 116E157.References
1. El-Sharkawy A M, Schär M, Bottomley P A, Atalar E. Monitoring and correcting spatio-temporal variations of the MR. MAGMA. 2006;19(5):223-236.
2. Scott G C, Joy M L G, Armstrong R L, Henkelman R M. Sensitivity of Magnetic-Resonance Current-Density Imaging. Journal of magnetic resonance. 1992;97:235-254.
3. Oh T I, Jeong W C, Kim J E, et al. Noise analysis in fast magnetic resonance electrical impedance tomography (MREIT) based on spoiled multi gradient echo (SPMGE) pulse sequence. Physics in Medicine and Biology. 2014;59(16):4723-4738.
4. Eroğlu H H, Eyüboğlu B M. Design and implementation of a bipolar current source for MR-EIT applications. MEDICON. 2013;41:161-164.
Figures