5064
Identification of mutation-dependent heterogeneity in murine models of cerebral small vessel disease using susceptibility weighted imaging at 14.1 Tesla1Department of Physical Therapy and Rehabilitation Science, University of California, San Francisco, San Francisco, CA, United States, 2Department of Radiology and Biomedical Imaging, University of California, San Francisco, San Francisco, CA, United States, 3Department of Ophthalmology, University of California, San Francisco, San Francisco, CA, United States, 4Institute for Human Genetics, University of California, San Francisco, San Francisco, CA, United States, 5Department of Anatomy, University of California, San Francisco, San Francisco, CA, United States
Synopsis
Cerebral small vessel diseases (
Introduction
Cerebral small vessel diseases (cSVDs) are a heterogeneous group of conditions that account for up to 20% of all strokes1. Common cSVD include intracerebral hemorrhage, microinfarcts, microbleeds and white matter (WM) lesions2. Despite the high prevalence of cSVDs, the underlying pathogenic mechanisms are poorly understood. Mutations in the gene encoding the major basement membrane components type IV collagen alpha 1 (COL4A1) constitute a major cause of cSVDs3. The pathogenicity of COL4A1 mutations is generally attributed to impaired secretion and we have shown that the severity of cerebral hemorrhage inversely correlates with secretion efficiency in an allelic series of Col4a1 mutant mice. In this study, we used three distinct Col4a1 mutant mouse strain of cSVDs to investigate whether T2-weighted (T2-w) and Susceptibility Weighted Imaging (SWI) imaging methods, that are commonly used to detect and monitor cSVD lesions in patients4, could be used differentiate between disease subtypes that might benefit from distinct therapeutic interventions. We found that while large hypointense lesions could be observed on T2-w images, SWI proved helpful at detecting smaller ones in all models. Furthermore, SWI could differentiate between models, with the number of SWI-detected lesions correlating with disease severity evaluated by hemosiderin staining. High field SWI thus demonstrate high potential for longitudinal and non-invasive monitoring of cSVD progression and response to potential therapeutic interventions in those models.Methods
Animals:
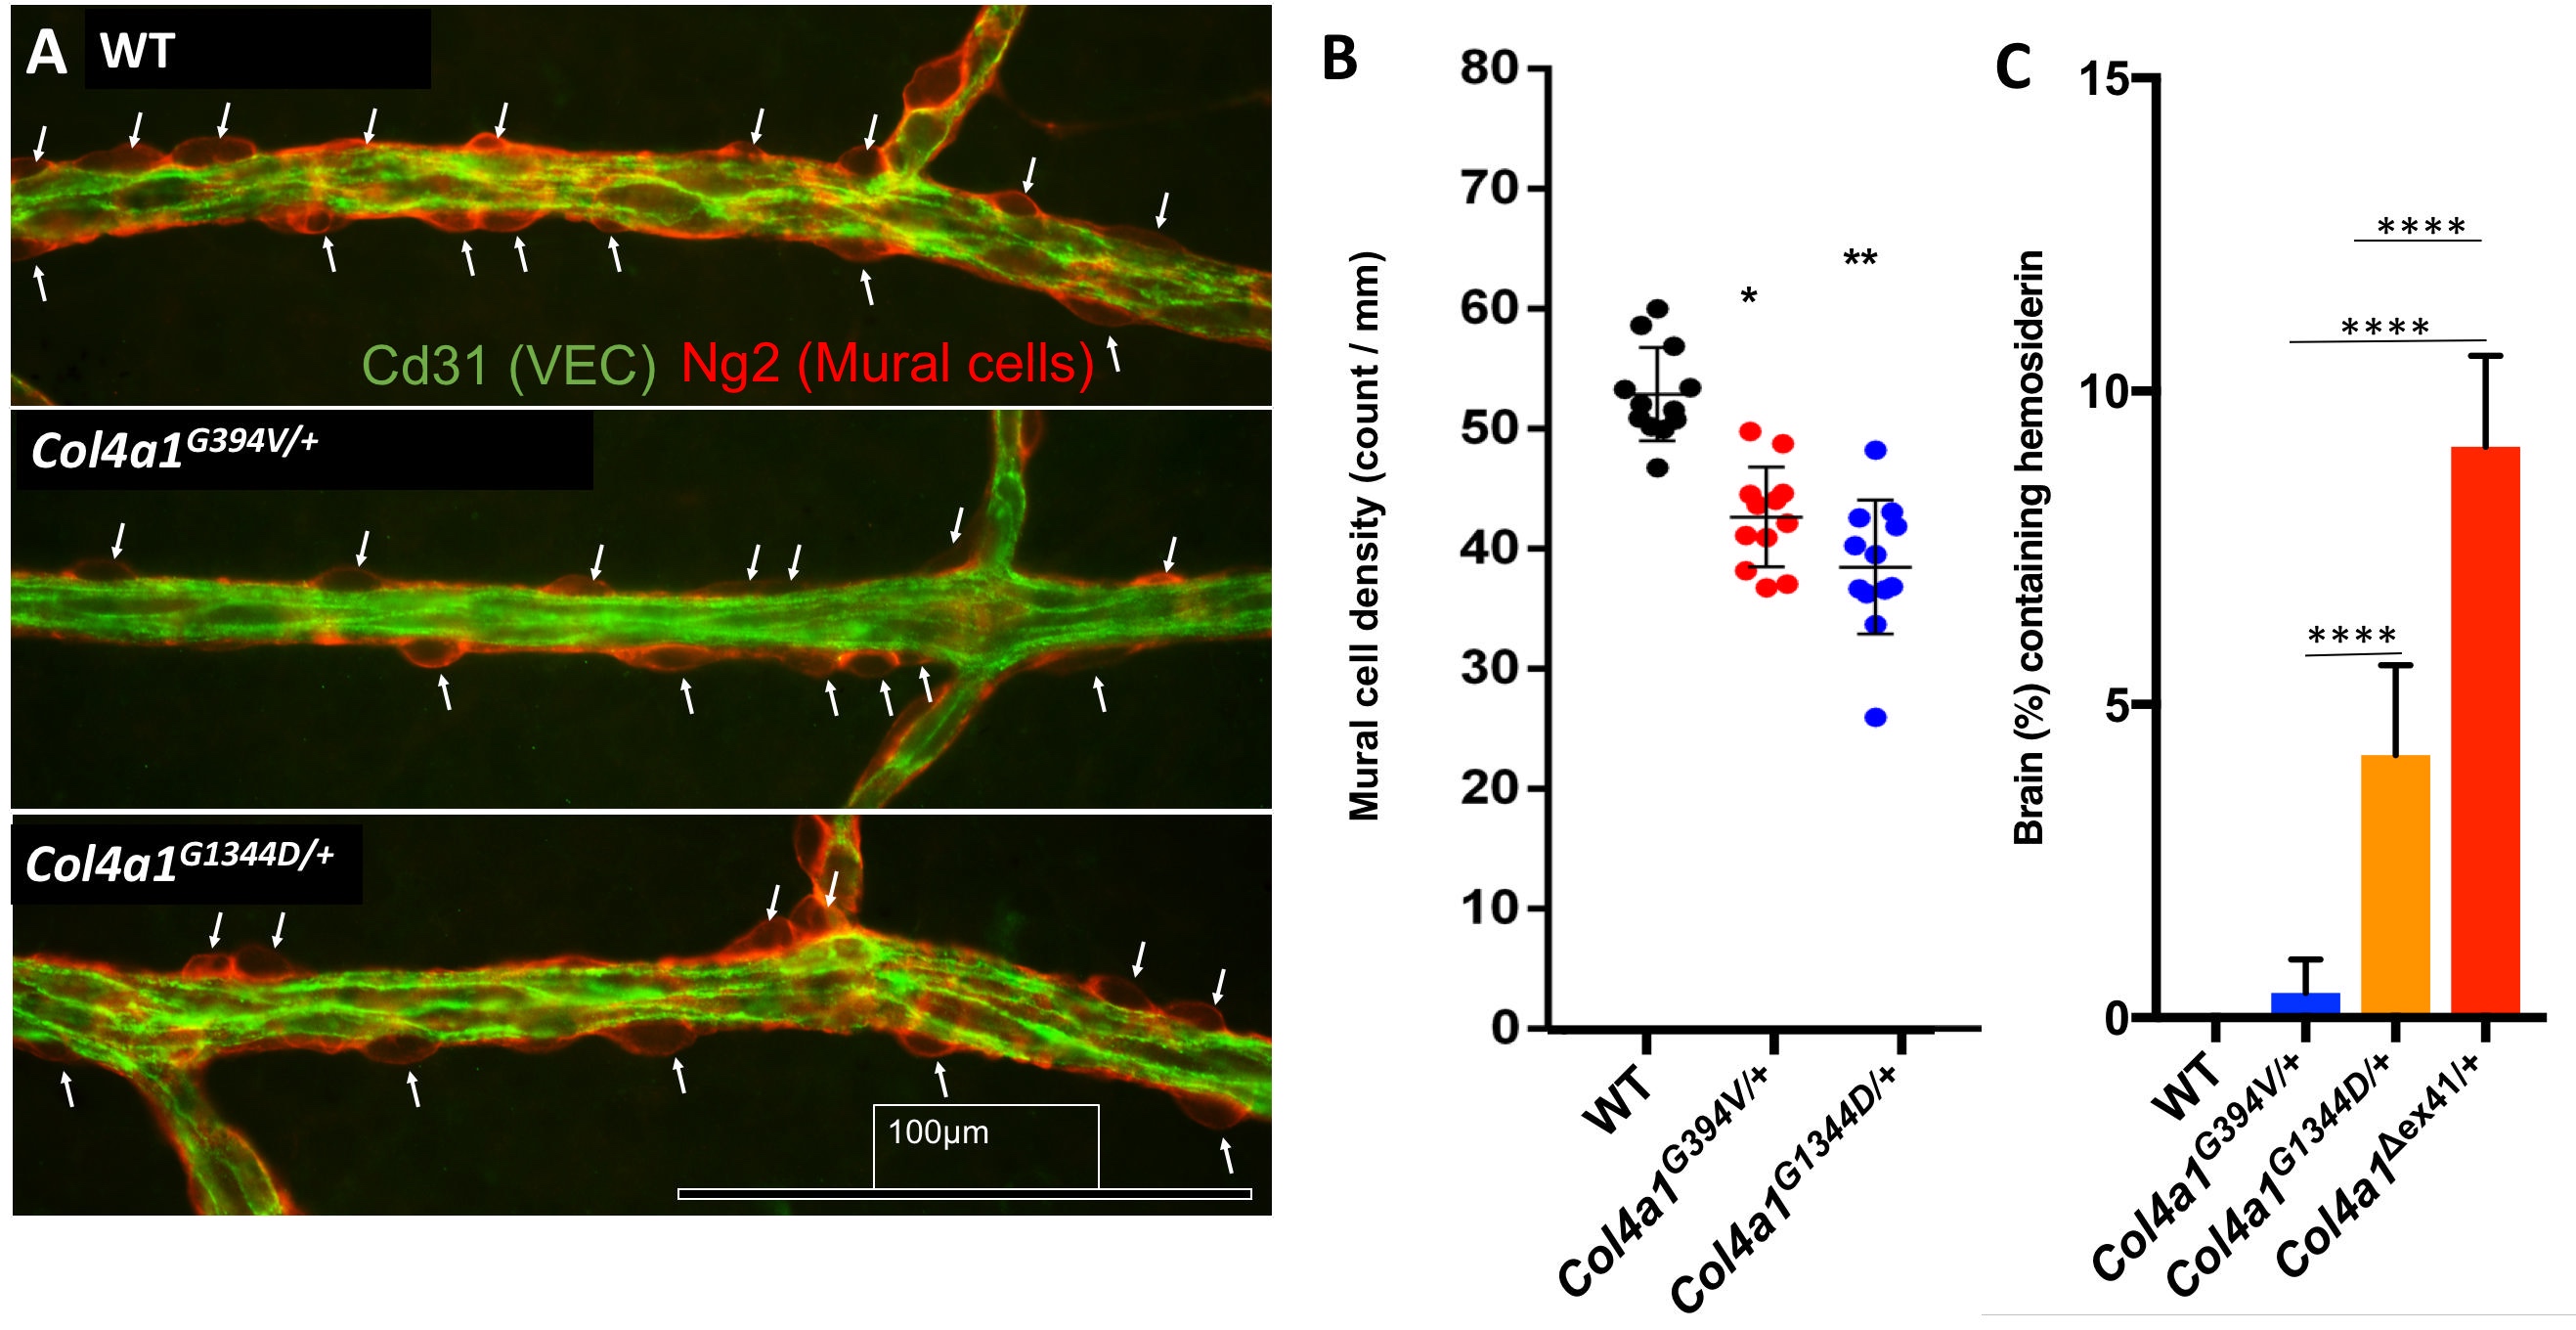
In this study, we used three distinct Col4a1 mutant mouse strains that develop mild or severe cSVD (Figure 1): Col4a1G394V/+, Col4a1G1344D/+, and Col4a1Δex41/+.Female mice between 9 and 15 months, were used in all groups (Col4a1G394V/+, n=3; Col4a1G1344D/+, n=4; Col4a1Δex41/+, n=2). Aged-matched control mice were also imaged (n=7).
MR Acquisitions:
Each imaging session was performed on a 14.1 Tesla Agilent® system using a 1H Agilent® volume coil (inner diameter 40mm). Mice were imaged under 1-2% isoflurane anesthesia using the following two optimized sequences of matching geometry (FOV=20x20mm2, matrix 256x256, 12 slices, 0.5mm slice thickness), for an overall acquisition time of 25 mins/animal: (1) T2-weighted 2D fast spin-echo (TE/TR=20/1200ms, 8 averages); (2) 2D gradient echo (TR/TE = 111.3/4.64ms; FA =10°; 10 averages). Gradient echo images were processed using in-house MATLAB programs. Briefly, images were filtered using a Hanning window of 64 points in k-space. The phase mask was obtained by the complex division of the original image and the low pass image. The original image was then multiplied by the phase mask with an exponent 4 to create SWI images.
Data Analysis:
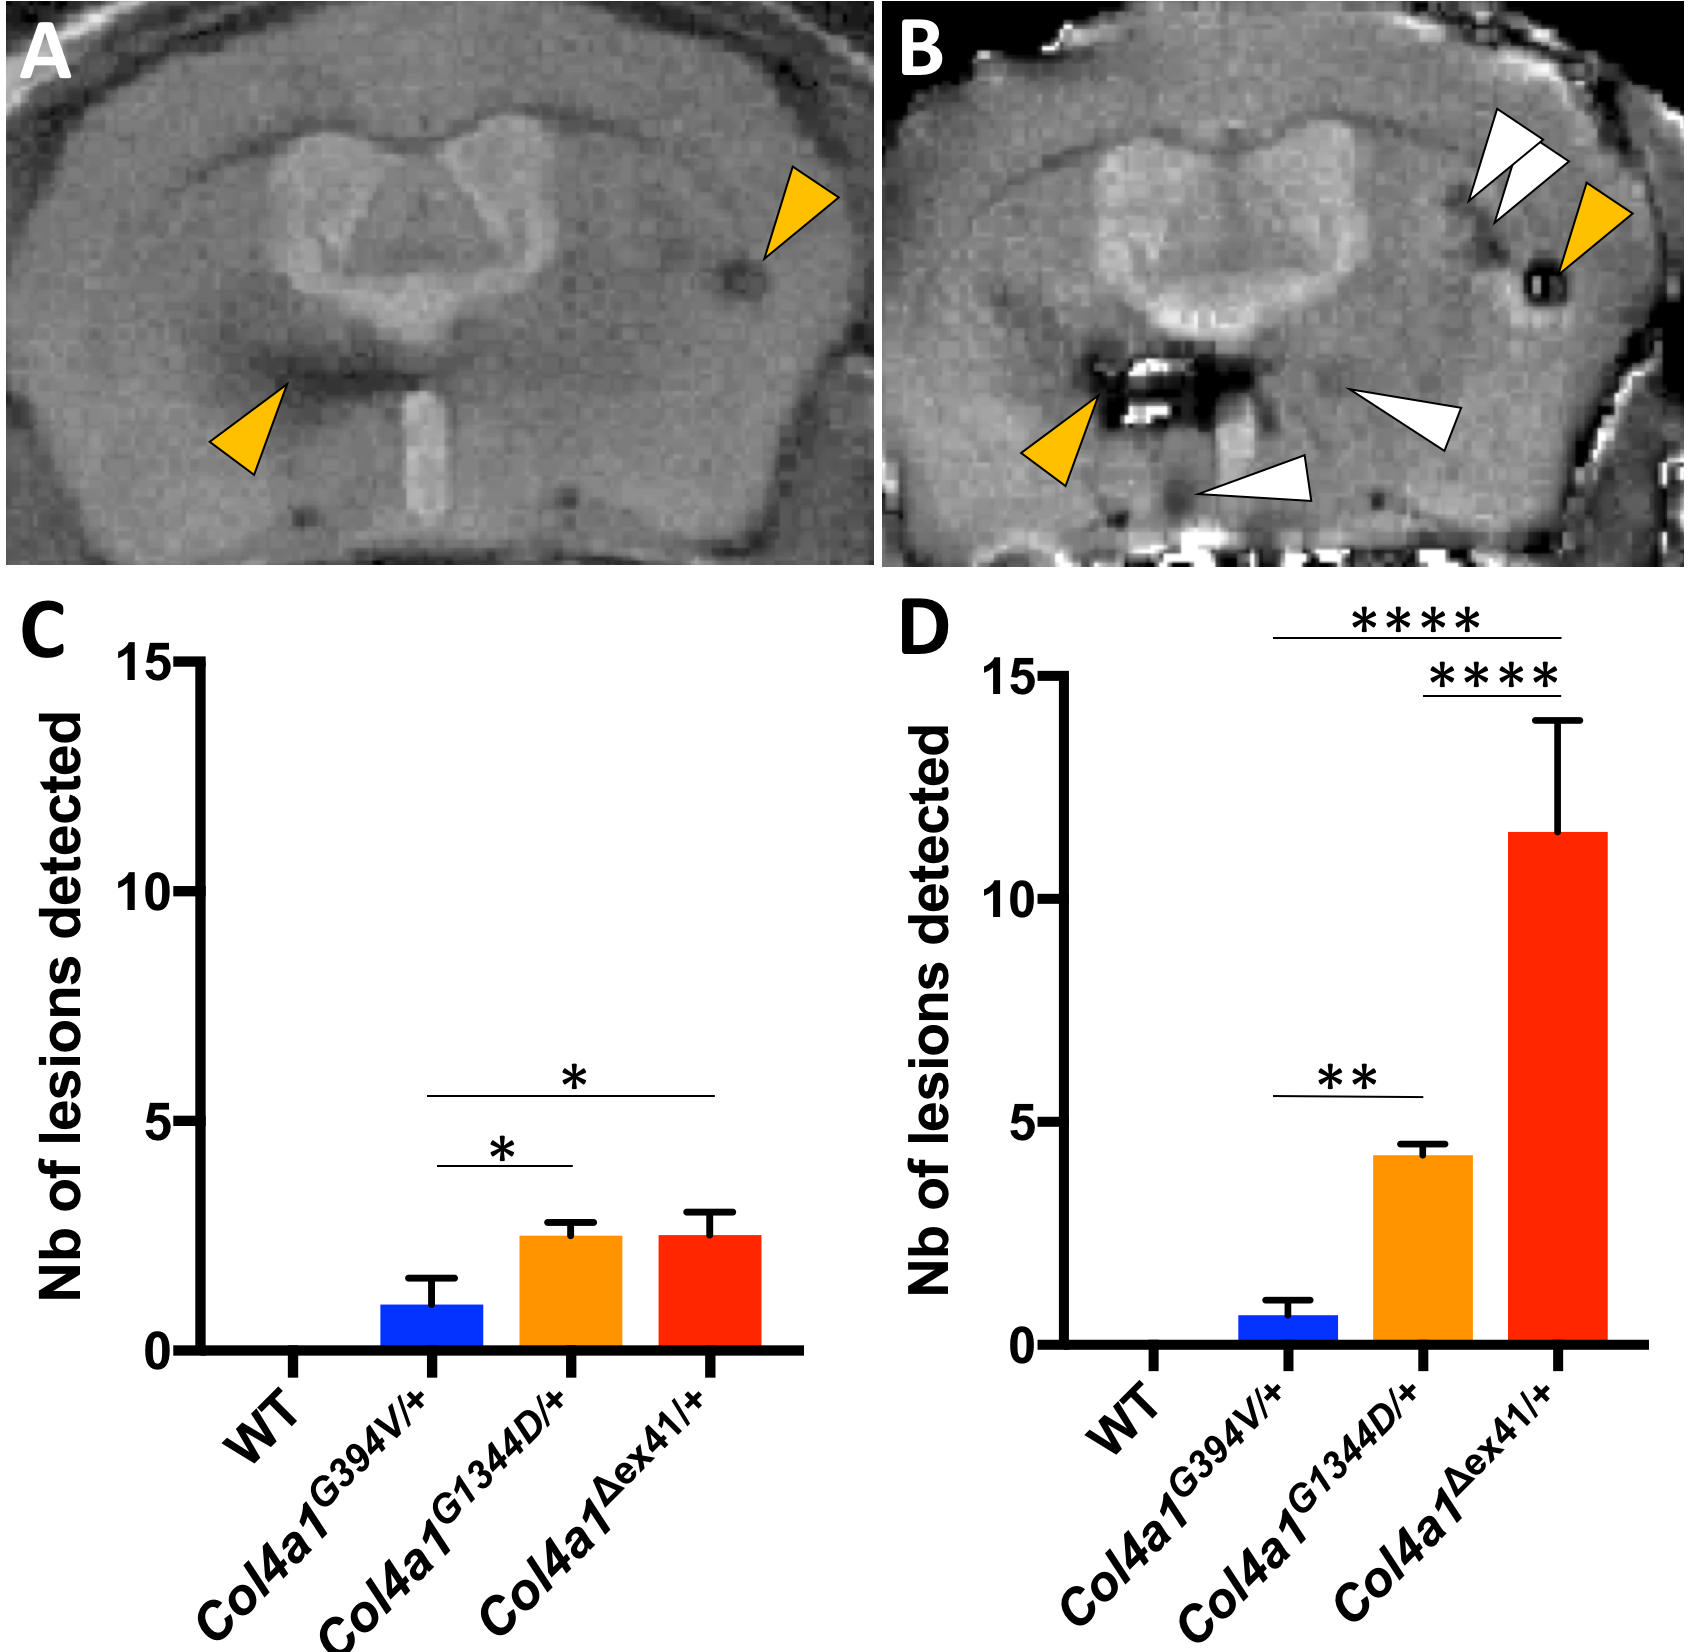
Hypointense lesions were manually counted on T2-w and SWI images, in the following regions: entire brain, prefrontal cortex, anterior commissure, and hippocampus. Statistical analysis was performed using One-way ANOVA. All p-values were corrected for multiple comparison using a Tukey test and defined as follow: * p<0.05, ** p< 0.01 ***p<0.005, **** p<0001.
Results
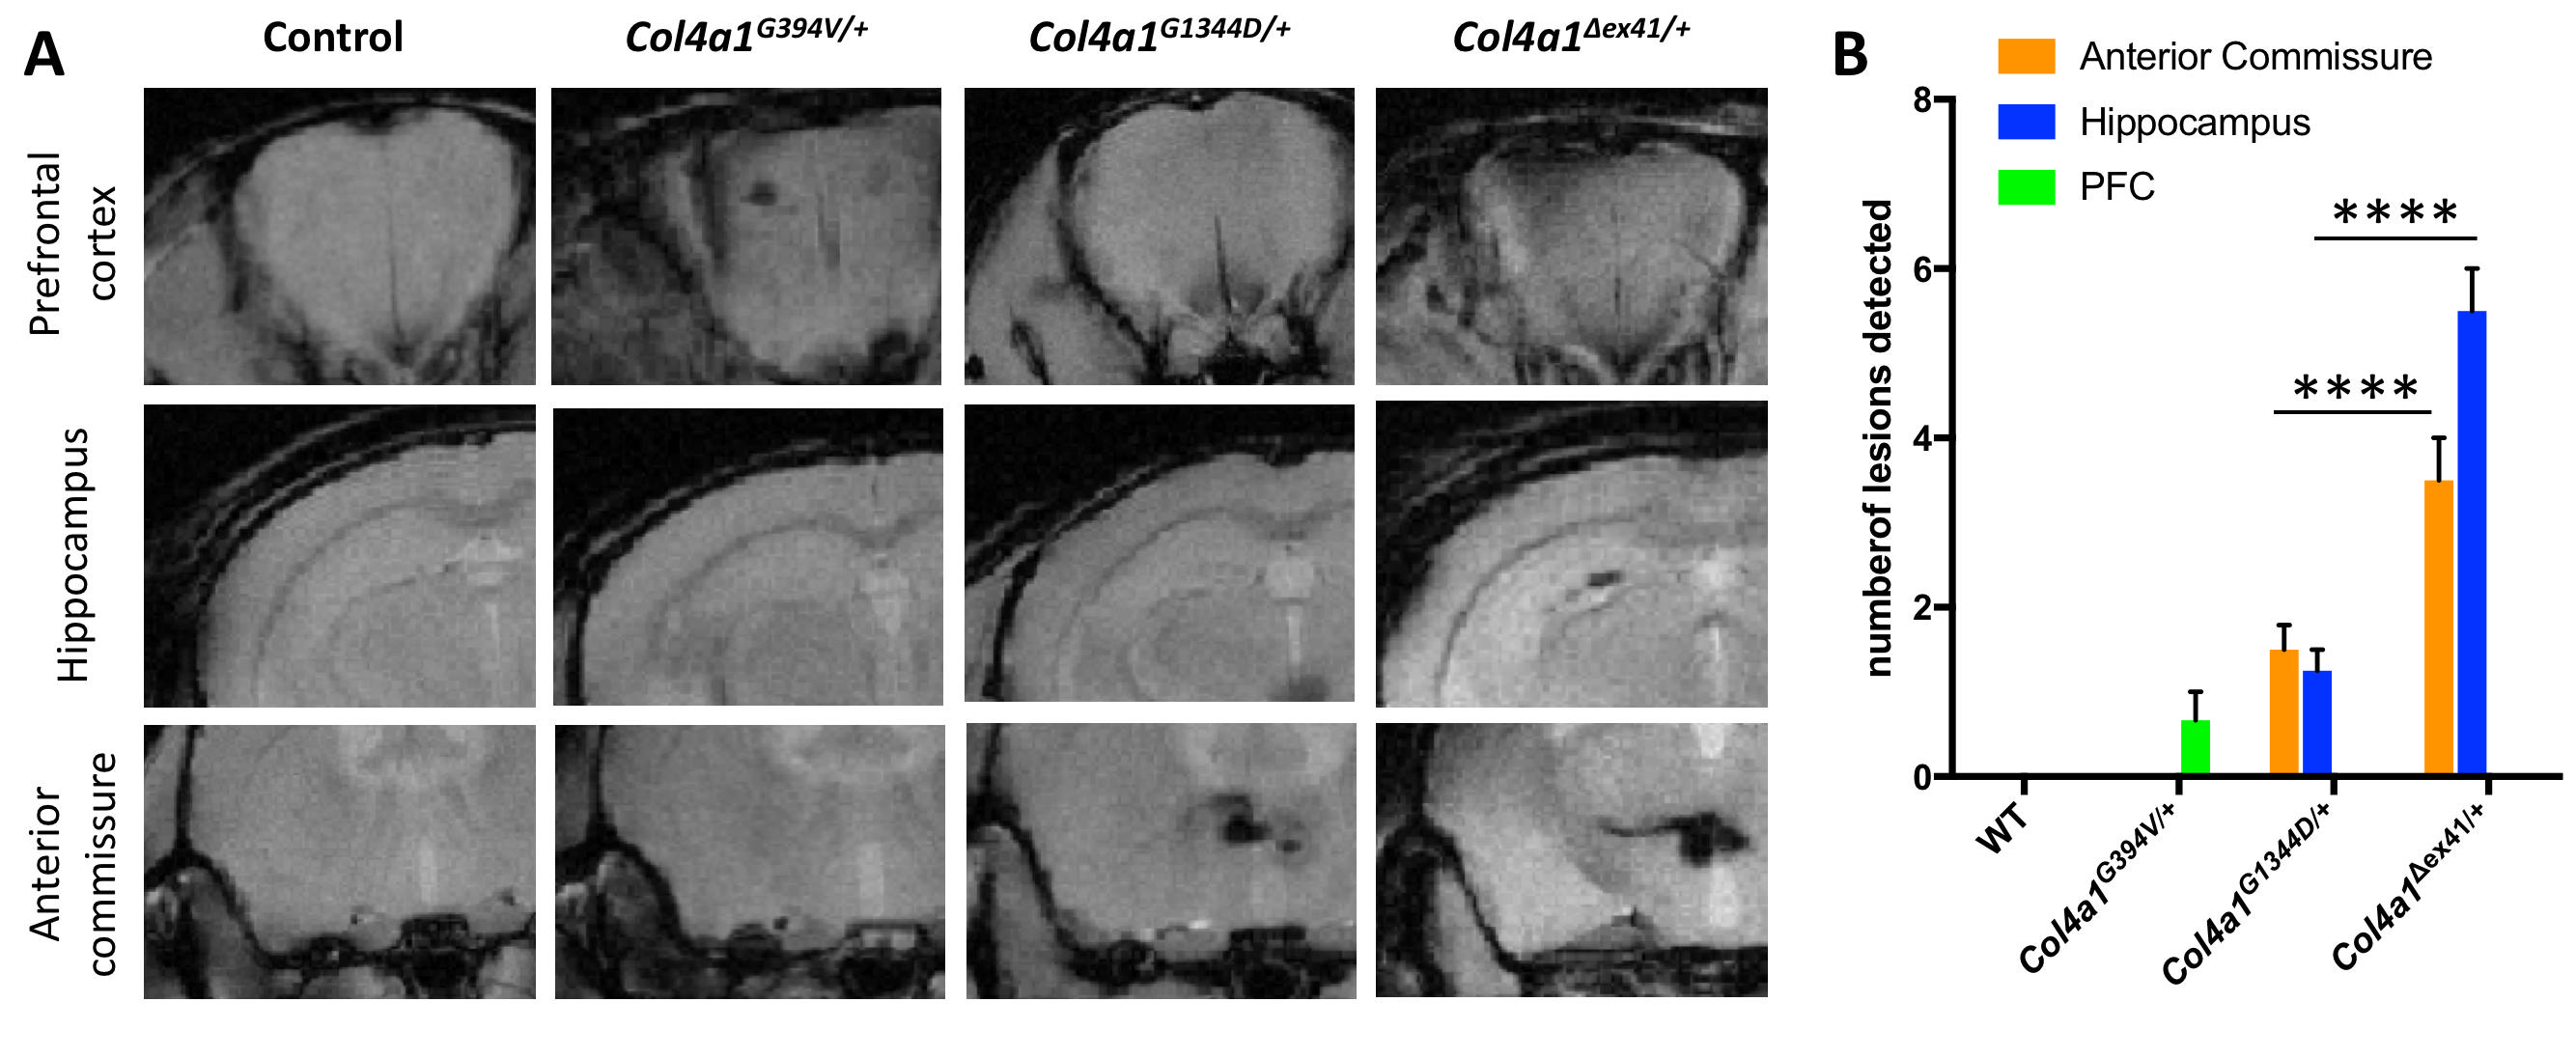
Hypointense lesions were detected in all Col4a1 mutant mice using both T2-w and SWI (Figure 2.A &B), but not in control animals. On T2-w images, the number of lesions observed was significantly lower in Col4a1G394V/+ mice compared to Col4a1G1344D/+ and Col4a1Δex41/+ mice. (Figure 2.C). A higher number of hypointense lesions (including smaller lesions) were detected in all groups when using SWI. Importantly, the number of lesions observed was significantly different between the three Col4a1 mutant strains (Figure 2.D) and correlated with Prussian blue staining quantification (Col4a1Δex41/+ > Col4a1G1344D/+ > Col4a1G394V/+ Figure 1.C). Finally, we found that the distribution of the lesions differs between Col4a1 mutant strains. Notably, lesions in the anterior commissure and hippocampus were observed in Col4a1Δex41/+ and Col4a1G1344D/+, but not in Col4a1G394V/+ mice. Conversely, lesions in the prefrontal cortex were exclusively detected in Col4a1G394V/+ mice, suggesting possible mechanistic heterogeneity among Col4a1 mutations. (Figure 3).Conclusion
Here we show that SWI at 14.1Tesla is more sensitive than T2-w for the detection of cSVD lesions in Col4a1 mutant mice. Notably, SWI detected significant differences in the number of lesions between distinct Col4a1 mutant strains which correlated with the severity of cerebral hemorrhages detected by histological analysis. Importantly, SWI revealed a distinct distribution pattern of the lesions between Col4a1 mutant mouse strains, suggesting mechanistic heterogeneity among Col4a1 mutations. Thus, SWI represents a valuable tool for the quantitative and qualitative characterization of cerebrovascular lesions in mouse models of cSVDs. In addition, the use of SWI will permit longitudinal and non-invasive monitoring of disease progression and response to potential therapeutic agentsAcknowledgements
This work has been supported by NIH: NS096173 and NS110044.References
[1] L. Pantoni and P. B. Gorelick, Cerebral Small Vessel Disease. Cambridge University Press, 2014. [2] L. Pantoni, “Cerebral small vessel disease: from pathogenesis and clinical characteristics to therapeutic challenges,” Lancet Neurol., vol. 9, no. 7, pp. 689–701, Jul. 2010.
[3] S. Lanfranconi and H. S. Markus, “COL4A1 Mutations as a Monogenic Cause of Cerebral Small Vessel Disease A Systematic Review,” 2010.
[4] J. M. Wardlaw et al., “Neuroimaging standards for research into small vessel disease and its contribution to ageing and neurodegeneration,” Lancet Neurol., vol. 12, no. 8, pp.
Figures