5063
Inversion Recovery Susceptibility Weighted Imaging with Enhanced T2 Weighting (IR-SWIET): Application to Multiple Sclerosis (MS) Lesions1Radiology & Imaging Sciences, National Institutes of Health, Bethesda, MD, United States, 2TNS/NINDS, National Institutes of Health, Bethesda, MD, United States
Synopsis
Susceptibility weighted imaging provides important information regarding iron deposition and lesions in multiple sclerosis. However, CSF appears hyperintense on SWI images and can interfere with cortical lesion detection. Cortical lesions are associated with disability and disability progression in MS patients. Here a new 3D sequence (IR-SWIET), which suppresses CSF while maintaining T2 and T2* contrast of SWI is designed and evaluated. IR-SWIET was compared with four other commonly used sequences. CNR analysis in 30 lesions from MS patients showed that the sequence provided superior lesion depiction compared with SWI and compared well with 3D-DIR, MP2RAGE, and FLAIR.
Purpose
To develop and evaluate a CSF suppressed 3D susceptibility weighted imaging sequence for better cortical lesion detection.INTRODUCTION
Multiple sclerosis is an inflammatory demyelinating and neurodegenerative disease of the central nervous system. Iron deposition visualized through susceptibility weighted imaging (SWI) has been thought to be a surrogate biomarker for different lesion characteristics1. Iron concentration changes have been observed in newly forming lesions of MS patients2, while central veins visualized by SWI may be a distinguishing feature of MS lesions3.
3D interleaved echo planar4 or spiral5 imaging provides rapid SWI of the entire brain with high resolution in a relatively short time. However, images obtained with SWI exhibit CSF and lesion hyperintensity due to T2-weighting. The relatively bright CSF signal can make it difficult to visualize cortical lesions adjacent to CSF. Cortical lesions may be more strongly associated with disability progression than white matter lesions6. Here we describe and analyze an SWI sequence tailored to easily detect cortical and subcortical lesions.
METHODS
Theory and Simulations
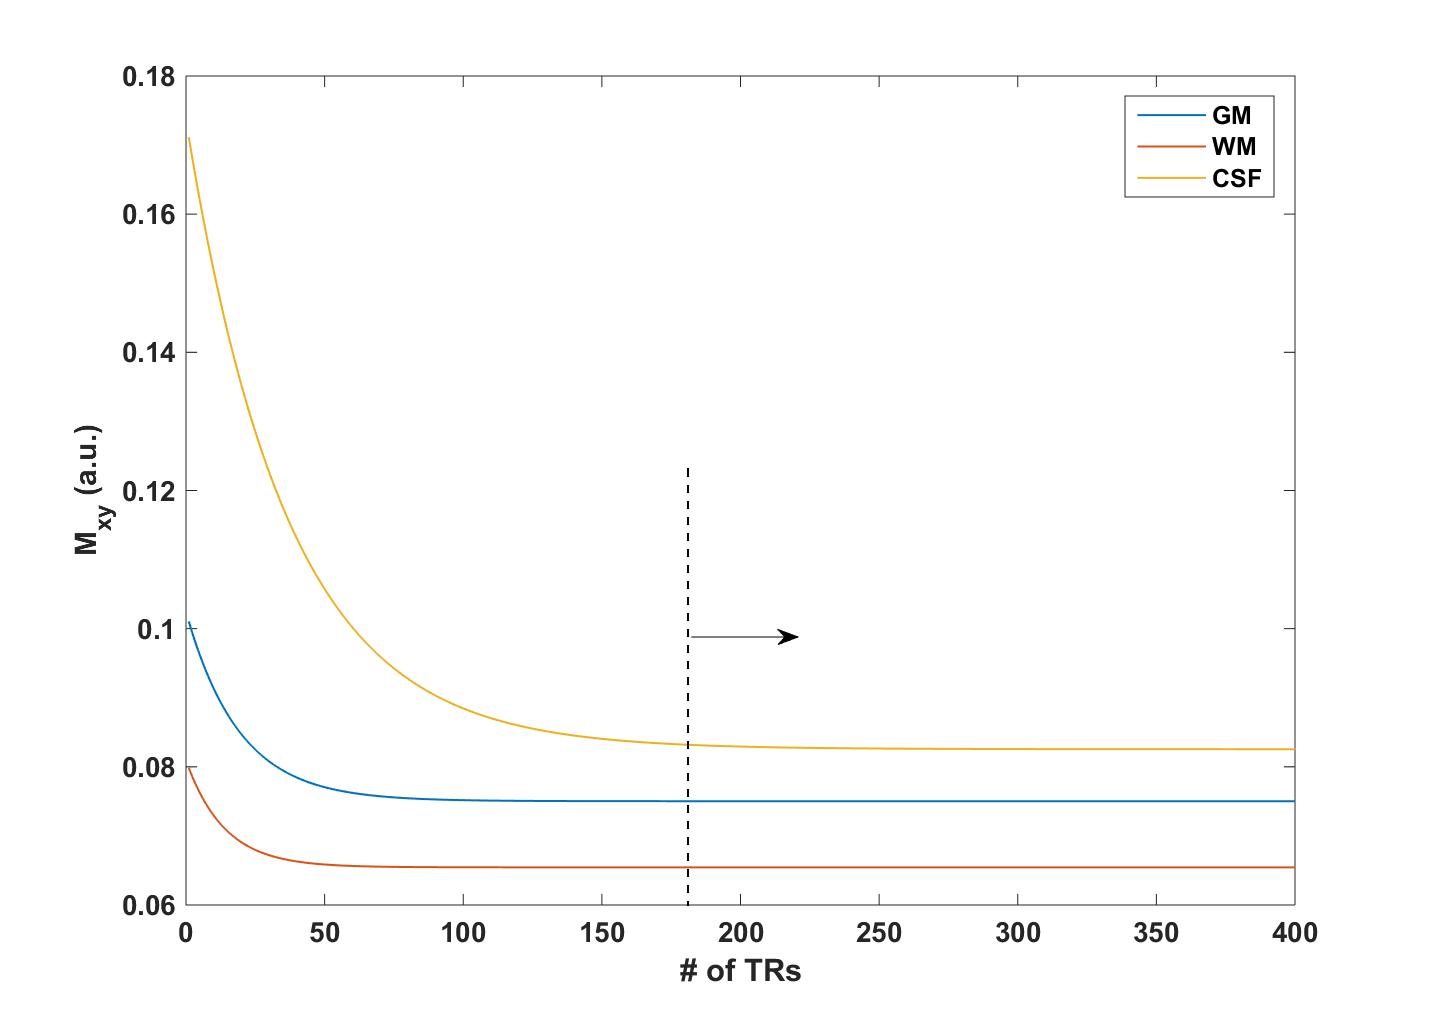
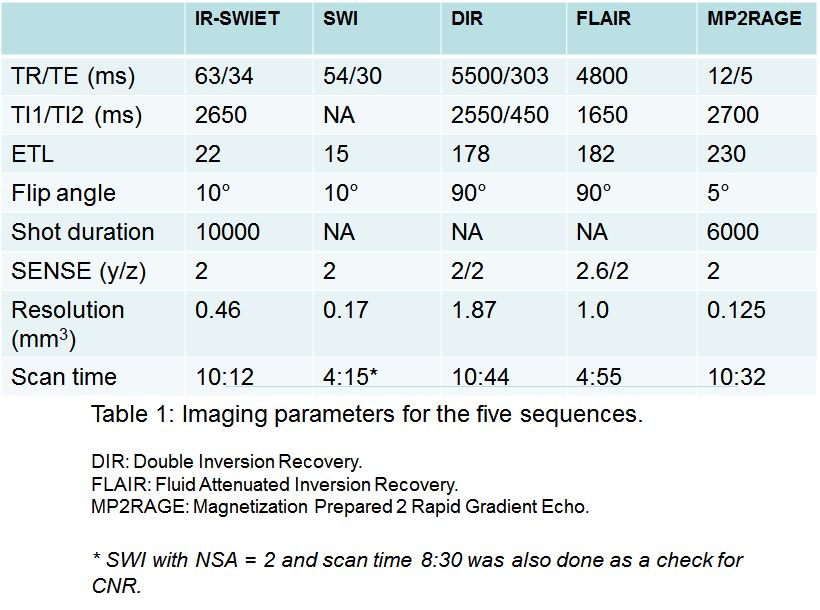
The aim was to suppress CSF while maintaining T2 and T2* contrast similar to a 3D SWI sequence. Bloch simulation for SWI (Figure 1) shows the signal evolution for GM, WM and CSF. T1/T2 and proton density values from literature were used7-10 along with parameters corresponding to 3D SWI (Table 1). Acquisition is performed at steady-state (Figure1, arrow). The sequence exhibits T2 weighting as a result of which CSF signal is hyperintense.
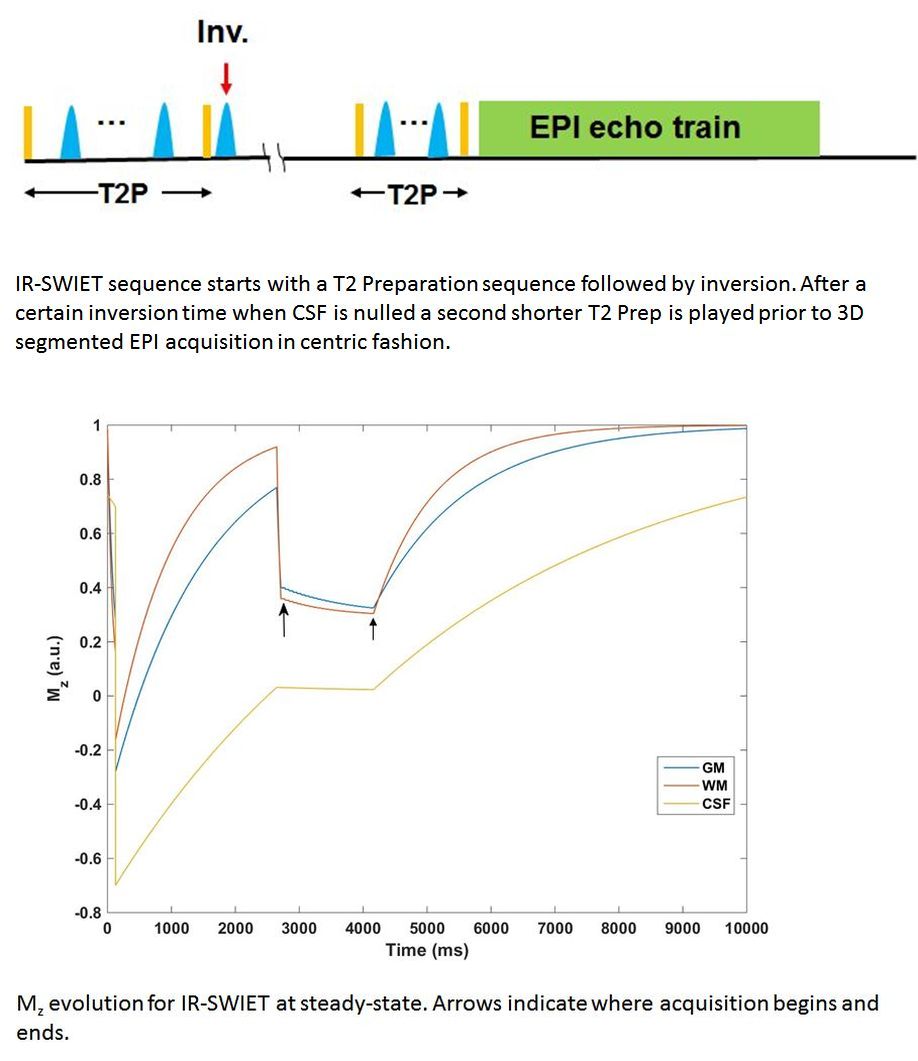
The SWI sequence was modified to suppress CSF using 90x−180y(4) −90-x T2Prep followed by inversion similar to preparation for 3D FLAIR11. Since magnetization for GM recovers at a slower rate than for WM, GM-lesion-WM T2 contrast is compromised at CSF null. To compensate for the lower GM longitudinal magnetization, a shorter duration T2-Prep pulse was introduced prior to EPI acquisition to provide T2-weighting. This T2-Prep duration was based on calculated time at which GM and WM signal are equal based on their initial magnetization values. The final sequence is shown schematically in Figure 2, along with magnetization evolution. Improved T2-weighting was obtained by acquiring the echo train in a centric fashion.
Scanning
Three MS patients with longstanding disease and cortical lesions were scanned under an IRB approved protocol on Philips 3T Achieva scanner using a 32-channel head coil. A control group of two neurologically healthy volunteers was also scanned.
Analysis
IR-SWIET was compared with 3D FLAIR, 3D DIR, 3D SWI and MP2RAGE12 (Table 1). Contrast to noise ratio (defined as (SI1–SI2)/(SI1+SI2)) was measured in 30 lesions (intracortical, leukocortical and periventricular) which were depicted on all sequences after registration and reformatting.
RESULTS
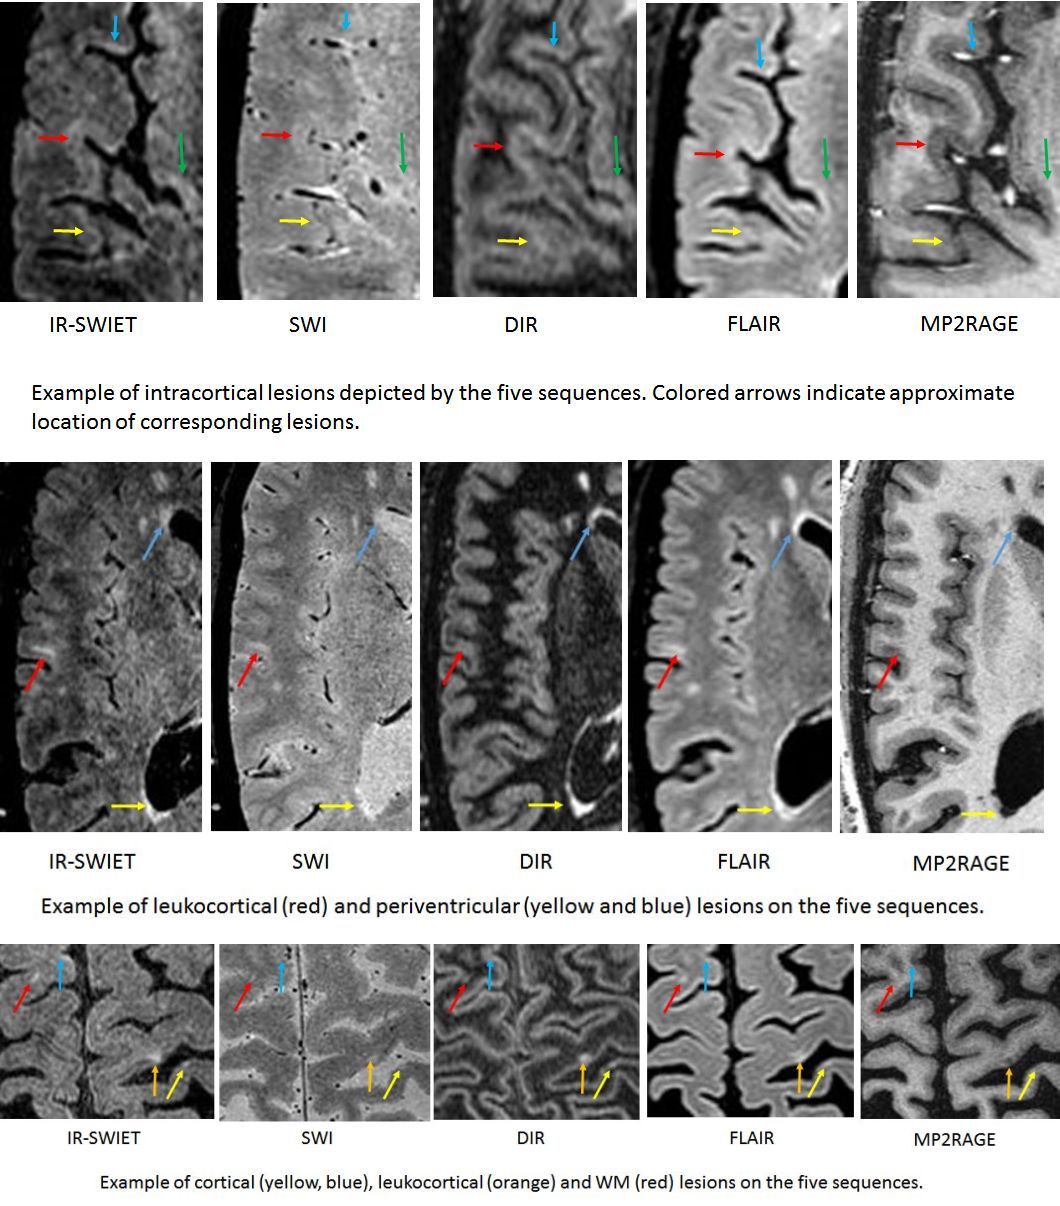
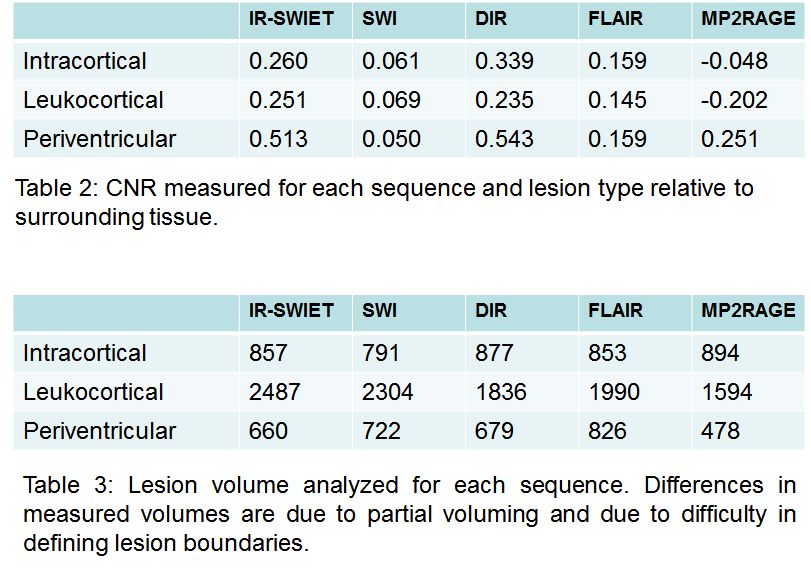
Figure 3 shows comparison images for lesions depicted on the five sequences. Table 2 shows CNR measurements (weighted by size) obtained from the three lesion sub-types for all sequences. Table 3 provides total lesion volumes analyzed.
IR-SWIET and DIR showed similar contrast for all three types of lesions studied, while SWI showed the poorest contrast. Intracortical lesions on DIR although hyperintense compared with WM/CSF were sometimes almost isointense with surrounding unaffected GM. MP2RAGE had comparable contrast as IR-SWIET and DIR for leukocortical lesions but poorer contrast for intracortical lesions due to hypointensity and proximity to suppressed CSF.
DISCUSSION
Being EPI based, IR-SWIET could exhibit sensitivity to spatial and temporal variations in B0 field homogeneity caused by susceptibility effects and time-varying eddy currents. Reducing scan time or using dynamic correction techniques can help ameliorate such effects. Employing multiple T2-Prep pulses only modestly increased SAR to 8% of the allowed maximum.
Accurate optimization for IR-SWIET parameters based on Bloch simulation is confounded by the range of T1/T2 values for WM and GM reported in literature13. Different combinations of parameters (including shorter shot duration) are possible albeit with slightly different CNR. In addition, combining magnitude and phase images could provide additional information on lesion characterization, similar to SWI.
Although we have compared lesions across 3D FLAIR, 3D MPRAGE and DIR with IR-SWIET to show accurate correspondence between them, histological evidence for lesions noticed exclusively on IR-SWIET is currently lacking. While some differences can be attributed to different resolution and resulting partial volume effects, care was taken while drawing ROIs to reduce errors. In addition, analyzing several lesions as done here reduces such errors. CNR as defined here does not change substantially with increased scan time. This was verified for SWI with NSA = 2 instead of 1.
CONCLUSION
IR-SWIET offers better cortical lesion depiction than SWI due to CSF suppression and provides an added tool for lesion detection in MS patients.Acknowledgements
No acknowledgement found.References
1. Haacke EM, Makki M, Ge Y, et al. Characterizing iron deposition in multiple sclerosis lesions using susceptibility weighted imaging. J Magn Reson Imaging 2009;29(3):537-544.
2. Zivadinov R, Tavazzi E, Bergsland N, et al. Brain Iron at Quantitative MRI Is Associated with Disability in Multiple Sclerosis. Radiology 2018:180136.
3. Tan IL, van Schijndel RA, Pouwels PJ, et al. MR venography of multiple sclerosis. AJNR Am J Neuroradiol 2000;21(6):1039-1042.
4. Zwanenburg JJ, Versluis MJ, Luijten PR, Petridou N. Fast high resolution whole brain T2* weighted imaging using echo planar imaging at 7T. Neuroimage 2011;56(4):1902-1907.
5. Wu B, Li W, Avram AV, Gho SM, Liu C. Fast and tissue-optimized mapping of magnetic susceptibility and T2* with multi-echo and multi-shot spirals. Neuroimage 2012;59(1):297-305.
6. Calabrese M, Agosta F, Rinaldi F, et al. Cortical lesions and atrophy associated with cognitive impairment in relapsing-remitting multiple sclerosis. Arch Neurol 2009;66(9):1144-1150.
7. Stanisz GJ, Odrobina EE, Pun J, et al. T1, T2 relaxation and magnetization transfer in tissue at 3T. Magn Reson Med 2005;54(3):507-512.
8. Shin W, Gu H, Yang Y. Fast high-resolution T1 mapping using inversion-recovery Look-Locker echo-planar imaging at steady state: optimization for accuracy and reliability. Magn Reson Med 2009;61(4):899-906.
9. Gai ND, Butman JA. Modulated repetition time look-locker (MORTLL): a method for rapid high resolution three-dimensional T1 mapping. J Magn Reson Imaging 2009;30(3):640-648.
10. Gutteridge S, Ramanathan C, Bowtell R. Mapping the absolute value of M0 using dipolar field effects. Magn Reson Med 2002;47(5):871-879.
11. Rydberg JN, Riederer SJ, Rydberg CH, Jack CR. Contrast optimization of fluid-attenuated inversion recovery (FLAIR) imaging. Magn Reson Med 1995;34(6):868-877.
12. Beck ES, Sati P, Sethi V, et al. Improved Visualization of Cortical Lesions in Multiple Sclerosis Using 7T MP2RAGE. AJNR Am J Neuroradiol 2018.
13. Bojorquez JZ, Bricq S, Acquitter C, Brunotte F, Walker PM, Lalande A. What are normal relaxation times of tissues at 3 T? Magn Reson Imaging 2017;35:69-80.
Figures