5057
Investigating the Relationship Between Conductivity and Bound Sodium Fractions at 21.1 T1Physics, Florida State University, Tallahassee, FL, United States, 2National High Magnetic Field Laboratory, Florida State University, Tallahassee, FL, United States, 3Biomedical Engineering, Florida State University, Tallahassee, FL, United States
Synopsis
This study investigates the relation between electrical conductivity evaluated using MR Electrical Properties Tomography (EPT), sodium concentrations and their mobility. In particular, the project seeks to determine if conductivity values calculated from EPT differentiate between bound and free sodium measured by triple quantum (TQ) coherence selection. TQ and EPT acquisitions were evaluated over a range of sodium concentration and with different binding conditions to provide insight into the sources of tissue conductivity changes. The correlation between electrical conductivity and ionic content can provide more in depth understanding of how sodium ions are changing in pathological conditions.
Purpose
Materials and Methods
Bound sodium is mimicked in two separate phantoms using different concentrations of either aqueous Ficoll or agarose gel. Ficoll is an extracellular protein that mimics the glycan moiety of the extracellular matrix and offers specific Na+ binding (4). Agarose offers nonspecific Na+ binding and forms a hydrogel matrix that restricts sodium mobility and diffusion via pore structure. A Ficoll phantom was made with concentrations of 10, 20, 30 and 40% Ficoll with 1 g/80mL of NaCl in ultra-pure water. An agarose phantom was made with 0, 1, 2 and 3% agarose with 2 g/80mL of NaCl in ultra-pure water. Aqueous NaCl solutions ranging from 0-2.56 g/100 mL in ultra-pure water served as bulk standards. Conductivity was measured with an HP dielectric probe prior to MR experiments.
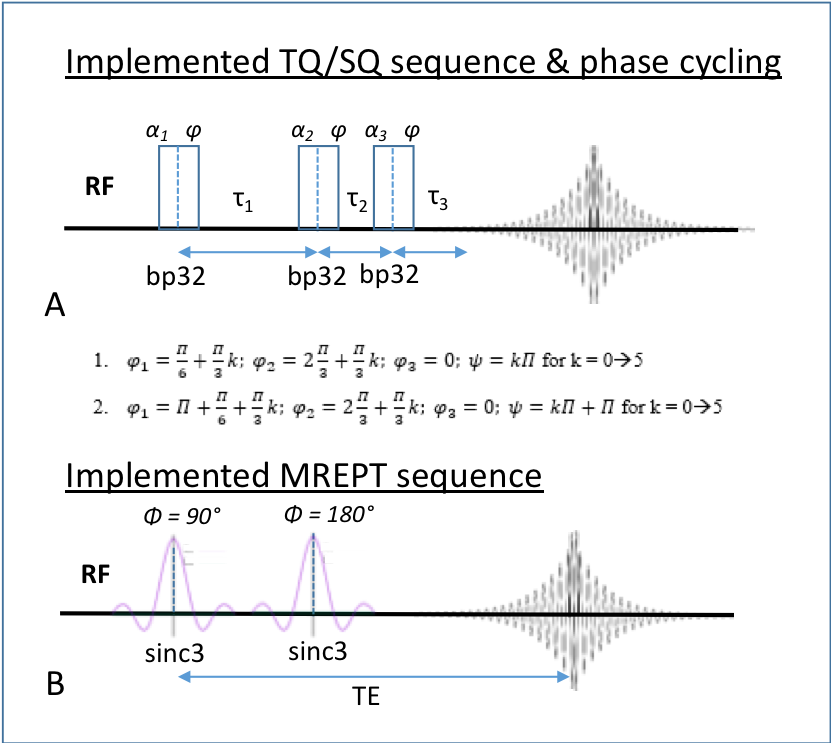
MR protocol: All data was acquired at the US National High Magnetic Field Laboratory using a 21.1-T ultra-wide bore magnet and double-tuned 1H/23Na birdcage coil. 23Na TQ images were acquired using a modified gradient recalled echo (GE-TQ) (Fig. 1), with a three-pulse coherence transfer technique that employs a modified 12-phase cycling scheme for B0 correction (5,6). The three excitation pulses, flip angle α1,2,3 were set to 90° with τ1=7.5 ms, τ2=10 ms and τ3=0.18 ms to maximize signal. For a FOV of 6.4x 6.4x 3.2 cm3, BW = 130 Hz/pixel and TR =105 ms, TQ images were acquired with an isotropic resolution of (2 mm)3 over an acquisition time of 20 min. A SQ dataset also was acquired with the same parameters but a standard DC and quadrature correction phase cycling scheme. For EPT, three spin-echo (SE) scans were acquired with a TE/TR=15/2000 ms, resolution of 0.13x 0.13x 1 mm3 and seven slices. B1+ phase was measured from the SE image phase with a 90° flip while the magnitude B1+ map was constructed using a double angle method (7) .
Data Analysis: TQ data was acquired as a full echo and reconstructed offline using a custom MATLAB script. Acquisition matrices were zero-filled and reconstructed to 1-mm isotropic resolution; no other filtering was performed. SQ/TQ maps and expected free/bound sodium concentration were generated according to (8). Conductivity maps were reconstructed using Full-form Helmholtz-based EPT (9,10). Phase unwrapping and smoothing were included in post-processing of the phase. Mean conductivity and standard deviation were calculated from regions of interest (ROI) inside each phantom tube and averaged over five middle slices.
Results and Discussion
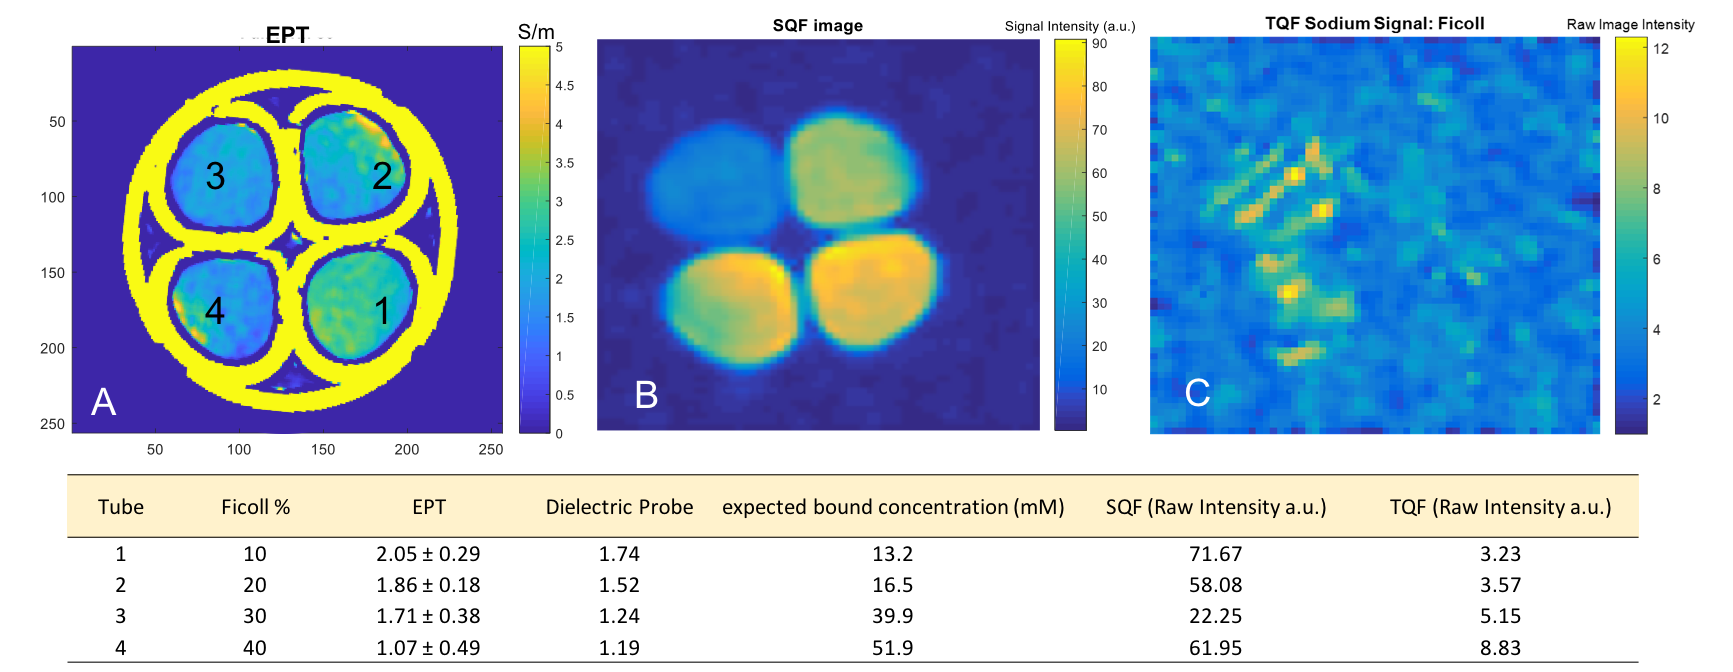
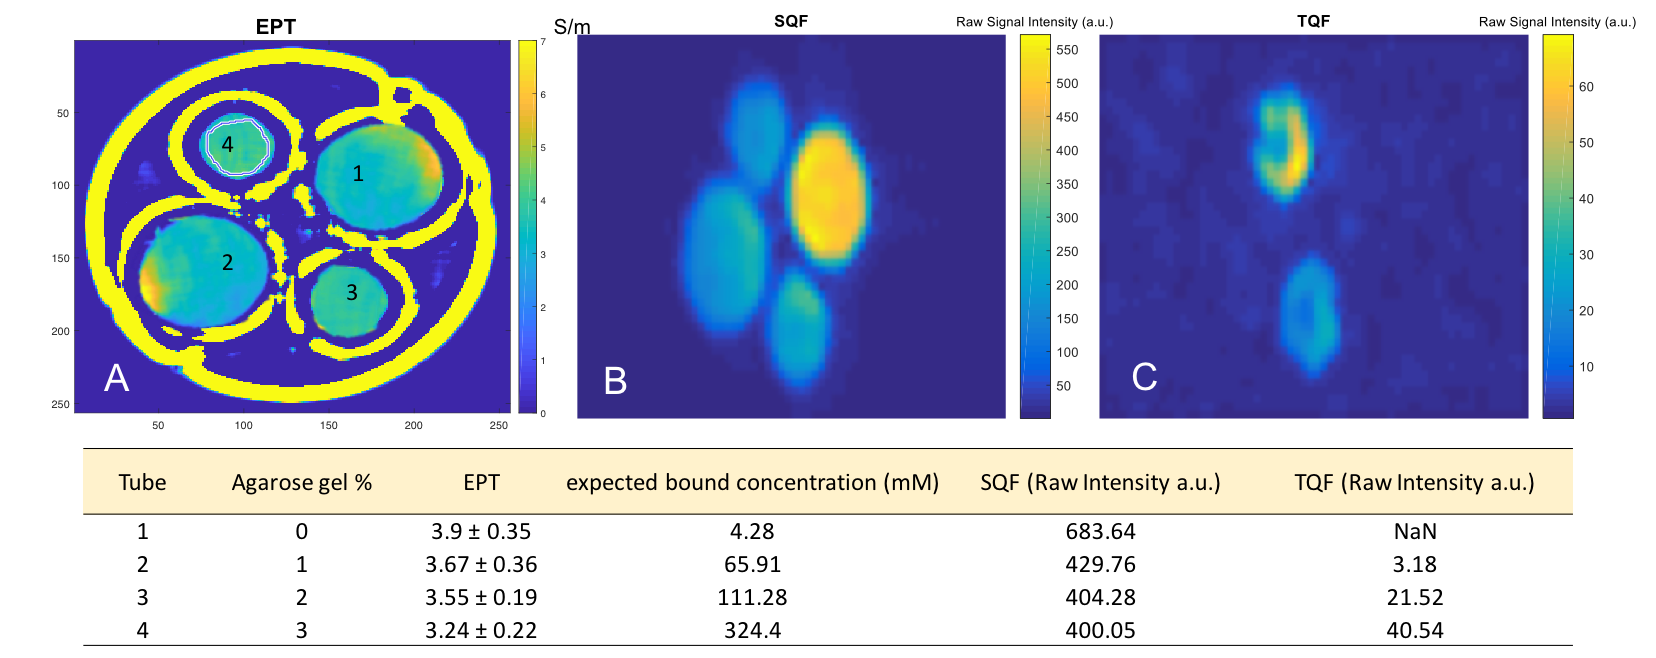
Conductivity maps and the corresponding SQ and TQ sodium maps are
presented in Figs. 2 & 3 for the Ficoll and agarose phantoms, respectively.
Figs. 2 & 3 also tabulate conductivity values, showing decreases with
higher percentages of Ficoll & agarose and indicative of sensitivity to binding/bound
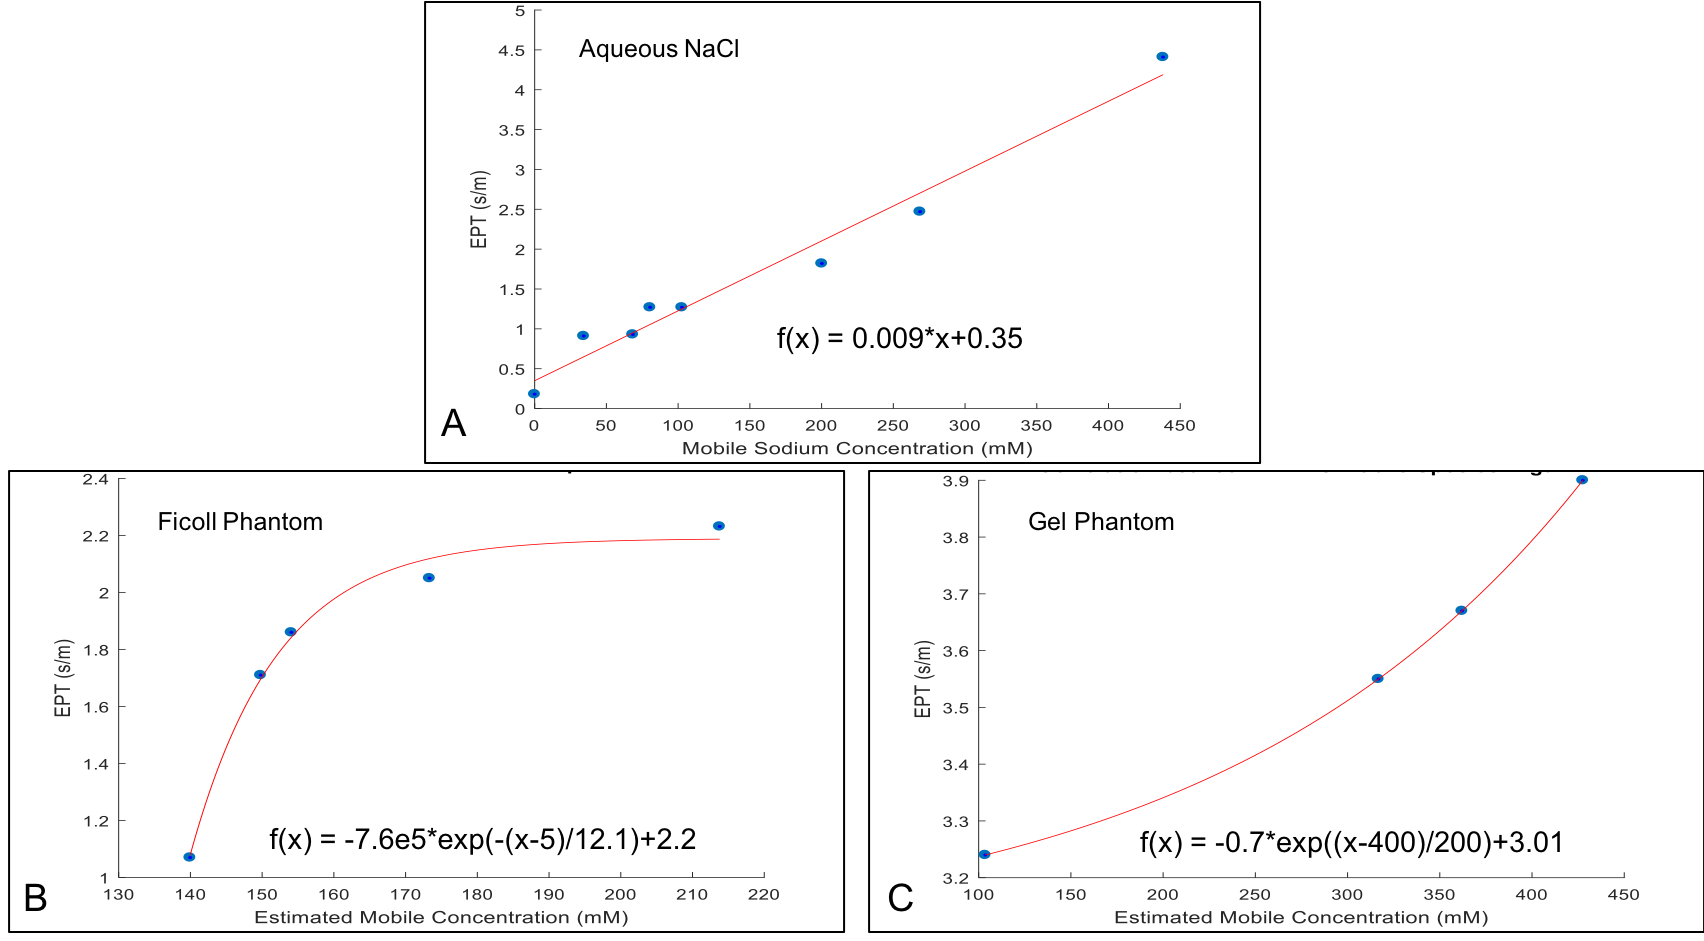
Na+. Conductivity and sodium concentration are linear in the bulk
solution calibration standard (Fig. 4A), but are non-linear for the Ficoll and
agarose phantoms (Fig. 4B-C), with strikingly different trends dependent on the
specificity of binding for the phantoms. Conclusion
This pilot study confirms the
assumption that conductivity is affected both by Na+ concentration,
mobility and specificity of binding. Of these, mobility (bulk versus bound Na+)
appears to have a significant impact, with binding affinity modulating the
conductivity response in a fashion similar to saturation kinetics. EPT-based conductivity
in tissue, which is highly heterogeneous, likely also follows a similar
relationship, with mobile ions dominating the measurement but modified by
binding and the specificity of that binding. The modeling and ramifications of
these impacts for interpreting normal and pathological tissue with EPT will be
discussed.Acknowledgements
This work was supported by the NIH (R01-NS102395) and National Science Foundation (DMR-1644779) through the National High Magnetic Field Laboratory and NHMFL User Collaboration Grants Program (to SCG).References
1. Madelin G, Regatte RR. Biomedical applications of sodium MRI in vivo. J. Magn. Reson. Imaging 2013;38:511–29.
2. Katscher U, van den Berg CAT. Electric properties tomography: Biochemical, physical and technical background, evaluation and clinical applications. NMR Biomed. 2017:1–15.
3. Zhang X, Liu J, He B. Magnetic-resonance-based electrical properties tomography: a review. IEEE Rev. Biomed. Eng. 2014;7:87–96.
4. Whang J, Katz J, Boxt LM, Reagan K, Sorce DJ, Sciacca RR, Cannon PJ. Multiple-Quantum-Filtered NMR Determination of Equilibrium Magnetization for 23Na Quantitation in Model Phantoms. J. Magn. Reson. Ser. B 1994;103:175–179.
5. Fleysher L, Oesingmann N, Inglese M. B₀ inhomogeneity-insensitive triple-quantum-filtered sodium imaging using a 12-step phase-cycling scheme. NMR Biomed. 2010;23:1191–8.
6. Tanase C, Boada FE. Triple-quantum-filtered imaging of sodium in presence of B0 inhomogeneities. J. Magn. Reson. 2005;174:270–278.
7. Cunningham CH, Pauly JM, Nayak KS. Saturated double-angle method for rapid B1+ mapping. Magn. Reson. Med. 2006;55:1326–1333.
8. Fleysher L, Oesingmann N, Brown R, Sodickson DK, Wiggins GC, Inglese M. Noninvasive quantification of intracellular sodium in human brain using ultrahigh-field MRI. NMR Biomed. 2013;26:9–19.
9. Van Lier ALHMW, Raaijmakers A, Voigt T, Lagendijk JJW, Luijten PR, Katscher U, Van Der Berg CAT. Electrical properties tomography in the human brain at 1.5, 3, and 7T: A comparison study. Magn. Reson. Med. 2014;71:354–363.
10. Amouzandeh G, Rosenberg
JT, Mentink-vigier F, Abad N, Grant SC. Evaluating Validity of MREPT
Assumptions for 21 . 1 T. Proc. 25th Annu. Meet. ISMRM 2018. 5088
.
Figures