5044
Multiple TR Approach for Direct Detection of Fast Oscillating Magnetic Fields1Department of Bio and Brain Engineering, Korea Advanced Institute of Science and Technology, Daejeon, Korea, Republic of
Synopsis
Due to weak amplitude and fast oscillation, it is still controversial whether neuronal activities can be directly detected through MR imaging. In this study, we propose a novel method, multiple‑TR approach, which utilized 1) multi-phase acquisition and 2) frequency spectrum multiplication for detecting weak and fast oscillating magnetic fields. We demonstrated with phantom experiments that SNR at the stimulation frequency on the spectrum was remarkably enhanced with the higher number of TRs under almost the same scan time, amplifying oscillation frequency component while suppressing systematic noises. This proposed approach will increase possibility of directly detecting neural oscillations in vivo.
Introduction
For observing neuronal activities, various non-invasive neuroimaging tools have been developed such as electroencephalography (EEG), magnetoencephalography (MEG), and functional MRI (fMRI). However, EEG has limitation in spatial resolution1 and MEG has poor source localization problem2, and fMRI using blood oxygenation level dependent (BOLD) measures secondary hemodynamic responses to infer neural activity3. In order to overcome these limitations, many researchers developed plenty of methods for directly detecting neuronal activity using MRI4,5. However, it is still in debate due to weak amplitude (order of 1nT) and fast oscillation (1~100Hz) which goes beyond the sensitivity and temporal resolution of MRI6,7. In this work, we proposed a new multiple time-to-repeat (TR) analysis approach, which extended the previous two-TR approach8 to data acquisition with higher number of TRs. The feasibility and advantage of the proposed multi-TR strategy were investigated with phantom experiments and the results were compared with those of the two-TR method.Materials & Methods
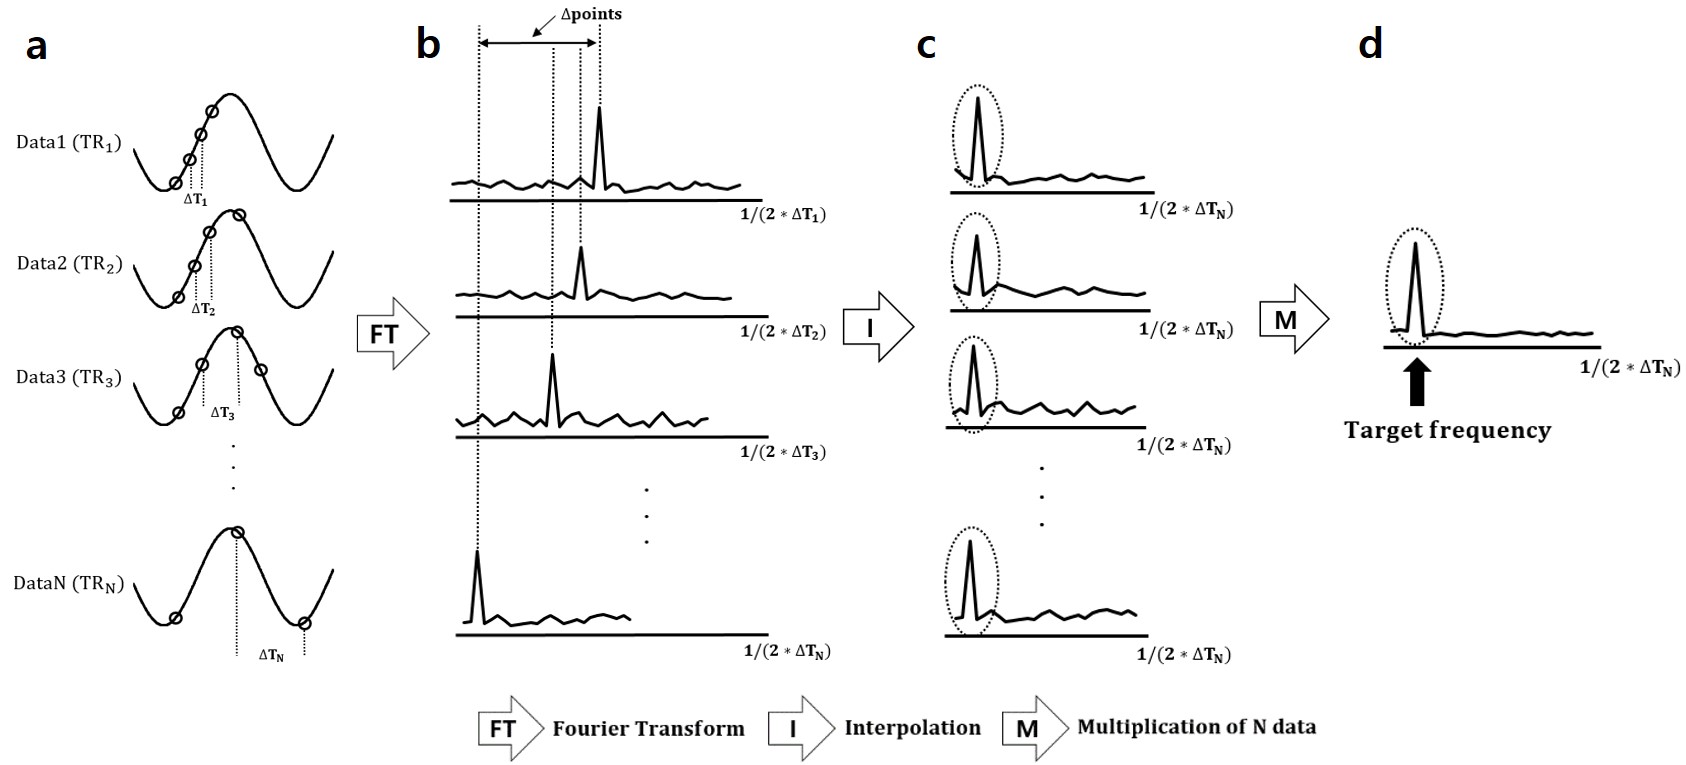
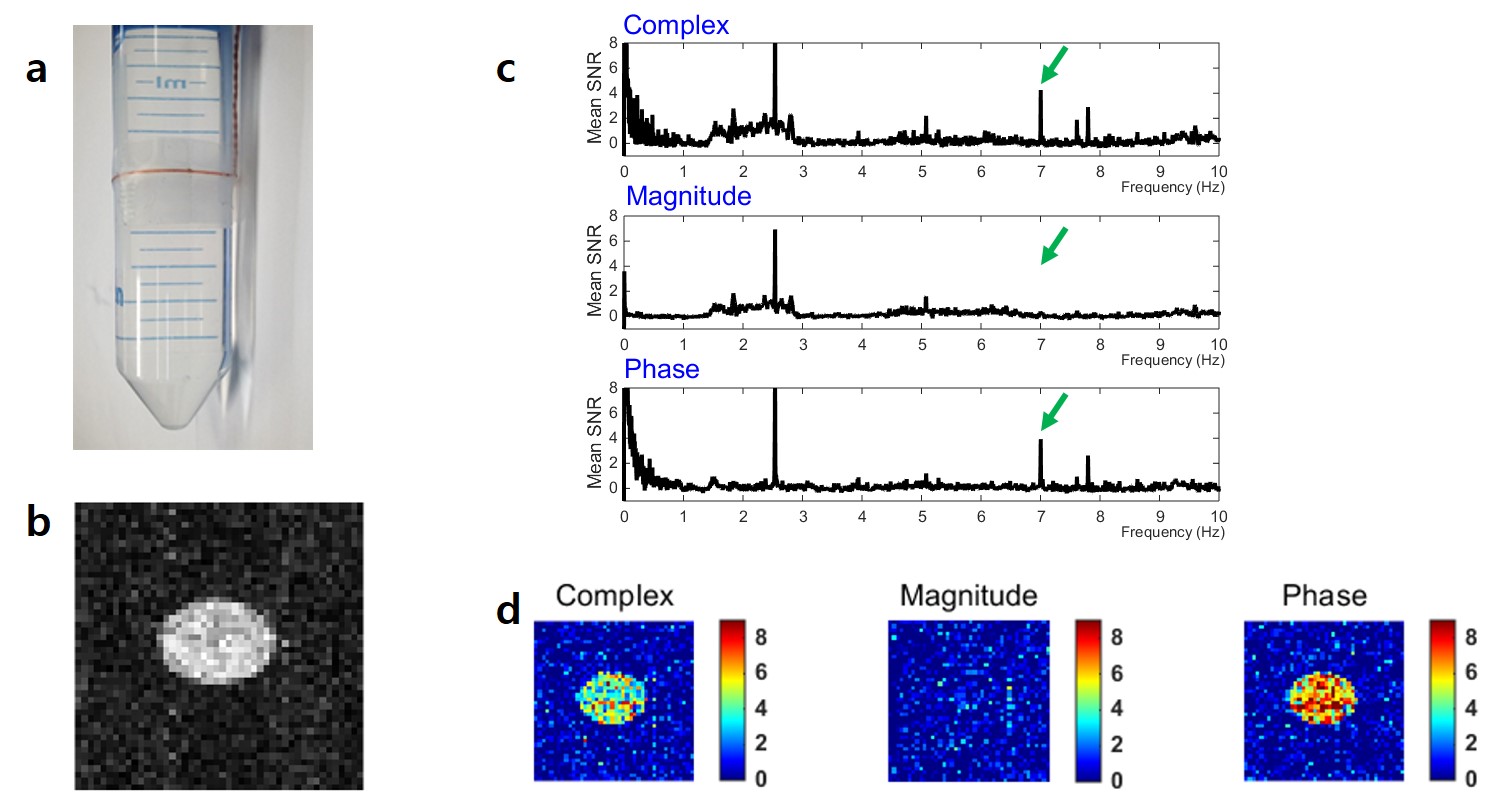
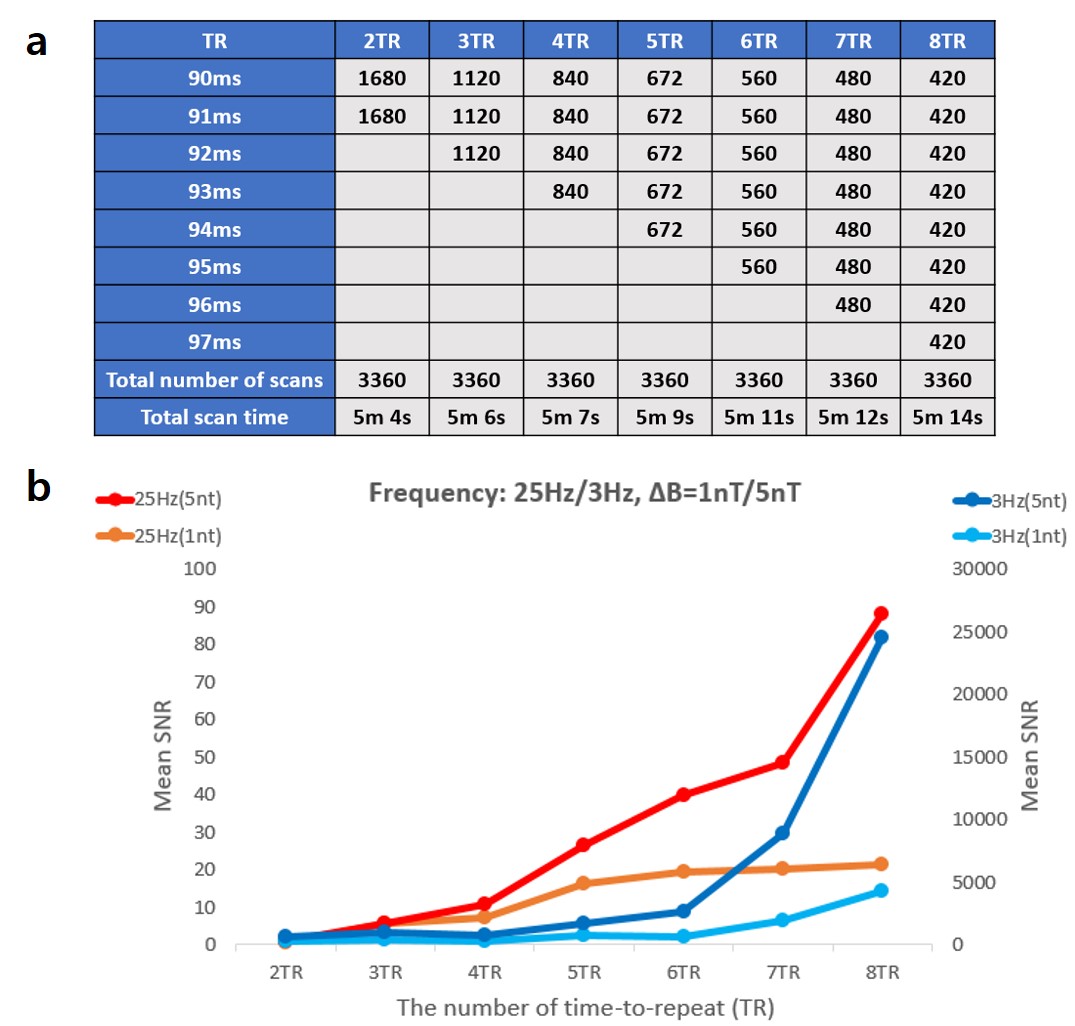
All experiments were performed on a 3 Tesla MRS 3000 scanner (MR solutions) and data were analyzed with MATLAB (The Mathworks, USA). The single-shot gradient-echo echo-planar imaging (GE-EPI) sequence was used for fast imaging and the scan parameters were as follows: FOV= 50×50 mm2, matrix= 64×64, flip angle= 10°, TE= 20ms, TR= 90, 91, 92, 93, 94, 95, 96, and 97 ms (total 8 TRs). A 26-gauge copper wire was wound around a phantom tube filled with distilled water and electrical stimulation was given with specific frequencies to form the oscillating magnetic field within the current loop (Fig. 2a,b). Phantom experiments were conducted with two different amplitudes of magnetic field calculated by Biot-Savart law (1nT/5nT) and two different stimulation frequencies (3Hz/25Hz). For multiple-TR analysis, the data acquired with eight different TRs were resampled with new sampling periods(Tsamp) which can be calculated by difference between the period of stimulation frequency(Tstim) and MRI temporal resolution (Tsamp=TR-n×Tstim, n is interger). The resampled data could be pixel-by-pixel 1-D Fourier transformed along dynamic scans with the range of [-1/(2Tsamp), 1/(2Tsamp)]. The linear interpolations were performed on the remaining seven frequency spectra based on the longest Tsamp spectrum to match the position of stimulation frequencies. By multiplying these eight frequency spectra, the amplitude of stimulation components is strengthened while the amplitudes of systematic noise components are suppressed so that pronounced peak can be obtained at the stimulation frequency (Fig. 1). For an obvious comparison between the two-TR analysis and the proposed multiple TR analysis, the total number of dynamic scans (i.e., total scan time) remained the same (Fig. 4a). The signal-to-noise ratio (SNR) was calculated from ROI-average absolute frequency spectrum formed by each multiple TR multiplication data. It was also analyzed by different number of dynamic scans and various frequencies (7Hz, 17Hz, 25Hz) on eight-TR analysis.
Results
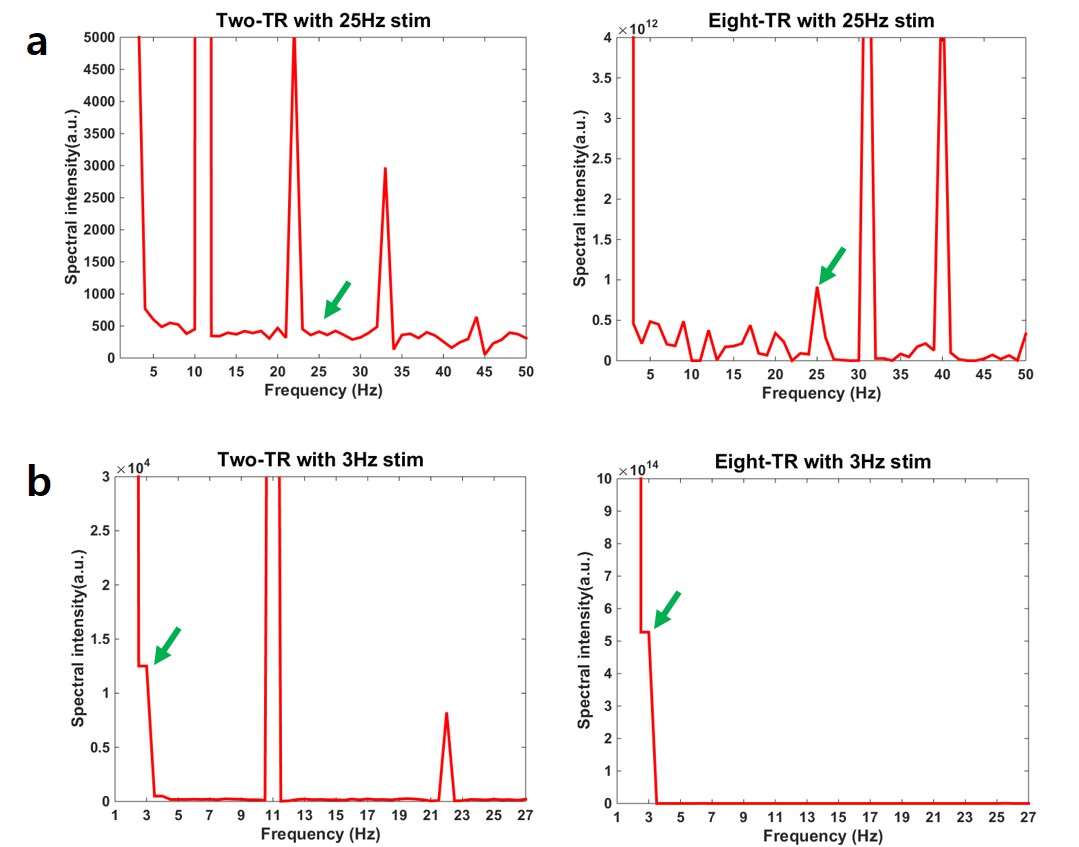
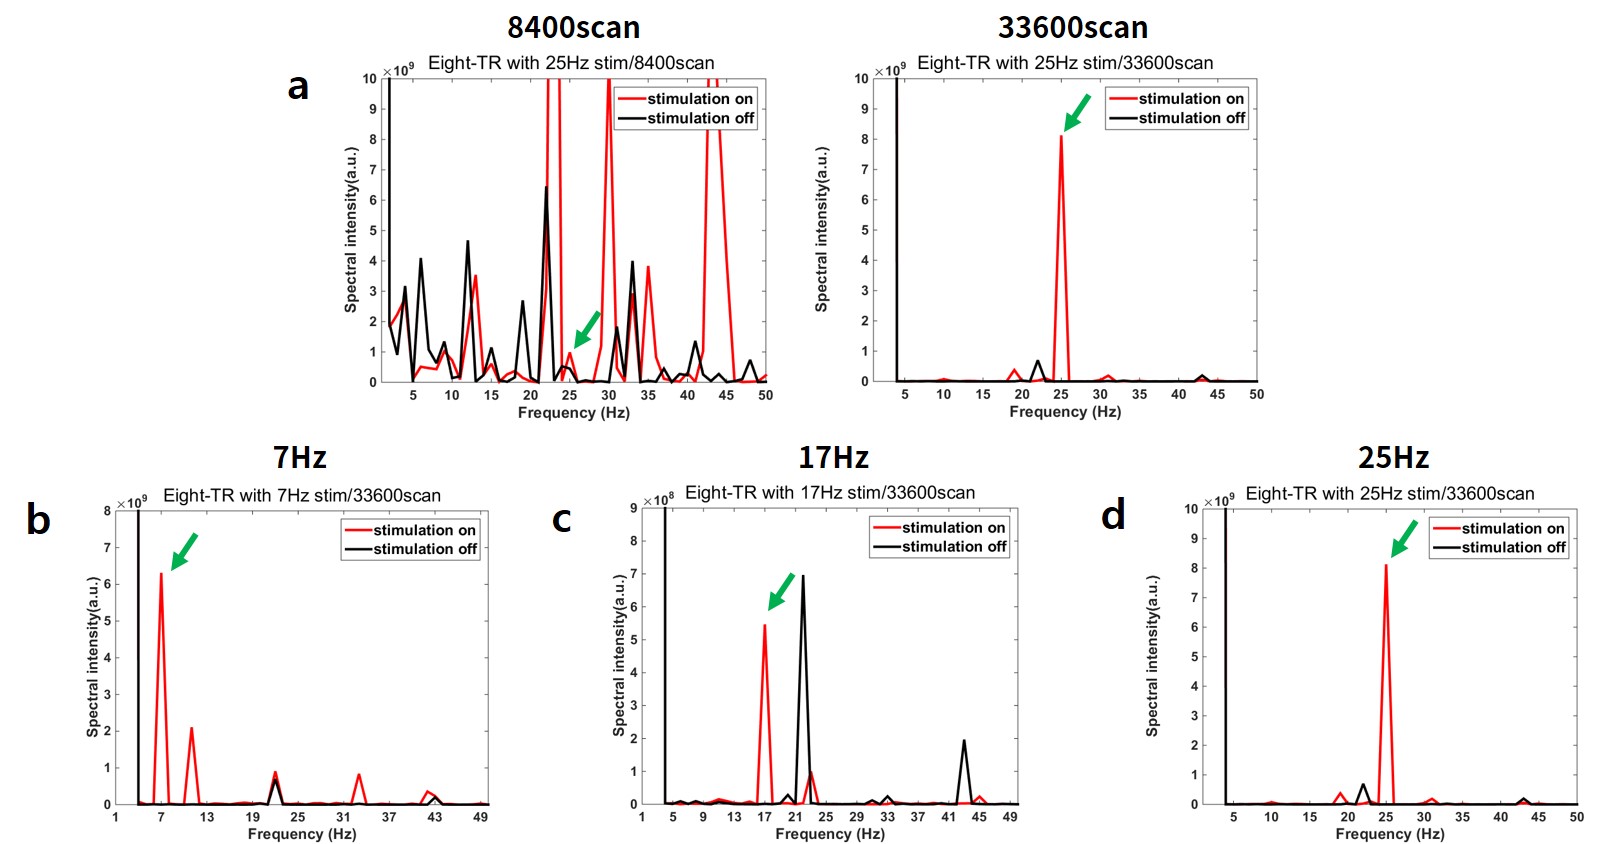
The stimulation frequency peak of the mean SNR spectrum appeared only in the complex and phase domain, but not in the magnitude domain. The spatial mapping of target frequency was entirely localized within the current loop region (Fig. 2c,d). Compared to the two-TR approach, the eight-TR approach showed the stimulation frequency components (3Hz/25Hz) more clearly distinguished since the amplitude of the peak intensity increased while the noise frequencies were further suppressed (Fig. 3). As the number of TRs and the amplitude of oscillating magnetic field increased, the SNR increased significantly (Fig. 4b). At 5nT/25Hz, which showed the biggest improvement, the SNR on eight-TR spectrum increased by nearly 170 times compared to the two-TR spectrum despite the same number of total dynamic scan (i.e. almost the same scan time). It was confirmed that the peak of the target frequency, 25Hz, could be discriminated clearly from the other frequency components by higher number of dynamic scans on eight-TR analysis, which was the optimal number of TRs under our experimental conditions (Fig. 5a). The stimulation frequency component was also accurately detected in reference to no stimulation data regardless of stimulation frequency values (7Hz, 17Hz, 25Hz) on multiple TR spectrum with large number of dynamic scans (Fig. 5b,c,d).Discussion & Conclusion
The proposed multiple‑TR approach could clearly detect signals at the oscillating magnetic fields irrespective of target frequency, although the corresponding signals in the single‑TR spectrum were very low or undetectable. This might be because components at the stimulation frequencies are located at the same position on the interpolated multiple TR spectra and are repeatedly amplified by multiplication. Also, the noise components were further suppressed by multiplication so that the target frequency could be distinguished definitely. In conclusion, this proposed approach would reinforce the detectability of weak and fast neuronal oscillations with higher number of TRs and dynamic scans.Acknowledgements
No acknowledgement found.References
1. Michel CM et al. Localization of the sources of EEG delta, theta, alpha and beta frequency bands using the FFT dipole approximation. Electroencephalogr Clin Neurophysiol, 1992;81(1):38-44.
2. Hamalaien M et al. Magnetoencephalography-theory, instrumentation, and applications to noninvasive studies of the working human brain. Rev Mod Phys, 1993;65(2):413-97.
3.Duyn et al. Inflow versus deoxyhemoglobin effects in BOLD functional MRI using gradient echoes at 1.5T. NMR Biomed. 1994;7(1-2):83-8.
4. Bodurka J et al. Toward direct mapping of neuronal activity: MRI detection of ultraweak, transient magnetic field changes. Magn Reson Med. 2002; 47(6):1052-8.
5. Chow LS et al. Investigation of MR signal modulation due to magnetic fields from neuronal currents in the adult human optic nerve and visual cortex. Magn Reson Imaging. 2006;24(6):681-91.
6. Chu R et al. Hunting for neuronal currents: absence of rapid MRI signal changes during visual-evoked response. Neuroimage. 2004;23(3):1059-67.
7. Parkes LM et al. Inability to directly detect magnetic field changes associated with neuronal activity. Magn Reson Med. 2007;57(2):411-6.
8. KH Kim et al. Detection of fast oscillating magnetic fields using dynamic multiple TR imaging and fourier analysis, PLOS One, 2018; 13(1):e0189916.
Figures