5041
Using multi-bolus injection protocol to improve the robustness of DCE-MRI: application in rabbit liver1Paris Cardiovascular Research Center (PARCC), Paris, France, 2Paris Descartes University, Paris, France, 3Plateforme d'Imagerie du Vivant de Paris Descartes, Paris, France, 4Hospital Europeen G.Pompidou (HEGP)-APHP, Paris, France
Synopsis
Quantitative DCE-MRI suffers from limitations in the liver due to its dual input (hepatic artery, portal vein). Single- and multi-bolus (four) injection protocols were performed in rabbits on a 4.7T small-animal MRI. The Hepatic Perfusion Index (HPI), total hepatic blood flow (F), and distribution volume (Vd) were studied using a computer simulation and evaluated by the Coefficient of Variation (CV) and the 95% Confidence Interval (CI) factors. Statistical tests were performed for 1000 iterations with Mann-Whitney test and p<0.002 statistically significant. Multi-bolus injection protocol strongly
INTRODUCTION
In the liver, due to the dual blood supply (hepatic artery, portal vein), a dual-input compartment model is commonly used with DCE imaging to estimate the pharmacokinetic parameters. The measurement robustness of these parameters, especially the hepatic perfusion index (HPI), which represent the ratio of the arterial hepatic perfusion part over the total hepatic perfusion, is however limited in vivo due to poor signal to noise ratio (S/N) and motion artifacts in the images. The use of a large bolus of gadolinium chelate, in order to increase the S/N raises even more difficulties, by introducing signal saturation in high contrast-agent concentrations. We propose a strategy to improve the robustness of liver DCE-MRI and limit the effects of high concentration during the first pass of contrast agent, by using a multi-bolus injection protocol with a low amount of Gd in each bolus. This strategy increases the statistical power of the analysis, limiting the data mis-sampling with a minimal signal saturation effect.METHOD
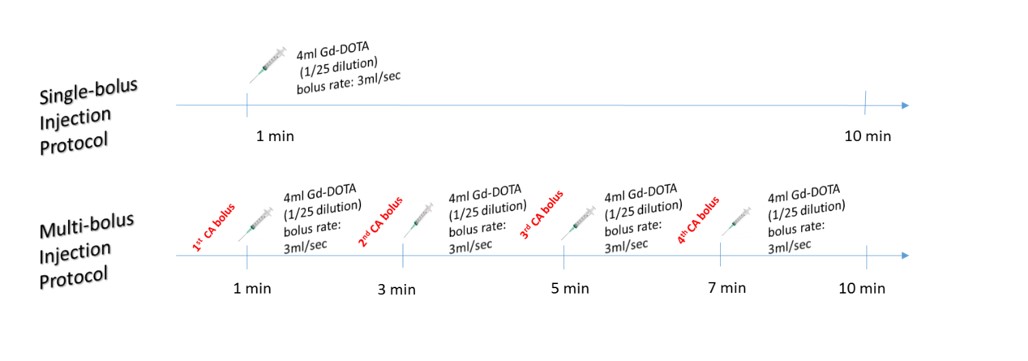
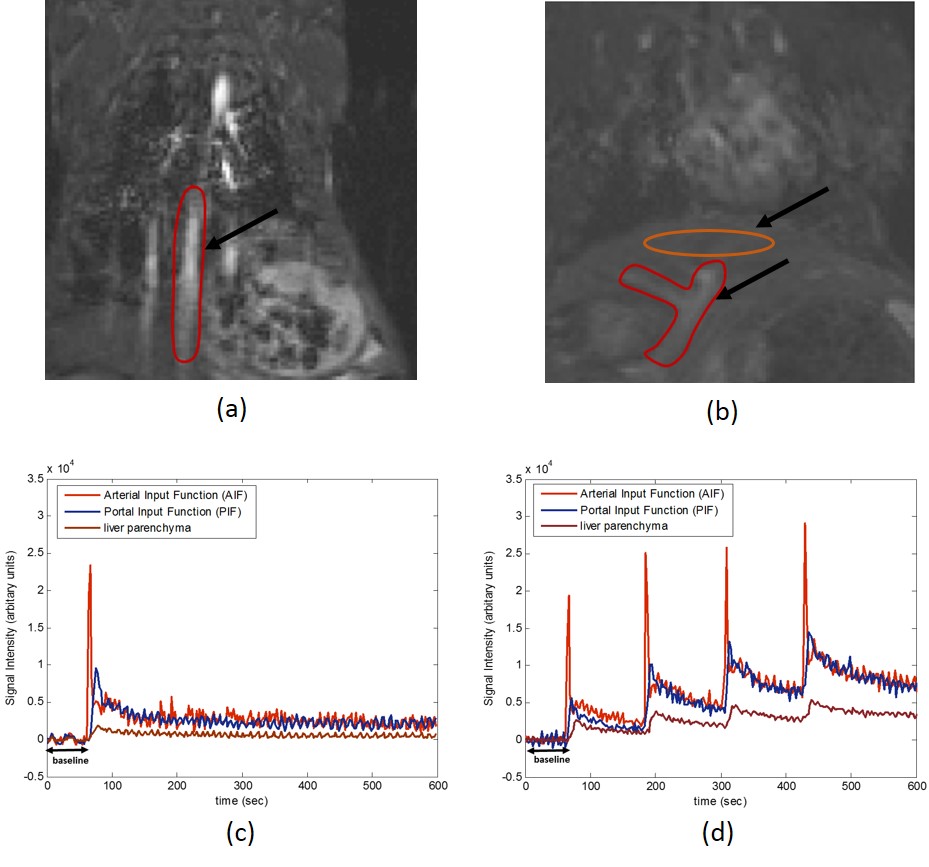
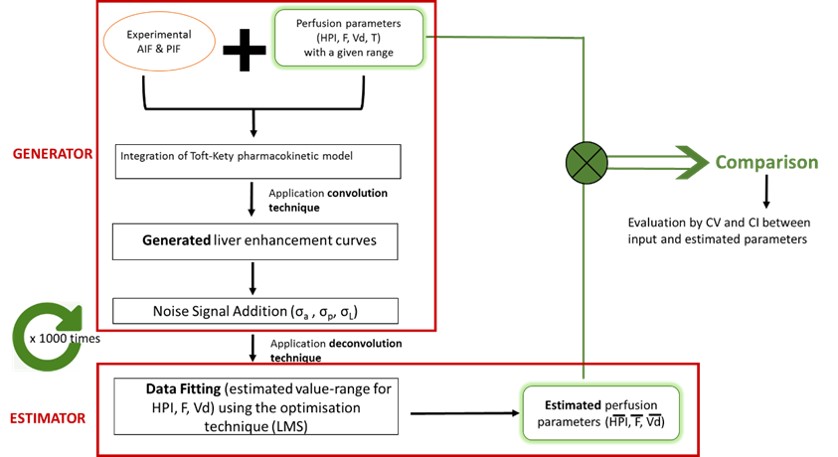
The multi-bolus strategy was evaluated in a simulation challenge. Two different bolus-injection protocols (single- and multi-bolus) (Figure 1) were performed in rabbits on a 4.7T small-animal MRI scanner. Time-intensity curves were extracted by drawing ROI over the abdominal aorta, portal vein and liver parenchyma (Figure 2). A computer simulation was used to generate liver enhancement curves using: (1) a range of perfusion parameters in line with the literature, including Hepatic Perfusion Index (HPI), total liver blood flow (Ft), distribution volume (Vd) and T (time delay), and (2) the experimental enhancement curves measured in the hepatic artery (AIF) and the portal vein (PIF) from both bolus-injection protocols as inputs following a one-compartment pharmacokinetic model, as previously reported 1,2. A set of simulated tumor enhancement curves was also generated using a range of perfusion parameters in line with the liver tumors. Random noise was added to the generated liver enhancement curves. Then a deconvolution algorithm was applied to the simulated curves to estimate the original perfusion parameters (Figure 3). To evaluate the accuracy of the estimated perfusion parameters the Coefficient of Variation (CV=SD/mean) and the 95% Confidence Interval (CI=mean±1.96*SD/√N) were calculated for 1000 simulations. Standard deviations (SD) were measured for the difference between the input perfusion values and the estimated ones for each parameter. Statistical results were quoted by a Mann-Whitney test and a p-value ≤ 0.002 was considered statistically significant by including Bonferroni multi-test correction.RESULTS
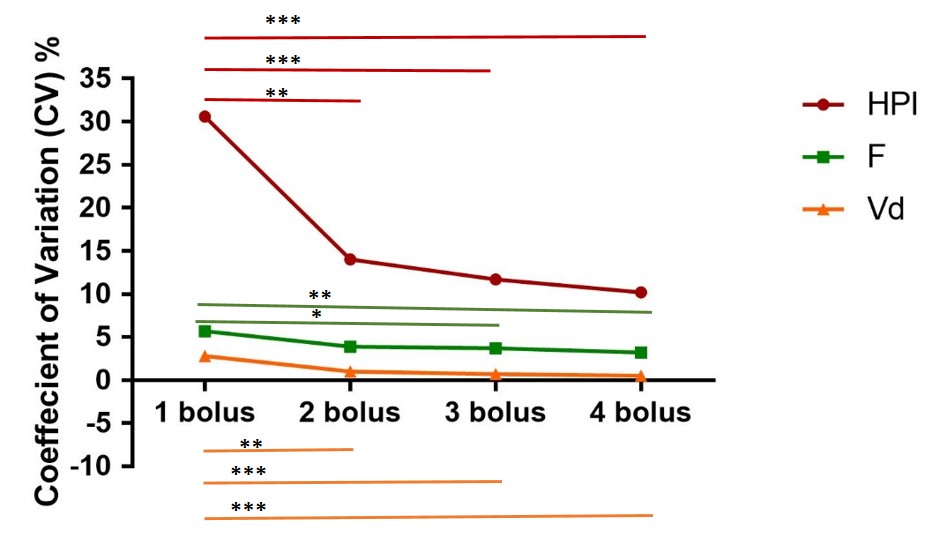
The variation of the estimated perfusion parameters is depicted in Figure 4. CV was 36%, 6.7% and 3.5% for HPI, F, and Vd respectively for the single-bolus injection, and 14.2%, 4.2%, 0.7% for the 4-bolus injection. Corresponding to CV decreases for the 4-bolus versus single-bolus injection by 60.6%, 37.3%, 80.0%. The improvement of the HPI robustness was already significant (p=10-4) from the second-bolus injection.
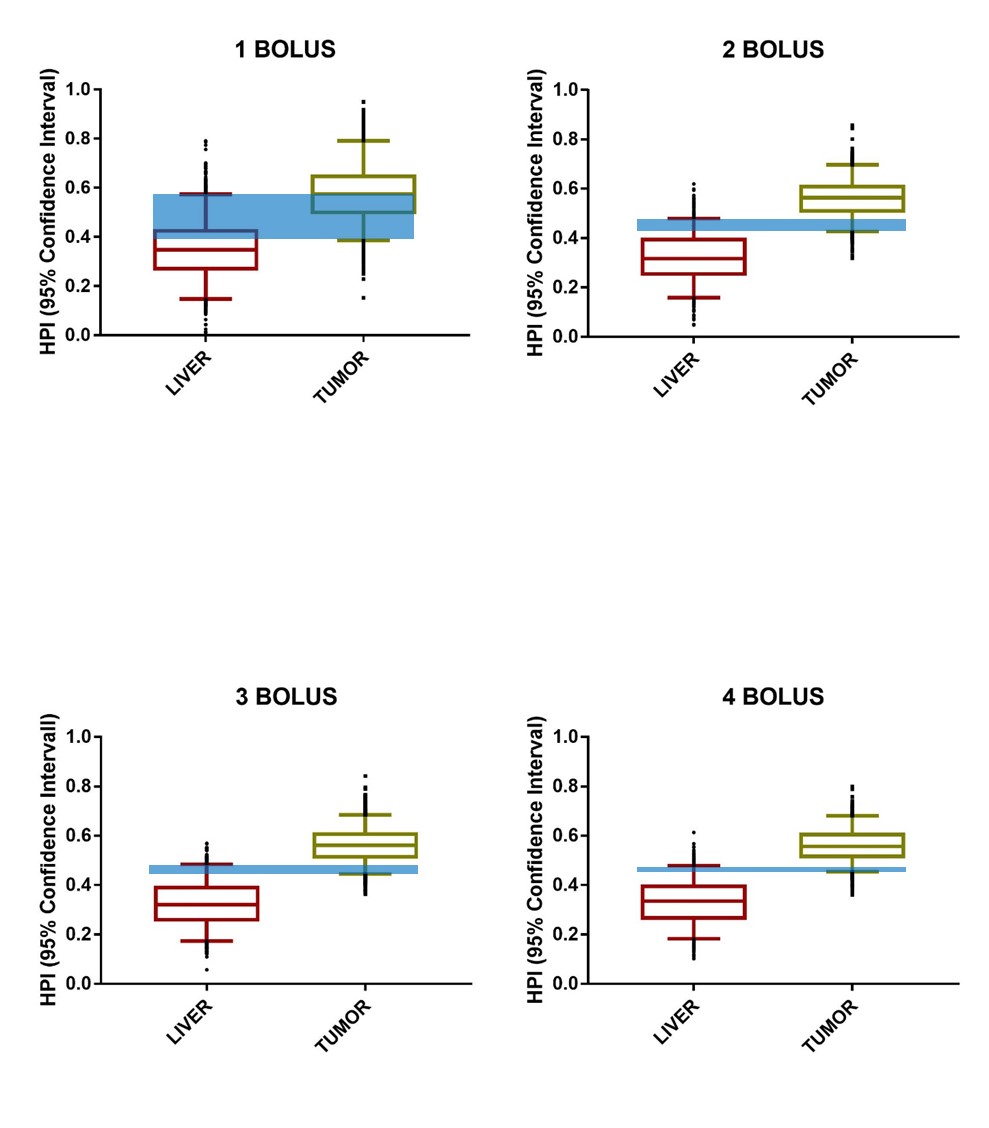
The impact in terms of tissue separation by the HPI values is illustrated in Figure 5, with an overlap of 95% CI decreased by 18.2%, 5.2%, 3.6%, 2.5% for single-bolus, 2-bolus, 3-bolus, 4-bolus injections, respectively.
DISCUSSION
CV was improved to all perfusion parameters performing multi-bolus injections. F and Vd were proved robust parameters (CV≤ 6%) even for a single-bolus injection protocol. A remarkable improvement was noted for HPI as its variability was 36% in the single-bolus injection and fell to 14% with the four bolus injection protocol. Thus, the evaluation of HPI becomes more realistic by using a multi-bolus strategy, and taking into consideration the improvement in HPI discrimination illustrated by a reduction of the confidence interval. The values of CV and their derived CI should help the investigators to select an adequate number of bolus by including in their decision both the expected difference in parametric values for healthy and pathological tissues and the possible negative biological effects associated to an accumulation of the contrast agent, which could be considered differently for clinical and pre-clinical studies.
CONCLUSION
Our study showed that the performance of a 4 multi-bolus injection protocol improves substantially and significantly the robustness of the liver perfusion parameters’ measurement, especially the critical HPI parameter. Hence, it could be subsequently used to improve the tumor diagnosis and consequently the treatment evaluation.Acknowledgements
No acknowledgement found.References
1. Materne R. Non-invasive quantification of liver perfusion with dynamic computed tomography and a dual-input one-compartmental model. Clin. Sci. Lond. Engl. 1979.2000;99(6):517‑525.
2. Materne R. Assessment of hepatic perfusion parameters with dynamic MRI. Magn. Reson. Med. 2002; 47(1): 135‑142.
Figures