5040
Predicting the rate of stroke evolution in canines using MR-derived time-to-peak perfusion maps1Worcester Polytechnic Institute, Worcester, MA, United States, 2University of Massachusetts Medical School, Worcester, MA, United States, 3Athinoula A. Martinos Center for Biomedical Imaging, Massachusetts General Hospital and Harvard Medical School, Charlestown, MA, United States
Synopsis
Mechanical thrombectomy for the treatment of ischemic stroke shows high rates of recanalization; however, some patients still have poor clinical outcome. The canine large vessel occlusion model has been developed to better understand new treatments. This model has a drawback of inconsistent rates of stroke growth. Here, MRI perfusion based time-to-peak maps were used to predict the rate of infarct growth as validated by ADC-derived maps. Classification of canines into either fast or slow evolvers was reliably shown with this method of analysis, allowing for a better understanding of new therapeutics and potentially for better patient selection for thrombectomy.
Introduction
With the advent of new forms of stroke treatment, the rates of successful recanalization of the primary artery have reached nearly 85% [1]; however, the rates of good clinical outcomes have not yet matched the rate of technical success. Neuroprotection, the idea of ‘freezing’ the penumbra such that a patient has a longer window to receive treatment, has become the next critical topic in stroke care [2]. The canine large vessel occlusion (LVO) model [3] has been recently developed to allow for the assessment of neuroprotectants and other novel therapeutics. A unique aspect of this model is that the rate of stroke evolution tends toward one of two pathways, like human stroke evolution: 1) fast evolution, where more than half of the total stroke volume is present, and 2) slow evolution, where less than half of the total stroke volume occurs, within the first 90 minutes of occlusion. Here we present a novel analysis of MR-based time-to-peak (TTP) maps, derived from perfusion-weighted (PW) MRI, in order to classify the infarct evolution in this model based only on the first PW image.Methods
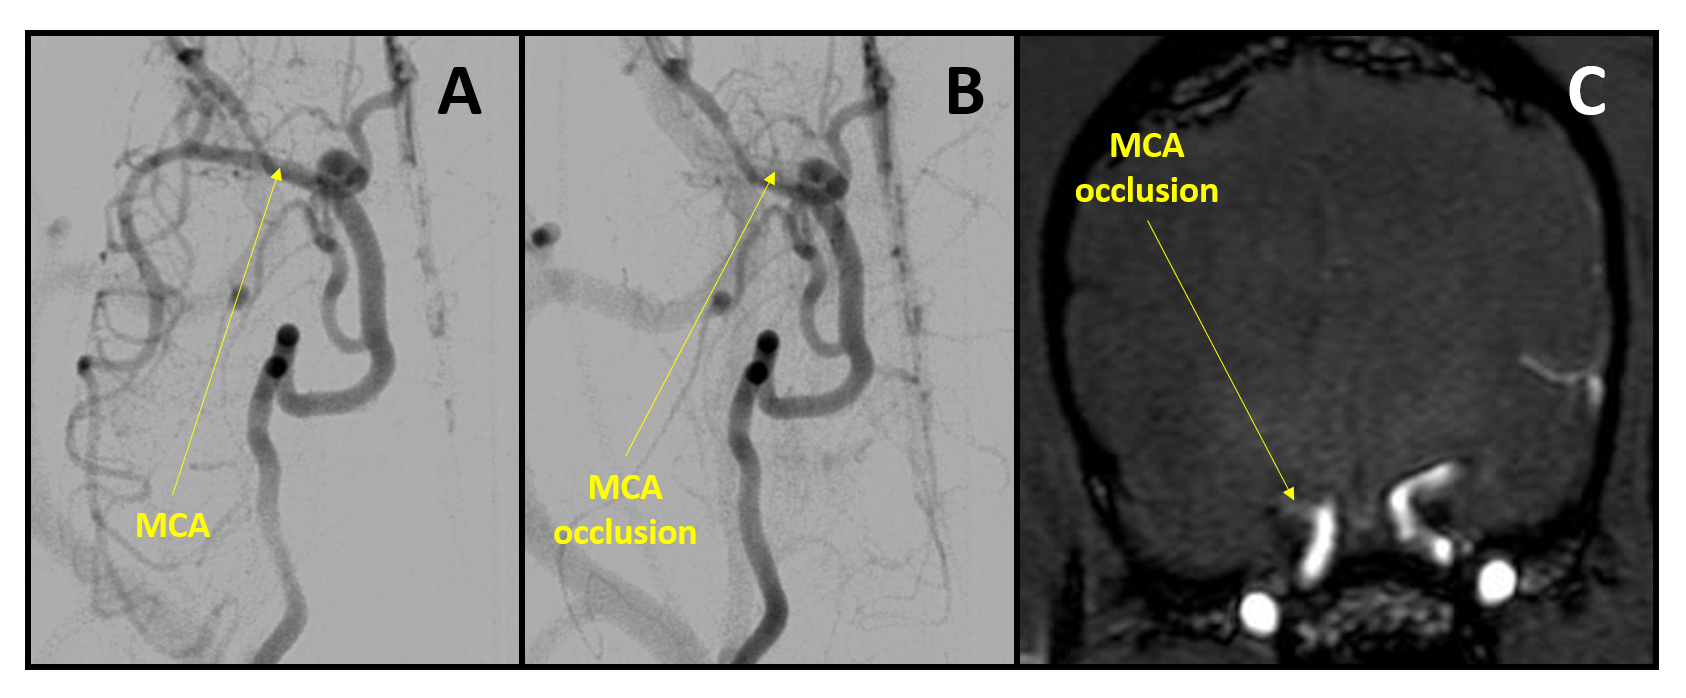
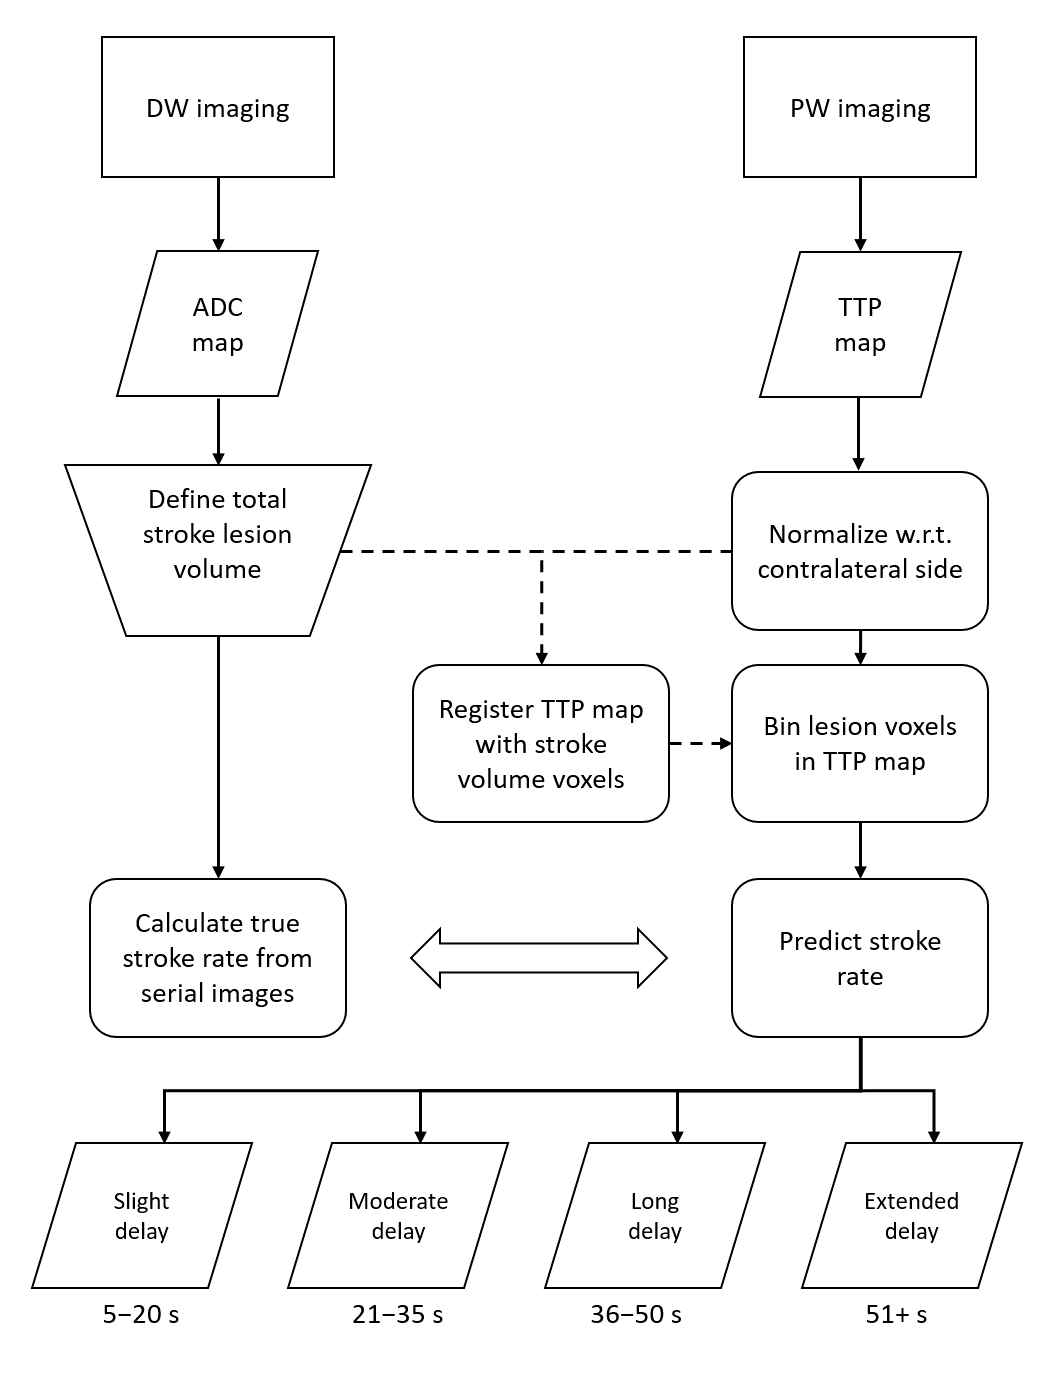
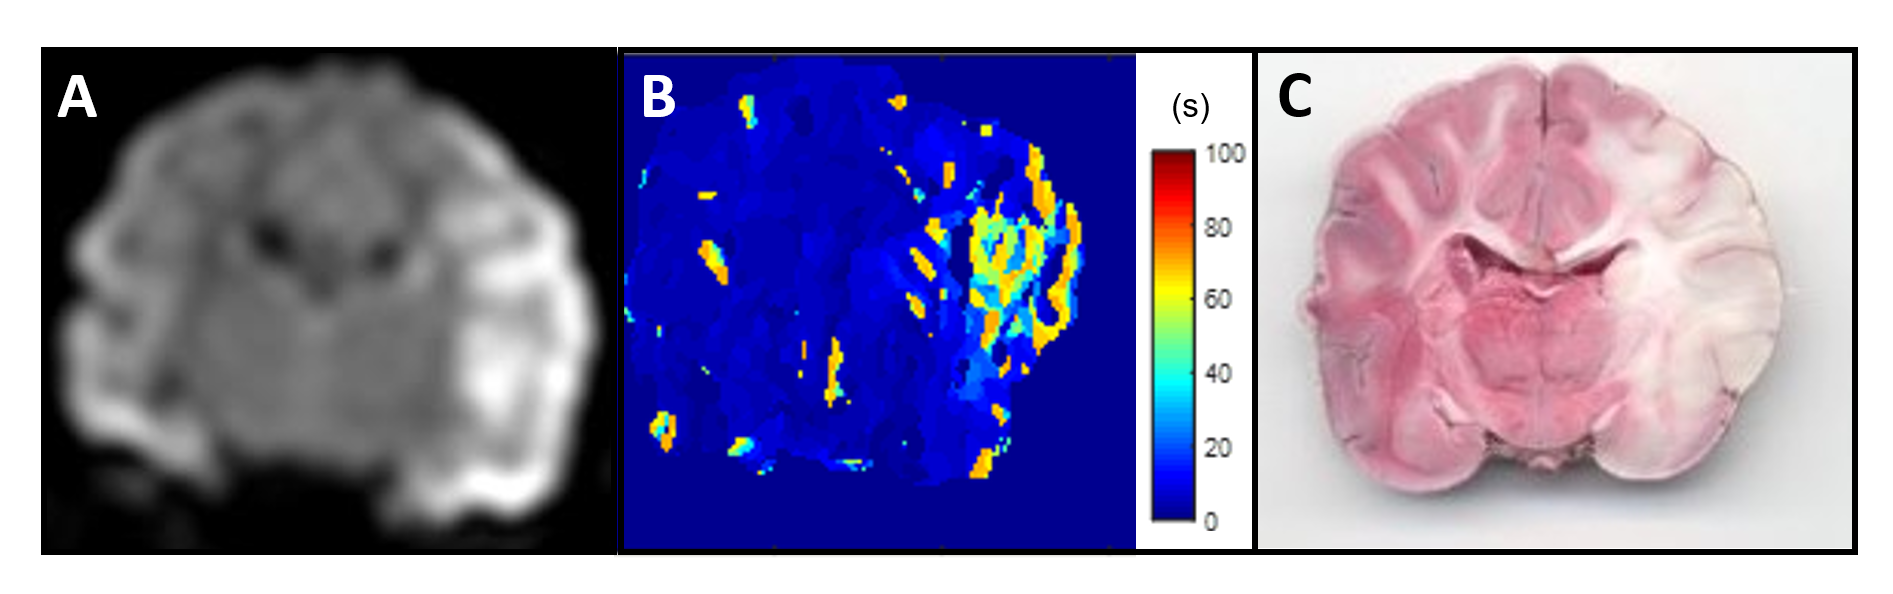
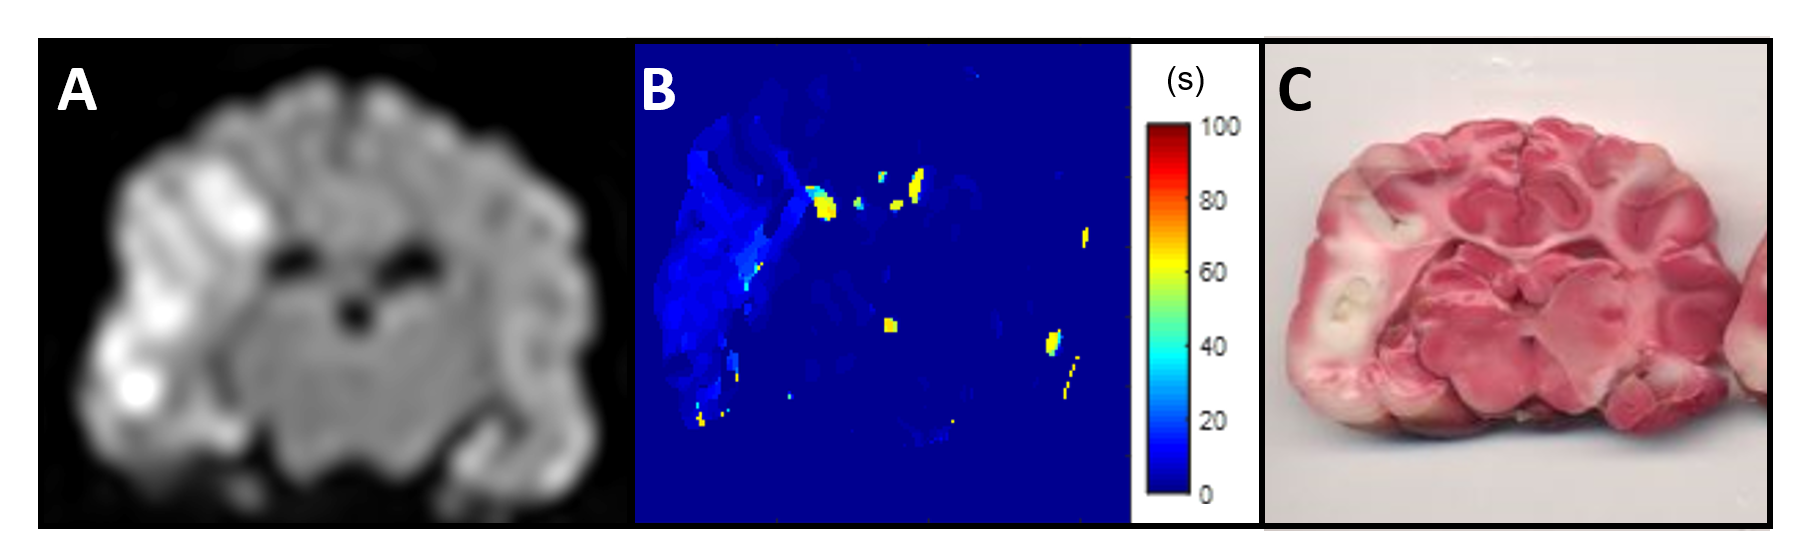
Eleven dogs (6 males and 5 females) were retrospectively analyzed for patterns of stroke evolution. Each animal was anesthetized and arterial access was gained via right femoral artery cutdown. A 6-french Navien-072 catheter was navigated under fluoroscopic guidance to the origin of the right of left internal carotid artery (ICA), at which point an autologous clot was injected and advanced until it occluded the middle cerebral artery (MCA) (Fig. 1). Once the occlusion was confirmed, the animal was imaged using MRI. The imaging protocol included time-of-flight (ToF) (TR/TE 20/4ms, FA = 20o, matrix 332×212), diffusion-weighted (DW)(TR/TE 2600/76ms, FA = 90o, b-values = 0, 1000 s/mm2, NEX = 6, matrix 144×144) and PW (TR/TE 1500/20.1ms, FA = 40o, 60 dynamics, matrix 320x320) imaging. For PW imaging, 0.2 mmol/kg of gadopentetate dimeglumine was injected intravenously (IV) during the 2nd of 60 dynamic scans (90-second total scan time). To calculate the true volume of stroke, ADC maps were generated from the DW images, and it was assumed that the final DW image was the total stroke volume within the animal, which was confirmed by histology. Calculation of TTP maps was done offline using a combination of ImageJ and MATLAB. Details of the image analysis are shown in Fig. 2. The predicted rate of stroke evolution from the TTP maps were compared to the true rate of stroke evolution as measured using serial DW-MRI, where animals with less than 50% of total infarct region within the first 90 minutes was considered a slow evolver. Histology was performed post-mortem using triphenyltetrazolium chloride (TTC) to confirm the size of the brain infarct region.Results and Discussion
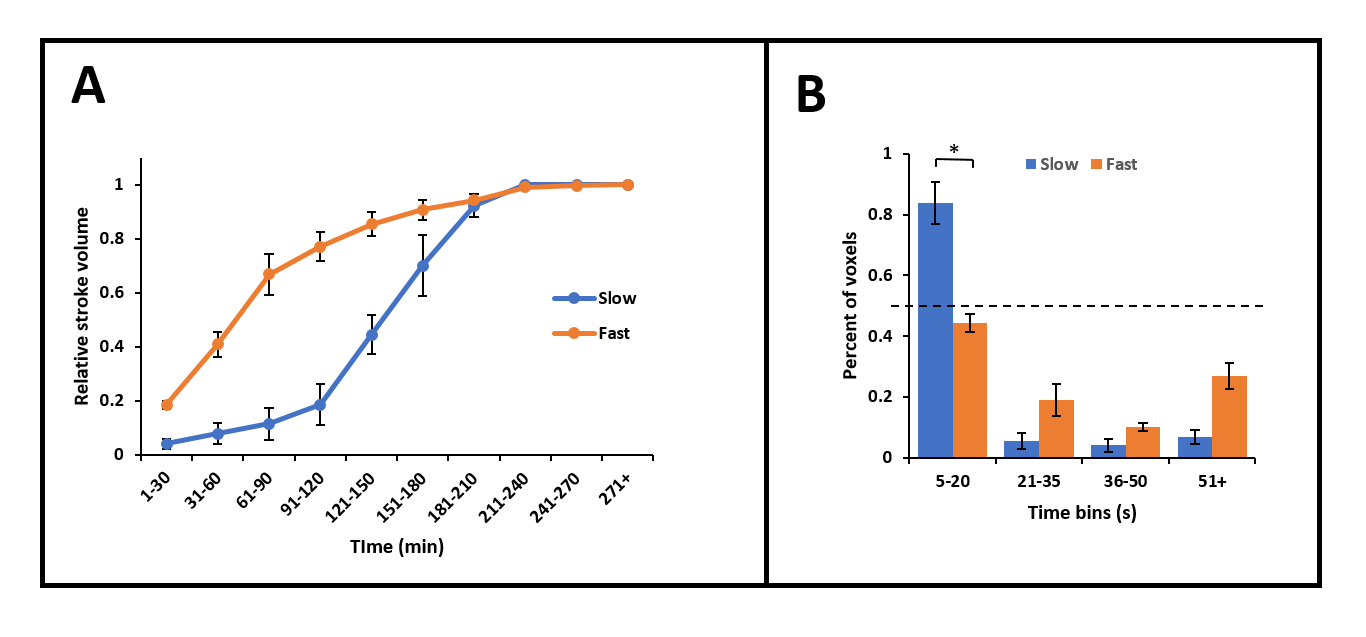
TTP maps have been shown to correlate well with quantitative 15O-water PET images in clinical studies to identify hypoperfusion in acute ischemic stroke [4]. TTP, along with ADC, maps have been widely used to predict infarct size and growth in stroke patients [5-7]. In this study, we expanded the role of TTP maps to predict the rate of stroke evolution in the canine LVO model. The evolution of the DW lesion was plotted from the ADC maps (Fig. 5A) with the fast evolvers showing a constant growth for the first 2 hours, and then plateauing to the final infarct size. The slow evolvers, on the other hand, show a small stroke evolution in the first 2 hours, after which a rapid constant growth occurs until the final infarct size is reached. The animals were categorized into slow and fast evolvers accordingly. Using this categorization, histogram bins for each animal generated from the TTP maps were grouped in either the slow or the fast evolver category (Fig. 5B). The slow evolvers can be seen to contain voxels mostly from the “slight delay” category (5−20s). Based on the relative number of voxels that are within the “slight delay” category, the animals can be classified into fast and slow evolvers with <50% voxels indicative of a fast evolver. This TTP based classification correctly predicted the DWI results of all eleven canines (p<0.01, Fishers exact test for classification).Conclusion
Here we have shown that by analyzing the degree of delay from the TTP map, the rate of evolution of the stroke can be predicted reliably. The ability to predict the rate of stoke evolution in this LVO model, at the point of first MRI, will allow for a better understanding of new therapeutics. Moreover, this analysis method can potentially allow for better patient selection for thrombectomy.Acknowledgements
No acknowledgement found.References
1.Blanc R, Radjem H, Ciccio G et al. Predictors of the Aspiration Component Success of a Direct Aspiration First Pass Technique (ADAPT) for the Endovascular Treatment of Stroke Reperfusion Strategy in Anterior Circulation Acute Stroke. Stroke 2017;48:1588-1593
2. Bråtane BT, Cui H, Cook DJ et al. Neuroprotection by freezing ischemic penumbra evolution without cerebral blood flow augmentation with a postsynaptic density-95 protein inhibitor. Stroke. 2011;42:3265-3270.
3. Kang BT, Lee JH, Jung DI et al. Canine model of ischemic stroke with permanent middle cerebral artery occlusion: clinical and histopathological findings. J Vet Sci. 2007;8:369-376.
4. Zaro-Weber O, Moeller-Hartmann W, Heiss WD et al. MRI perfusion maps in acute stroke validated with 15O-water positron emission tomography. Stroke 2010;41:443-449.
5. Wittsack HJ, Ritzl A, Fink GR et al. MR imaging in acute stroke: diffusion-weighted and perfusion imaging parameters for predicting infarct size. Radiology. 2002;222:397-403.
6. Grandin CB, Duprez TP, Smith AM et al. Which MR-derived perfusion parameters are the best predictors of infarct growth in hyperacute stroke? Comparative study between relative and quantitative measurements. Radiology. 2002;223:361-370.
7. Drier A, Tourdias T, Attal Y et al. Prediction of Subacute Infarct Size in Acute Middle Cerebral Artery Stroke: Comparison of Perfusion-weighted Imaging and Apparent Diffusion Coefficient Maps. Radiology. 2012;265:511-517.
Figures