5039
Using D2O As a Diffusible Tracer in Characterizing Tumor Properties on Mice1Department of Biomedical Engineering and Environmental Sciences, National Tsing Hua University, Hsinchu, Taiwan, 2Division of Nuclear Medicine, Chang Gung Memorial Hospital, Taoyuan, Taiwan
Synopsis
As a diffusible tracer, D2O was employed as a negative contrast agent in investigating tumor perfusion in this study. Results show that the transfer constant derived from D2O perfusion is able to characterize tumor flow properties. Furthermore, we also demonstrated that the initial area under curve of D2O perfusion has potential in detecting the flow difference between tumor and normal tissue, suggesting the feasibility of semi-quantitative indices for D2O perfusion.
Introduction
Deuterium oxide (D2O) has been proposed as an alternative contrast agent on rodent brain perfusion by monitoring the attenuation of 1H signal 1. Since heavy water is highly diffusible and the molecular weight and chemical properties are quite similar to normal water, the ability of heavy water in infiltrating through tissue as well as tumor region is expected to be the same to normal water, which could therefore provide different physiological information to conventional large-size Gd-based contrast agents. In this study, applying D2O as a negative contrast agent in investigating tumor perfusion was carried out for the first time. Gd-based perfusion was also performed for comparison.Theory
As a diffusible tracer, normal DCE models are unable to describe D2O properly. A two-compartment model was chosen for D2O perfusion in this study. For Gd perfusion, the extended Tofts model was used and a normalized signal intensity was used as concentration of Gd to keep away of possible bias from ΔR1 calculation 2,3. According to our previous work 4, the tracer transfer constant in the perfusion models was adjusted by using an asymmetric permeability ratio (Pas) to account the condition that permeability is not symmetric in some poorly perfused tissue. As described in Tofts model 5, the transfer constant Ktrans (or f1, f2) represents mixed information of vascular permeability and blood flow: $$$Ktrans= EFρ(1-Hct)$$$, where F is blood flow, PS is permeability-surface area product, ρ is tissue density, and Hct is haematocrit. The constant E is defined as: $$$ E=1-exp(-PS/(F(1-Hct))) $$$. As a highly diffusible tracer, D2O presents PS larger than F and the transfer constant is consequently dominated by flow. That is, the transfer constant f1, f2 of D2O is speculated to represent the flow, whereas the transfer constant Ktrans of Gd represents the vascular permeability.
Methods
All protocols were approved by local IACUC. Mice model were established on 8-week-old male C57BL/6 mice (N=11) by intracranially inoculation of ALTS1C1 tumor cells, with detailed procedures equivalent to previous work (6). After 14 days of tumor growth, MRI experiments were performed on 7-Tesla Bruker ClinScan scanner under 1.5% isoflurane/O2 anesthesia. T2-weighted images were acquired using turbo-spin-echo (TSE) with TR/TE=3700/46 ms, FOV=20×20 mm2, matrix size=256×256, slice thickness=1 mm. For D2O perfusion, 120 time points were continuously acquired using TSE with TR/TE=1000/14 ms, matrix size=128x64, turbo factor=8. After 40 baselines, isotonic D2O with a dose of 2mL/100g body weight was infused through tail vein by a syringe pump in 15 s. For DCE-MRI, a dose of 0.6 mmol/kg body weight was administered via tail vein. A 3D-FLASH was employed for DCE imaging with TR/TE=2.43/0.84 ms, matrix size=128x128, 8 slices, flip angle=15. A total of 30 baselines and 270 post-injection were obtained. All data were processed on Matlab. In addition to dedicated pharmacological models, semi-quantitative metrics including amplitude of peak, time-to-peak (TTP), wash-in slope, and initial area under tracer uptake curve (IAUC) were also calculated.
Results
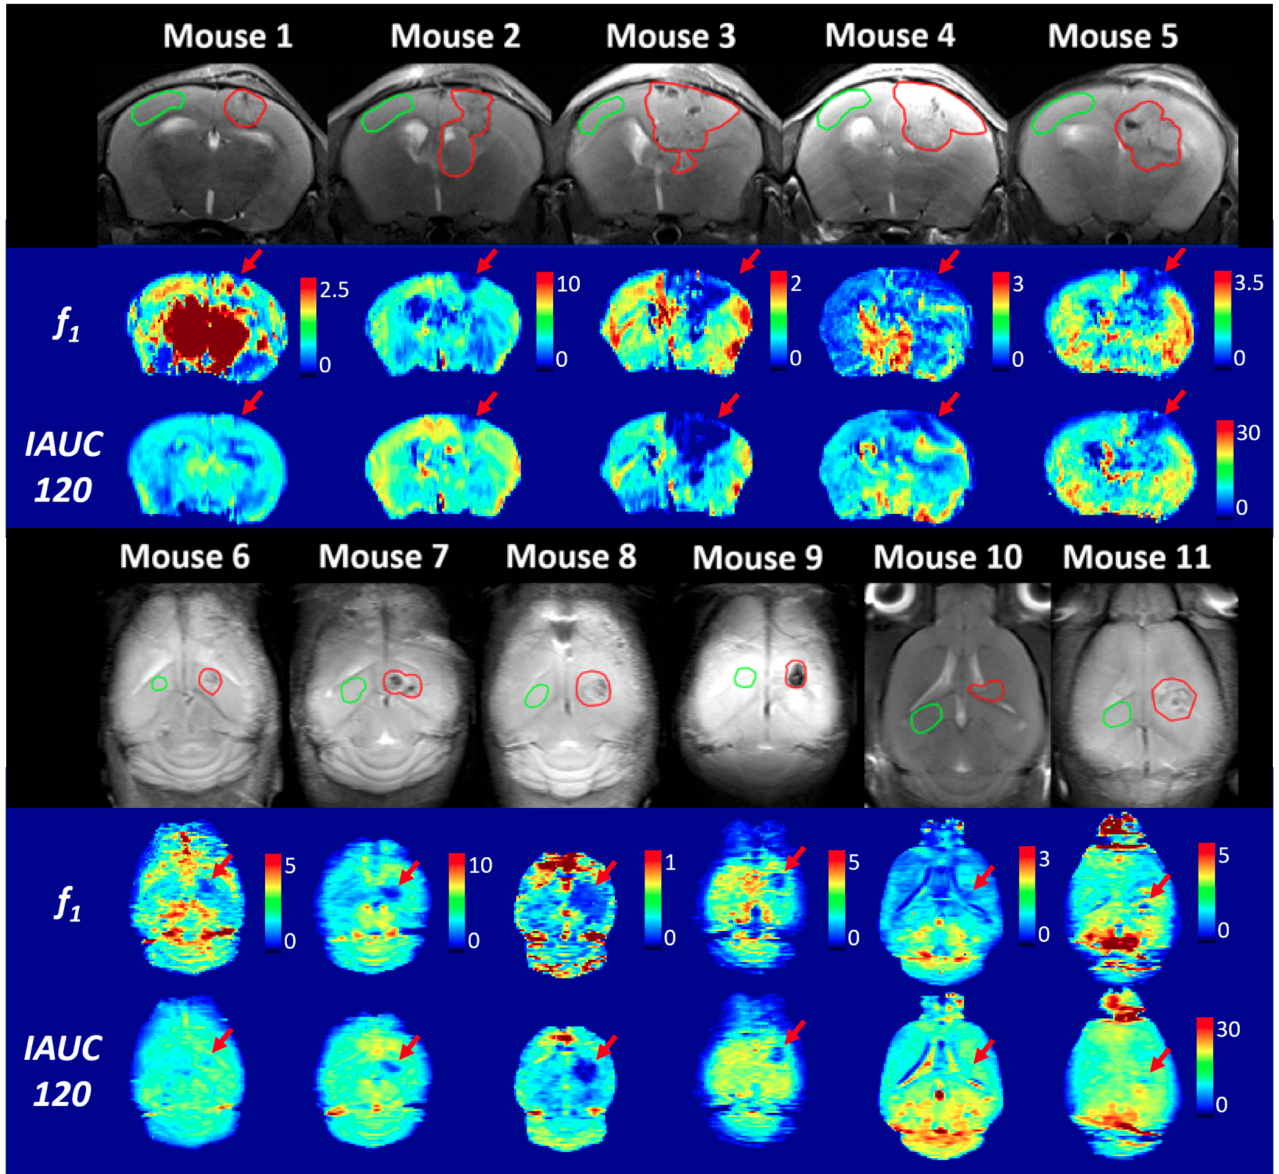
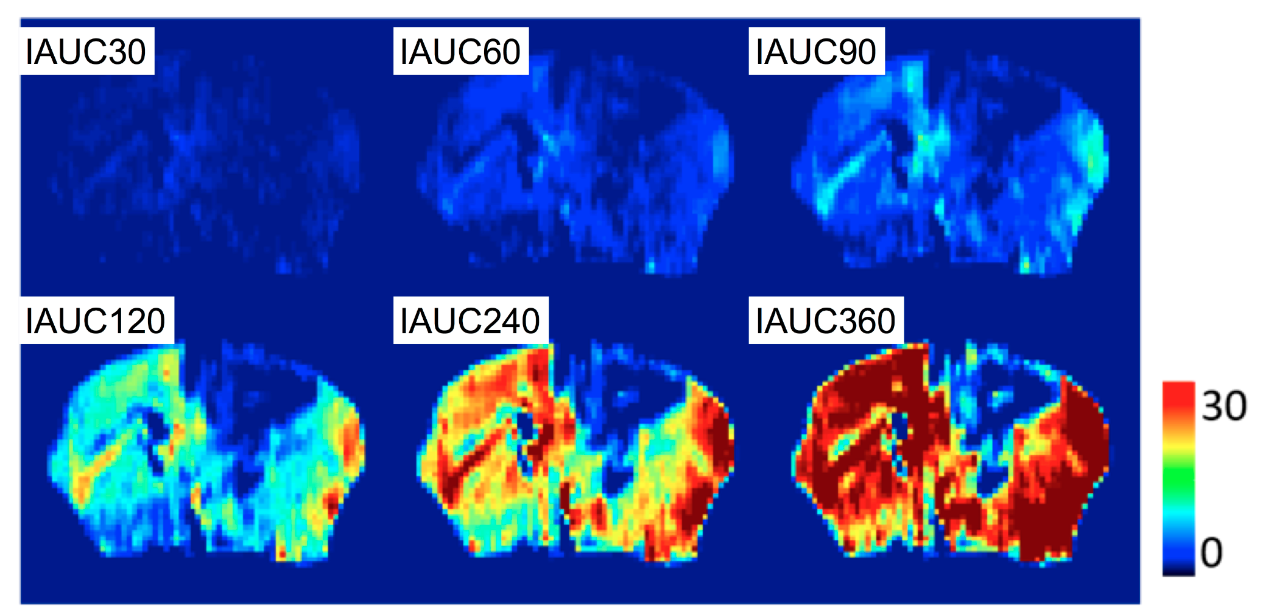
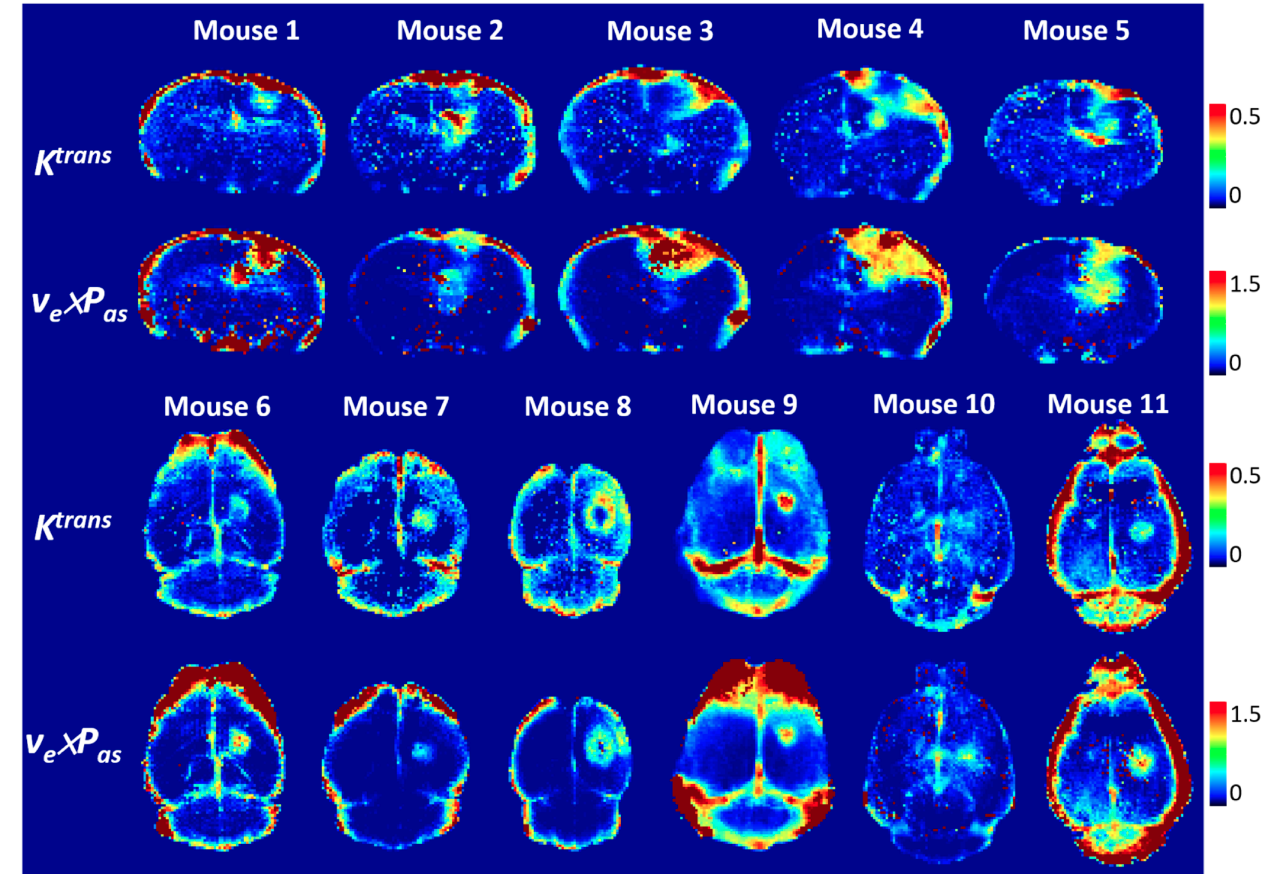
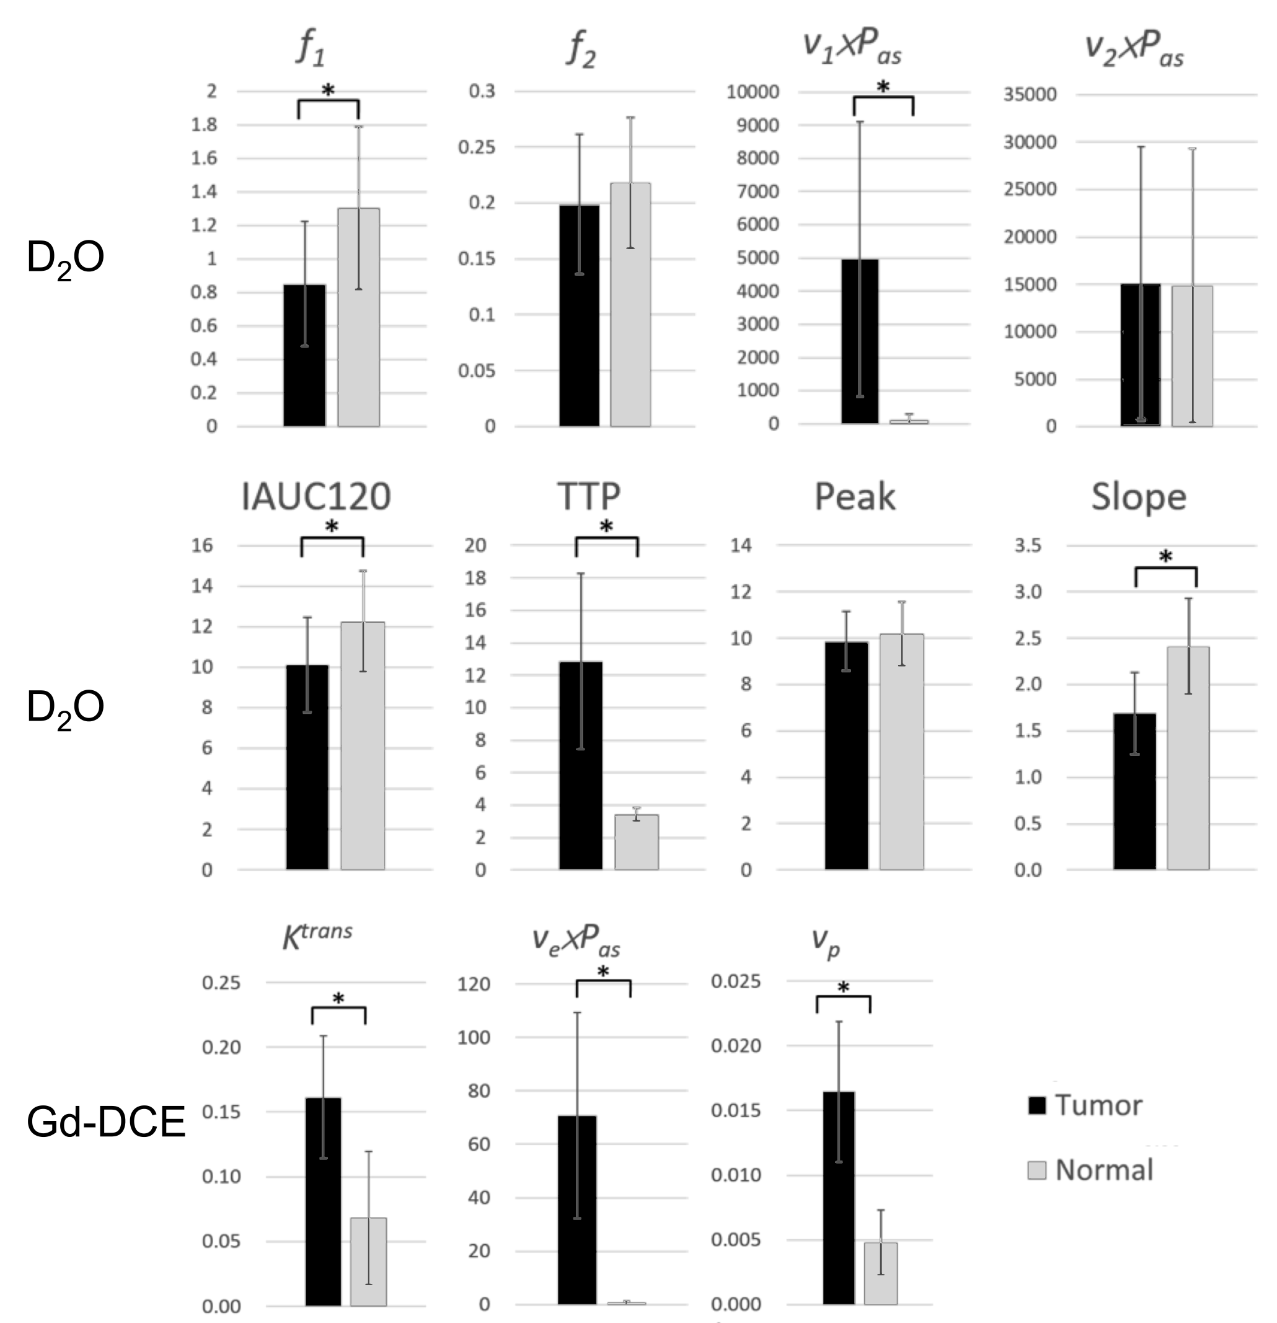
The f1maps and IAUC120 maps in D2O perfusion were shown in Figure 1. Both f1 and IAUC120 were able to delineate tumor regions. Tumor region can be clearly identified in IAUC120, IAUC240, and IAUC360, as shown in Figure 2. As revealed in Figure 3, Ktrans and vexPas maps derived from Gd-DCE provide good contrast between tumor and normal tissue. Figure 4 generalized the comparisons between tumor and normal tissue via various indices in D2O-based and Gd-based perfusion. While the f1and v1xPas in D2O are able to provide significant contrast, semi-quantitative results including IAUC120 and TTP could also provide differentiating ability.Discussions
As indicated in our D2O perfusion results, lower f1 values were generally found in tumor, suggesting a decreased flow in these areas. We speculated that the high tumor interstitial fluid pressure (TIFP) could be a possible reason since D2O is freely diffusible and is neither restricted by blood-brain-barrier nor vascular boundaries. High TIFP has been thought to be an obstacle in cancer therapy for many years 7,8. The f1 constant in D2O perfusion could provide valuable information regarding to the flow of tumor tissue, and potentially the distributions of TIFP can also be detected with further quantification algorithms in the future. On the other hand, IAUC120 maps provide similar contrast to f1 maps. Essentially, IAUC encompasses several properties such as flow rate, TTP, and wash-in slope. This finding suggests that IAUC maps can also be employed as an indicator for flow, especially for its simplicity and straightness.Conclusion
D2O has been successfully employed as a negative contrast agent in studying mice tumor perfusion. The transfer constant derived from D2O perfusion is capable of detecting tumor flow properties. The IAUC has potential in probing flow difference between tumor and normal tissue in D2O perfusion.Acknowledgements
We thank for the research grant from Taiwan Ministry of Science and Technology (105-2221-E-007-054-MY3). We also thank the instrument support from Center for Advanced Molecular Imaging and Translation, Chang Gung Memorial Hospital, Linkou.References
1. Wang FN, Peng SL, Lu CT, Peng HH, Yeh TC. Water signal attenuation by D2O infusion as a novel contrast mechanism for 1H perfusion MRI. NMR Biomed 2013;26(6):692-698.
2. Bagher-Ebadian H, Nejad-Davarani SP, Jain R, Noll D, Jiang Q, Arbab AS, Mikkelsen T, Ewing JR. Comparison of Signal Intensity and Standard Techniques for Estimation of Pharmacokinetic Parameters in DCE-T1 Studies of Glioblastoma: Using Model Selection. 2012; Melbourne, Australia.
3. Yankeelov TE, Gore JC. Dynamic Contrast Enhanced Magnetic Resonance Imaging in Oncology: Theory, Data Acquisition, Analysis, and Examples. Curr Med Imaging Rev 2009;3(2):91-107.
4. Yu PL, Chao KI, Cheng M, Wang FN. Can ve be larger than one? A modification for asymmetric vascular permeability in Toft’s model may reveal glymphatic dysfunction in tumor. 2018; Paris, France.
5. Tofts PS. Modeling tracer kinetics in dynamic Gd-DTPA MR imaging. Jmri-J Magn Reson Im 1997;7(1):91-101.
6. Wang SC, Hong JH, Hsueh C, Chiang CS. Tumor-secreted SDF-1 promotes glioma invasiveness and TAM tropism toward hypoxia in a murine astrocytoma model. Lab Invest 2012;92(1):151-162.
7. Heldin CH, Rubin K, Pietras K, Ostman A. High interstitial fluid pressure - an obstacle in cancer therapy. Nat Rev Cancer 2004;4(10):806-813.
8. Rofstad EK, Galappathi K, Mathiesen BS. Tumor interstitial fluid pressure-a link between tumor hypoxia, microvascular density, and lymph node metastasis. Neoplasia 2014;16(7):586-594.
Figures