5035
Pharmacokinetic Parameter Accuracy Correlates with Image Quality Metrics in Flexible Temporal Resolution DCE-MRI Simulations1Physics and Atmospheric Science, Dalhousie University, Halifax, NS, Canada, 2Biomedical Translational Imaging Centre (BIOTIC), Nova Scotia Health Authority, Halifax, NS, Canada, 3Physics, Carelton University, Ottawa, ON, Canada, 4Diagnostic Radiology, Dalhousie University, Halifax, NS, Canada
Synopsis
The choice of imaging parameters in dynamic contrast enhanced (DCE) MRI, such as temporal resolution, can affect the recovered parameter when using quantitative pharmacokinetic (PK) models, such as Ktrans in the Tofts model. We propose objective image quality metrics (IQMs) as a tool to guide this choice to maximize PK parameter accuracy. DCE MRI simulations were performed on a numerical phantom with user defined PK parameters. IQMs were calculated using the numerical phantom as a reference and references generated from the simulated data. In both cases, a strong correlation between the PK parameter error and IQM score is found.
Introduction
Pharmacokinetic (PK) parameters, such as Ktrans or kep, derived from dynamic contrast enhanced (DCE) MRI can serve as a helpful biomarker in the diagnosis of cancer1. The choice of acquisition and reconstruction parameters, such as temporal resolution, undersampling factor, or regularization weight in compressed sensing, will affect the parameters recovered from PK modeling. An automated tool for guiding these choices is needed.
Image quality metrics (IQMs) that attempt to mimic human evaluation of image quality, such as the structural similarity index (SSIM2), have been gaining usage in the MRI field. Previous DCE simulations have demonstrated correlations between IQMs and recovered parameters describing the temporal evolution of signal defined by exponential and sinusoidal models3, suggesting that IQMs could be used to guide acquisition and reconstruction parameter choices. The current study extends the previous work to simulate the more physiologically relevant Tofts model4 that may be observed in DCE MRI. We hypothesize that IQMs will still correlate with the PK parameters recovered from this model. We also explore the feasibility of calculating IQMs based on references generated from the simulated data, since a known reference would not be available in practice.
Methods
All simulations were performed in MATLAB (R2018B, MathWorks, MA, USA) on a 200x200x32 numerical phantom3. The phantom features a series of cylinders that evolve with a time course defined by the Tofts model4 and an arterial input function as defined by Parker et al5. Data was collected using a modified CIRcular Cartesian UnderSampling (CIRCUS6) technique, in which data are collected in highly undersampled packets which can be retrospectively combined and reconstructed in user defined amounts to achieve a desired temporal resolution and undersampling factor7. Images were reconstructed using the ‘pics’ command of BART8 using varying numbers of CIRCUS packets, np, and regularization weights, λ. The time courses were fit using the ROCKETSHIP9 toolbox to recover PK parameters.
Six full reference IQMs were included in this study: root mean square error (RMSE), gradient magnitude similarity deviation (GMSD10), SSIM2, multi-scale SSIM (MSSSIM11), information-weighted SSIM (IWSSIM12), and feature similarity (FSIM13). IQM scores were calculated using four different references, which can be broken into two categories. The first category consists of ground truth information from the numerical phantom. The second category references are generated from the simulated MRI data by combining many packets to achieve a low undersampling factor. Three references were created by combining data in different regions of the time course: pre-contrast, during the period of peak enhancement, and during the wash-out period.
Results and Discussion
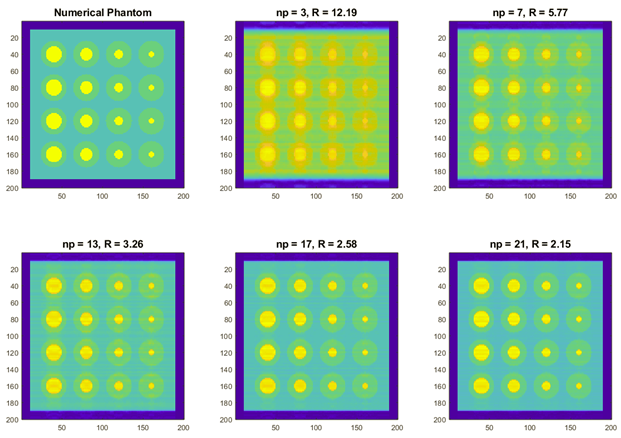
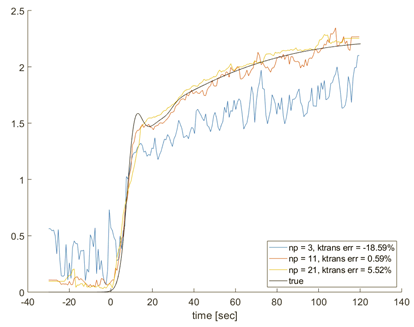
As more packets are combined, the spatial fidelity and overall image quality of the reconstructed phantom images increases (Figure 1). Time courses of reconstructions with fewer packets can detect the period of rapid enhancement well, but overall have a low fidelity to the true time course (Figure 2). This is mostly due to residual aliasing noise from the high effective undersampling factor. Data reconstructed with a larger number of packets demonstrate higher fidelity in the slower temporal dynamic regions, but suffer from temporal smearing, as can be observed as rounded ‘shoulders’ of the time courses.
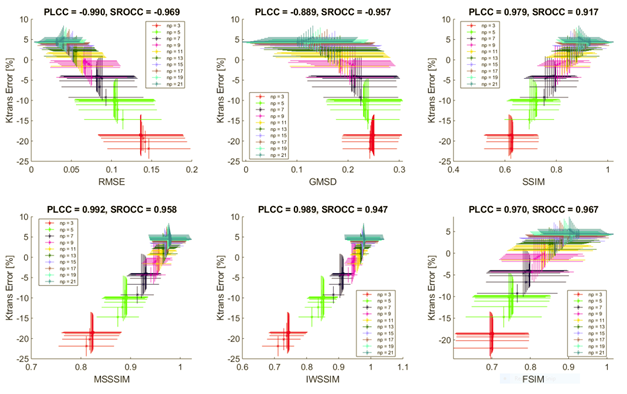
The impact of these phenomena on the resulting Ktrans error can be observed in the IQM plots (Figure 3). In these data, the reference is taken to be the ground truth numerical phantom. For large numbers of CIRCUS packets, np, the image quality is high, but the model systemically overestimates Ktrans due to poor temporal resolution. For low np values, the model systemically underestimates Ktrans. There is a trade off between the image quality and temporal resolution, with the optimum corresponding to the zero crossing. Interestingly, the optimal score of the corresponding IQM is not simply the maximum (or minimum for RMSE and GMSD), as is typically the case when using IQMs. A similar trend was observed in kep for reconstructions with individual regularization weights, but variation between different regularization weights appeared to be larger.
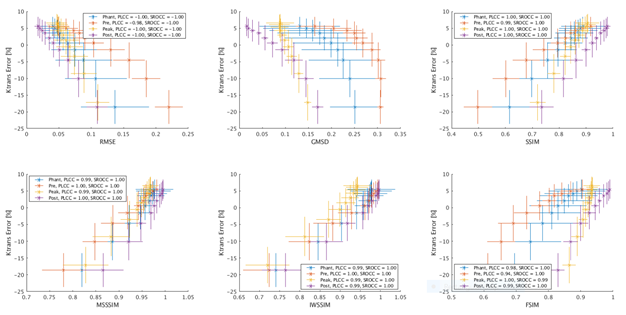
Figure 4 shows the relationship between Ktrans error and IQM scores calculated using the data generated references; a strong correlation is observed regardless of the particular reference image used. The results show that using a data generated reference can serve as a surrogate for a ground truth reference.
Conclusions
We demonstrate correlations between Ktrans error and IQMs of a simulated DCE MRI scan and observe systemic bias based on choice of temporal resolution/undersampling factor. Reference images generated from the simulated data are shown to work as well as using the ground truth simulated phantom, suggesting full reference IQMs can still be used when no ground truth reference is known.Acknowledgements
Funding for this research was provided by NSERC, Brain Canada, the Atlantic Innovation Fund, and an Investigator Sponsored Research Agreement with GE Healthcare.References
[1] Weinreb J, Barentsz J, Choyke P, et al. PI-RADS Prostate Imaging – Reporting and Data System: 2015, Version 2. European Urology 2016. 69:16-40.
[2] Wang Z, Bovik Z, Sheikh H, and Simoncelli P. Image Quality Assessment: From Error Visibility to Structural Similarity. IEEE Trans Image Proc. 2004; 13(4):1-14.
[3] Murtha N, Rioux J, Marriot O, et al. Simulation Reveals Evidence for Bias in Parameter Estimates for Compressed Sensing of Temporally Dynamic Systems. Proc. Intl. Soc. Mag. Reson. Med. 2017. 25:3810
[4] Tofts P, Brix G, Buckley D, et al. Estimating Kinetic Parameters from Dynamic Contrast-Enhanced T1-Weighted MRI of a Diffusable Tracer: Standardized Quantities and Symbols. JMRI 1999. 10:223-232.
[5] Parker G, Robers C, MacDonald A, et al. Experimentally-derived functional form for a population-averaged high-temporal-resolution arterial input function for dynamic contrast-enhanced MRI. MRM 2006. 56(5):993-1001.
[6] Liu J and Saloner D. Accelerated MRI with CIRcular Cartesian UnderSampling (CIRCUS): a variable density Cartesian sampling strategy for compressed sensing and parallel imaging. Quantitative Imaging in Medicine and Surgery 2014. 4(1):57-67
[7] Rioux J, Murtha N, Mason A, et al. Flexible Prospective Compressed Sensing Acceleration of Prostate DCE-MRI with Quantized CIRCUS. Proc. Intl. Soc. Mag. Reson. Med. 2017. 25:1426.
[8] Uecker M, Ong F, Tamir J, et al. Berkeley Advanced Reconstruction Toolbox. Proc. Intl. Soc. Mag. Reson. Med. 2015. 23:2486.
[9] Barnes S, Ng T, Santa-Maria N, et al. ROCKETSHIP: a flexible and modular software tool for the planning, processing and analysis of dynamic MRI studies. BMC Med Imaging 2015. 15(19).
[10] Xue W, Zhang L, Mou X, and Bovik A. Gradient Magnitude Similarity Deviation: A Highly Efficient Perceptual Image Quality Index. IEEE Trans on Image Proc 2013. 223(2):684-695.
[11] Wang Z, Simoncelli E, and Bovik A, Multi-Scale Structural Similarity for Image Quality Assessment. Proceedings of the 37th IEEE Asilomar Conference on Signals, Systems and Computers 2003.
[12] Wang Z, and Li Q. Information Content Weighting for Perceptual Image Quality Assessment. IEEE Trans on Image Proc 2011. 20(5):1185-1198.
[13] Zhang L, Zhang L, Mou X, and Zhang D, FSIM: A Feature Similarity Index for Image Quality Assessment. IEEE Trans on Image Proc 2011. 20(8):2378-2386.
Figures