5034
Repeatability of hepatocellular uptake and efflux in the rat liver: A comparison of Gadoxetate DCE-MRI models1Department of Biomedical Imaging Sciences, University of Leeds, Leeds, United Kingdom, 2MR & CT Contrast Media Research, Bayer AG, Berlin, Germany, 3R&D TIM Bioimaging Germany, Sanofi-Aventis Deutschland GmbH, Frankfurt, Germany, 4Bruker BioSpin MRI GmbH, Ettlingen, Germany, 5Bioxydyn Ltd, Manchester Science Park, United Kingdom, 6Centre for Imaging Sciences, University of Manchester, Manchester, United Kingdom, 7Antaros Medical, BioVenture Hub, Mölndal, Sweden, 8Chalmers University of Technology, MedTech West, Gothenburg, Sweden, 9Merck & Co., West Point, PA, United States
Synopsis
A variety of Gadoxetate DCE-MRI models have been proposed to derive hepatocyte uptake and efflux rates in the rat, but it is unclear which provides most reliable measurements. Here, we compare four models in terms of their test-retest repeatability on 9 rats measured in 3 sites. Results indicate that a two-compartment high-flow model, assuming negligible sinusoidal backflux and a fixed population-based extracellular volume fraction, provides most repeatable measures of hepatocellular function in the healthy rat.
Background
Gadoxetate DCE-MRI combined with kinetic modelling can measure hepatocyte uptake and efflux rates in the rat liver.1-4 A range of kinetic models have been proposed, dividing the liver tissue into two1-3 (extracellular and hepatocyte) or three4 (and intrahepatic bile duct) compartments. The more complex of these models provide a better fit to the data and more detailed kinetic profiling, but also risk reducing parameter precision due to overfitting.Aim
The purpose of this work was to identify the Gadoxetate DCE-MRI kinetic model that provides best precision in rat liver, as measured by the test-retest repeatability of hepatocellular uptake and efflux rates.Methods
Data Acquisition Three sites imaged 3 rats each on Bruker MRI scanners at 4.7T (A) and 7T (B, C) using Paravision 6.0.1 (Bruker BioSpin, Ettlingen, Germany) over the course of 2 days (2-7 days apart). The scan protocol consisted of T2W images for anatomy identification and a retrospectively triggered gradient echo T1W acquisition (3D, TE/TR = 1.1/5.8 ms, FOV = 60 x 60 x 35 mm, 64 x 64 x 26 matrix, flip angle = 20˚, acquisition time = 58 sec), adapted to include 13 flip angles (range = 1-30˚) for vFA T1 mapping, and a dynamic series acquired with a single flip angle of 20˚ and 30 measurements with temporal resolution 58 sec, with 0.025 mmol/kg gadoxetate injected after 5 baselines.
Image processing ROIs were manually drawn around liver and spleen, and MR signal intensities were extracted from the vFA and DCE-MRI datasets. Pre-contrast longitudinal relaxation rates (R1) were calculated and used to determine dynamic post-contrast R1, using the signal equation of a spoiled-GRE. Gadoxetate concentrations were calculated based on known relaxivities in the liver and spleen2. All image processing was performed centrally using custom-written code in MATLAB 2018a.
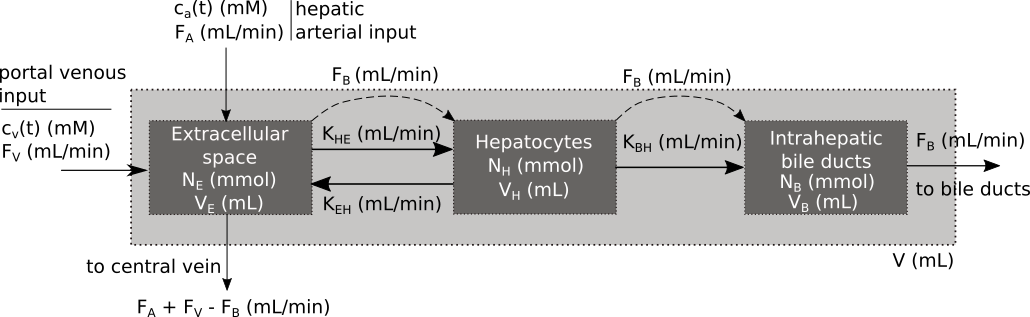
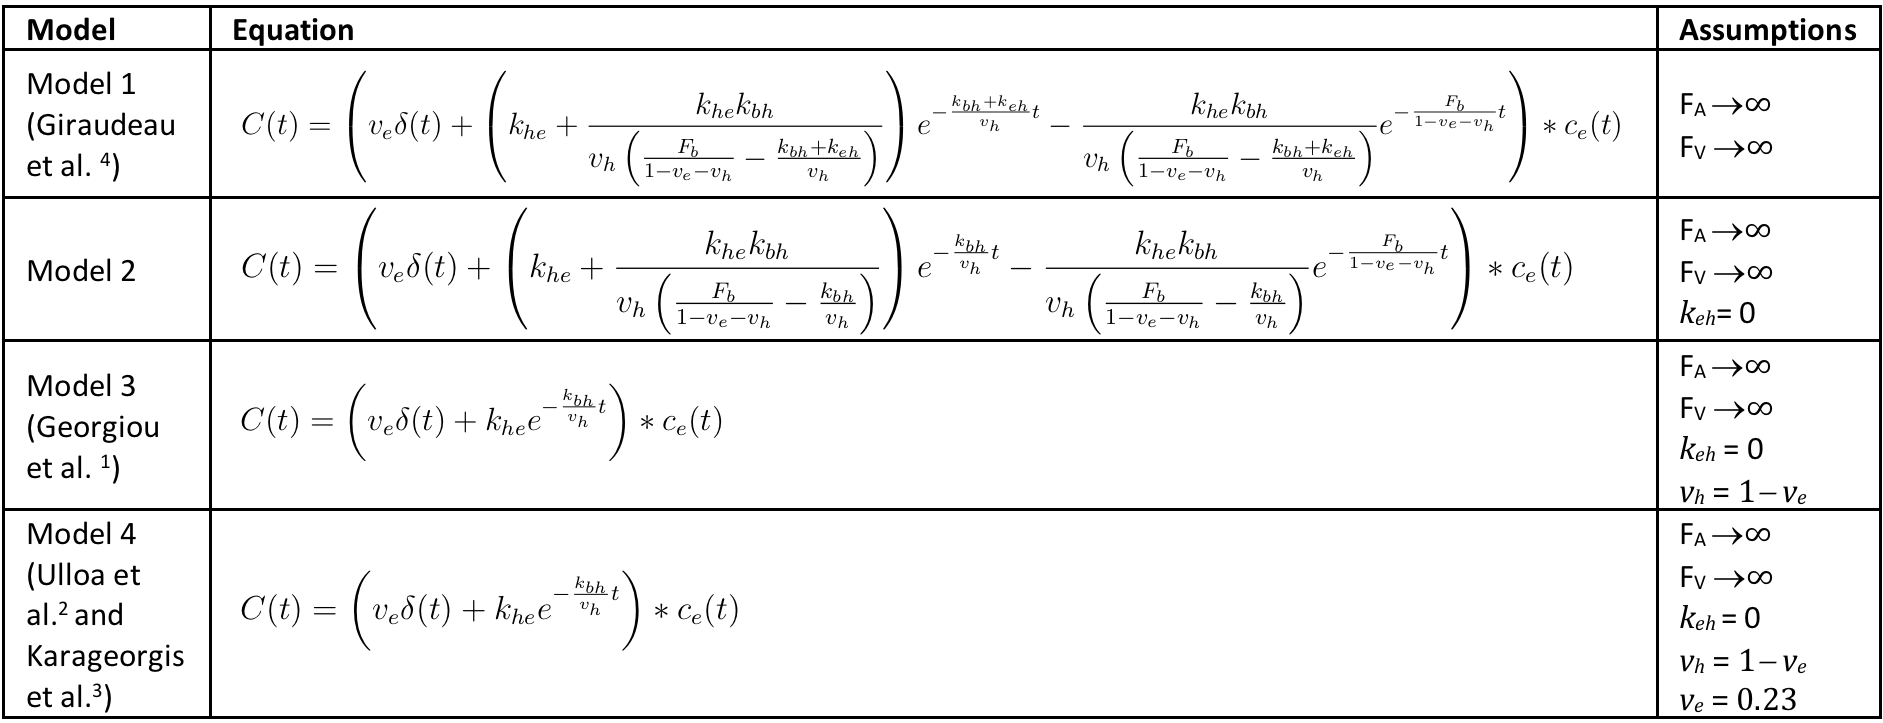
Gadoxetate DCE-MRI model-fitting Four models (Models 1-4) were derived from a unified, generic gadoxetate DCE-MRI model (Fig. 1) and used to measure kinetic parameters (hepatocyte uptake rate, $$$k_{he}=\frac{K_{HE}}{V}$$$, sinusoidal backflux, $$$k_{eh}=\frac{K_{EH}}{V}$$$, biliary efflux, $$$k_{bh}=\frac{K_{BH}}{V}$$$ and biliary flow, $$$F_b=\frac{F_B}{V}$$$) in rat liver. Table 1 shows liver concentrations expressed in terms of model parameters and the assumptions applied to derive Models 1-4. Volume fractions were normalised to total tissue volume, V. Extracellular concentration, $$$c_e(t)$$$, was derived from spleen concentrations as $$$c_e(t)=\frac{c_{spleen}(t)}{v_{e,spleen}}$$$, using a fixed $$$v_{e,spleen} = 0.43$$$.2,3 Least-squares model-fitting was performed using the LMFIT6 package in Python 3.6 using Levenberg-Marquardt minimization with parameter constraints - $$$v_e, v_h: (0,1)$$$ and $$$k_{he}, k_{eh}, k_{bh}, F_b: (0, 0.1)$$$.
Data analysis Test-retest repeatability was calculated as $$$\%CV=100×\frac{standard deviation(X_{day1},X_{day2})}{mean(X_{day1},X_{day2})}$$$ where $$$X = v_e, k_{he}, k_{bh}$$$ for each model. $$$\%CV$$$ was averaged over all rats. A high $$$\%CV$$$ indicates low repeatability.
Results
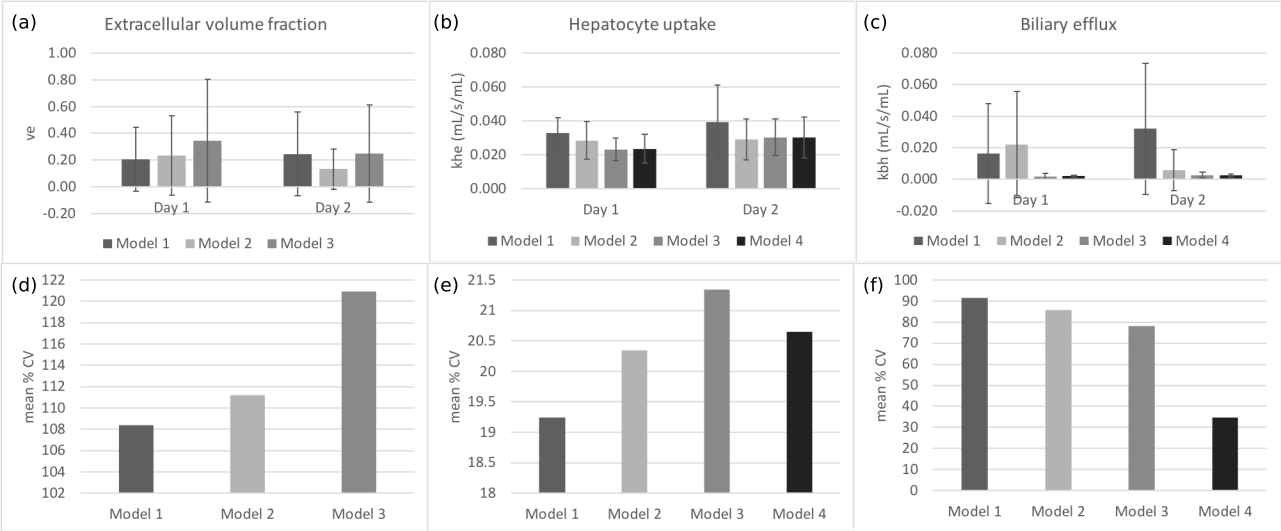
Fig. 2(a-c) shows the means and standard deviations of $$$v_e, k_{he}$$$, and $$$k_{bh}$$$ on Days 1 and 2 for all rats, measured using Models 1-4. Mean $$$\%CV$$$ of each parameter across all rats are shown in Fig. 2(d-f).Discussion
Three-compartment models (1&2) provide poor precision of biliary efflux rates, with mean values of the same order of magnitude as the hepatocyte uptake rates, unlike those reported in literature.3 These models also provide poor precision (large standard deviations) of extracellular volume fractions and hepatocyte uptake rates. Test-retest repeatability of extracellular volume fractions is also poor for both models. Model 1 also provides low precision of the sinusoidal backflux rates (Day 1: 0.030±0.043 and Day 2: 0.025±0.036 mL/s/mL), indicating no advantage over Model 2.
On the other hand, the two-compartment models (3&4) provide greater precision of biliary efflux rates, with Model 4 also providing the most repeatable measures ($$$\%CV=34.7$$$). Mean values of biliary efflux rates obtained with these models are an order of magnitude lower than the hepatocyte uptake rates, as expected. Precision and repeatability of hepatocyte uptake rates are comparable across these models. While Model 3 provides a measure of the extracellular volume fraction, precision and repeatability of the measurement are low. Therefore, there is no advantage in using Model 3 over Model 4.
These results provide a compelling argument for using a population-based liver $$$v_e$$$ in studies where the normal variability of extracellular volume fraction is expected to be low, for instance, in healthy rat subjects. Future work using interventions is needed to determine the effect of changes in $$$v_e$$$ on the accuracy of parameters assessed with a model that uses a fixed $$$v_e$$$.
Conclusions
A two-compartment gadoxetate DCE-MRI of rat liver model, assuming negligible sinusoidal backflux, and using a known, fixed liver extracellular volume fraction, gives repeatable measures of hepatocyte uptake and efflux rates in healthy rat liver.Acknowledgements
This work is funded by Innovative Medicines Initiative 2 Joint Undertaking, Grant Agreement number 116106-IB4SD-TRISTAN. This joint undertaking receives support from the European Union’s Horizon 2020 research and innovation programme and EFPIA.References
1. Georgiou L, Penny J, Nicholls G, et al. Modeling Gadoxetate liver uptake and efflux using dynamic contrast-enhanced magnetic resonance imaging enables preclinical quantification of transporter drug-drug interactions. Invest Radiol. 2018;53(9):563-570.
2. Ulloa JL, Stahl S, Yates J, et al. Assessment of Gadoxetate DCE-MRI as a biomarker of hepatobiliary transporter inhibition. NMR Biomed. 2013;26:1258-1270.
3. Karageorgis A, Lenhard SC, Yerby B, et al. A multi-center preclinical study of gadoxetate DCE-MRI in rats as a biomarker of drug induced inhibition of liver transporter function. PLoS ONE 2018;13(5): e0197213.
4. Giraudeau C, Leporq B, Doblas S, et al. Gadoxetate-enhanced MR imaging and compartmental modelling to assess hepatocyte bidirectional transport function in rats with advanced liver fibrosis. Eur Radiol. 2017;27:1804-1811.
5. Blouin A, Bolender RP and Weibel ER. Distribution of organelles and membranes between hepatocytes and nonhepatocytes in the rat liver parenchyma. J Cell Biol. 1977;72-441-455.
6. Newville M, Stensitzki T, Allen DB, et al. LMFIT: Non-linear least-squares minimization and curve-fitting for Python. Zenodo 2014. http://doi.org/10.5281/zenodo.11813.
Figures