5033
The Effect of the Injection Dose, Rate and Concentration on Carotid Dynamic Contrast-Enhanced MRI: a Simulation Study1Center for Biomedical Imaging Research, School of Medicine, Tsinghua University, Beijing, China, 2Philips Healthcare, Beijing, China, 3School of Biomedical Engineering and Imaging Sciences, King's College London, London, United Kingdom
Synopsis
Dynamic contrast-enhanced MR imaging (DCE-MRI) is an effective tool to quantify inflammation in carotid atherosclerotic plaque, while little is known on the effect of the injection protocol on carotid DCE-MRI. In this study, the effect of the contrast injection protocol, including injection dose and effective injection rate (decided by the injection rate and concentration) on the pharmacokinetic parameters estimation in carotid DCE-MRI were investigated. The results indicated that high injection dose (~0.1mmol/kg) with relative low effective injection rate (~0.5 mmol/s, effective injection rate = rate (ml/s) × concentration (mol/L)) was recommended for the simulated bright-blood DCE protocol.
Introduction
Dynamic contrast-enhanced MR imaging (DCE-MRI) is an effective tool to quantify inflammation in carotid atherosclerotic plaque1-5. However, the injection protocol of carotid DCE-MRI varies in different studies1-4, and little is known on the effect of the injection protocol on carotid DCE-MRI, especially considering the artifacts from flowing blood and changing contrast during imaging that may introduce bias in vessel wall DCE-MRI analysis. The purpose of this study is to investigate the effect of the contrast injection protocol, including the injection dose, rate and concentration on the pharmacokinetic parameters estimation in carotid DCE-MRI using simulation.Methods
Two carotid plaques (Fig 1) were simulated using MATLAB. The injection dose (0.02~0.1mmol/kg), rate (0.1~4ml/s) and concentration (0.05~0.5mol/L) were varied. Effective injection rate (mmol/s) was defined as rate × concentration. The contrast concentration in the carotid (arterial input function, AIF) was calculated by a convolution of the injection waveform with each of the subsequent impulse response functions using Verhoeven’s model6,7. A two-compartment kinetic model was used2. Concentrations of each component were converted to T1 and T28,9. Ktrans (min-1), vp, T10 (ms) and T20 (ms) were set as in Table 12,10,11. T2* effect was assumed to be proportional by a factor of 0.85 to T2 effect12. The bright-blood DCE sequence3 was simulated (Table 2). Dynamic MR signals in the stationary tissues (vessel wall, lipid-rich necrotic core (LRNC), intra-plaque hemorrhage (IPH)) were calculated by spoiled gradient recalled echo sequence (SPGR) signal equation13. Blood flow in the carotid artery was simulated as laminar flow (maximum velocity=120cm/s)6,14. Dynamic MR signals of the blood was calculated according to its velocity.
To simulate the artifacts caused by changing contrast during imaging, dynamic images (temporal resolution=TR) and the corresponding Cartesian k-space data were first generated by adding dynamic signals of each component to the relevant region of interest (ROI). The simulated k-space datasets (temporal resolution=dynamic phase) were synthesized by multiple k-space datasets (temporal resolution=TR). Ten average distributed time delays were tested to simulate the uncertainty of the time gap between contrast injection and image acquisition. Gaussian noise (SNR=20dB) was then added to each k-space dataset independently.
The reconstructed dynamic images were generated using 2D IFFT. To take the effect of possible flow artifacts into consideration, AIF was extracted based on the signal intensity of the lumen automatically (should be smaller than the true lumen boundary because of the flow artifacts caused by the slow flowing blood near lumen); and the plaque ROI was defined by subtracting the automatically selected lumen ROI from the true artery outer wall boundary (should contain the region with flow artifacts). The concentration of each component was calculated. A two compartment kinetic model2 was used to estimate Ktrans and vp pixel by pixel within the plaque ROI using least-squares fitting algorithm.
The mean of the root mean square error (RMSE) of the Ktrans map and vp map within the plaque ROI under each time delay of each injection protocol were calculated. Under a certain injection protocol, the mean of the RMSEflow (mean RMSEflow) and the standard deviation of the RMSEflow (sd RMSEflow) of different time delays were recorded.
Results
Given a fixed effective injection rate, higher injection dose was beneficial to both mean and sd RMSEflow (Fig 2). Given a fixed injection dose, too high or too low effective injection rate resulted in inaccurate pharmacokinetic parameters estimation, the effective injection rate at around 0.5 mmol/s resulted in the lowest mean RMSEflow (Fig 2. a) and the effective injection rate at around 0.2 mmol/s resulted in the lowest sd RMSEflow (Fig 2. b). Image artifacts caused by flowing blood and changing contrast during imaging were more severe at higher effective injection rate (Fig 3. c, e). Higher effective injection rate also resulted in inaccurate ROI selection (Fig 3. d, f), much higher AIF peak (Fig 3. g, h), and more severe underestimation of the AIF (Fig 3. g, h).Discussion and Conclusion
This study gives optimized contrast injection protocol for DCE-MRI of carotid vessel wall. High injection dose (~ 0.1 mmol/kg) with relative low effective injection rate (~ 0.5 mmol/s) is recommended for the simulated bright-blood DCE protocol. Low effective injection rate (mmol/s) can be achieved by varying the injection rate (ml/s) or concentration (mol/L). High injection dose should result in higher image contrast to noise ratio. However, high effective injection rate may led to high AIF peak, which would hard to be captured because of the saturation effect and time delay uncertainty. On the other hand, high effective injection rate also cause more severe image artifacts and inaccurate ROI selection. This study also provided a useful procedure to find the optimal injection protocol under a certain DCE-MRI acquisition protocol.Acknowledgements
No acknowledgement found.References
1. Sun J, Song Y, Chen H, Kerwin WS, Hippe DS, Dong L, et al. Adventitial perfusion and intraplaque hemorrhage: a dynamic contrast-enhanced MRI study in the carotid artery. Stroke. 2013;44(4):1031-6.
2. Chen H, Cai J, Zhao X, Underhill H, Ota H, Oikawa M, et al. Localized measurement of atherosclerotic plaque inflammatory burden with dynamic contrast-enhanced MRI. Magnetic resonance in medicine. 2010;64(2):567-73.
3. Kerwin WS, Oikawa M, Yuan C, Jarvik GP, Hatsukami TS. MR imaging of adventitial vasa vasorum in carotid atherosclerosis. Magnetic resonance in medicine. 2008;59(3):507-14.
4. Gaens ME, Backes WH, Rozel S, Lipperts M, Sanders SN, Jaspers K, et al. Dynamic contrast-enhanced MR imaging of carotid atherosclerotic plaque: model selection, reproducibility, and validation. Radiology. 2013;266(1):271-9.
5. Chen H, Wu T, Kerwin WS, Yuan C. Atherosclerotic plaque inflammation quantification using dynamic contrast-enhanced (DCE) MRI. Quantitative imaging in medicine and surgery. 2013;3(6):298-301.
6. L V. Digital Subtraction Angiography: The Technique And An Analysis Of The Physical Factors Influencing The Image Quality: The Netherlands: Technische Hogeschule; 1985.
7. Maki JH, Prince MR, Chenevert TC. Optimizing three-dimensional gadolinium-enhanced magnetic resonance angiography. Original investigation. Investigative radiology. 1998;33(9):528-37.
8. S.Tofts P. T1-weighted DCE imaging concepts: modelling, acuqisition and analysis. Magnetom Flash. 2010.
9. Rohrer M, Bauer H, Mintorovitch J, Requardt M, Weinmann HJ. Comparison of magnetic properties of MRI contrast media solutions at different magnetic field strengths. Invest Radiol. 2005;40(11):715-24.
10. G. Mihai SG, T. P. Sharkey-Toppen, S. V. Raman, S. Rajagopalan, and O. P. Simonetti, editor Quantitative T1, T2 and T2* Mapping of Carotid Artery Normal Wall and Atherosclerotic Plaque Proc Intl Soc Mag Reson Med 19 2011.
11. Stanisz GJ, Odrobina EE, Pun J, Escaravage M, Graham SJ, Bronskill MJ, et al. T1, T2 relaxation and magnetization transfer in tissue at 3T. Magn Reson Med. 2005;54(3):507-12.
12. Robert P, Violas X, Santus R, Le Bihan D, Corot C. Optimization of a blood pool contrast agent injection protocol for MR angiography. J Magn Reson Imaging. 2005;21(5):611-9.
13. Bernsteiin MA KK, Zhou XJ. Basic pulse sequences. Handbook of MRI Pulse Sequences. 2004.
14. Blackshear WM, Phillips DJ, Chikos PM, Harley JD, Thiele BL, Strandness DE, Jr. Carotid artery velocity patterns in normal and stenotic vessels. Stroke. 1980;11(1):67-71.
Figures
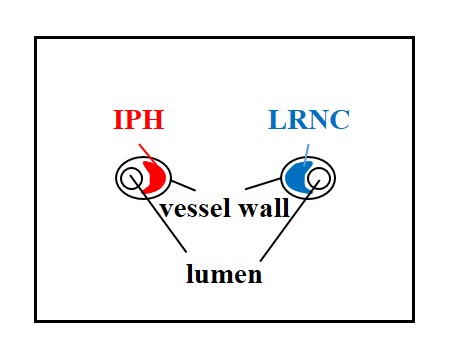
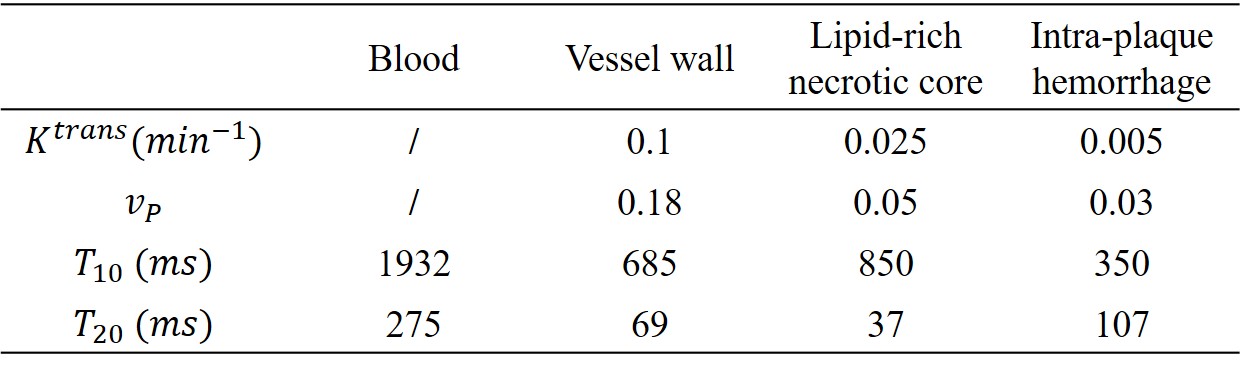
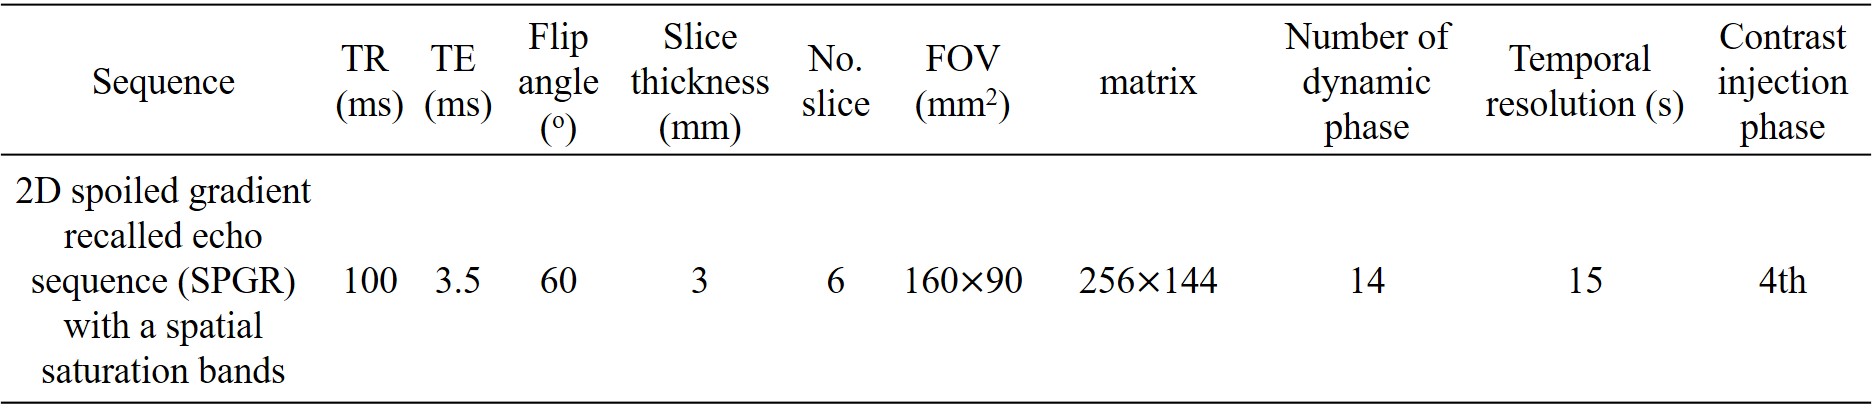
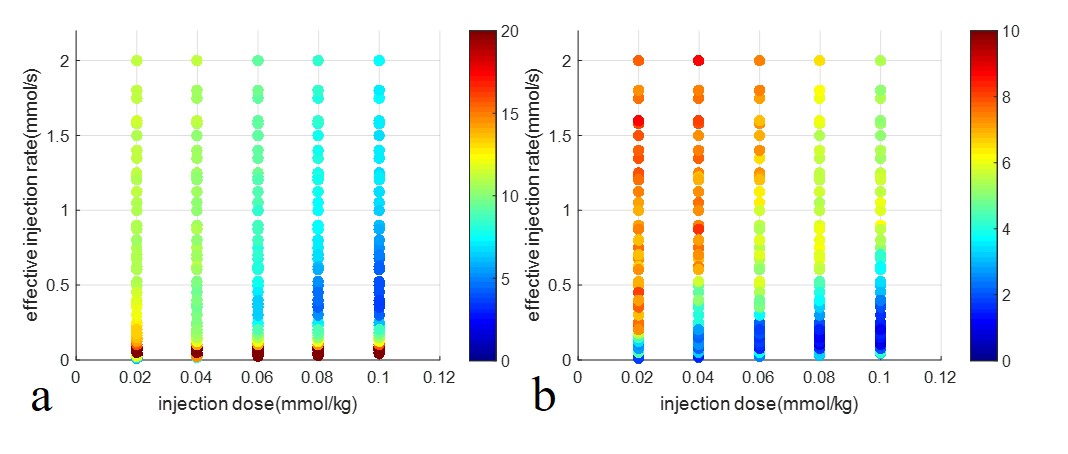
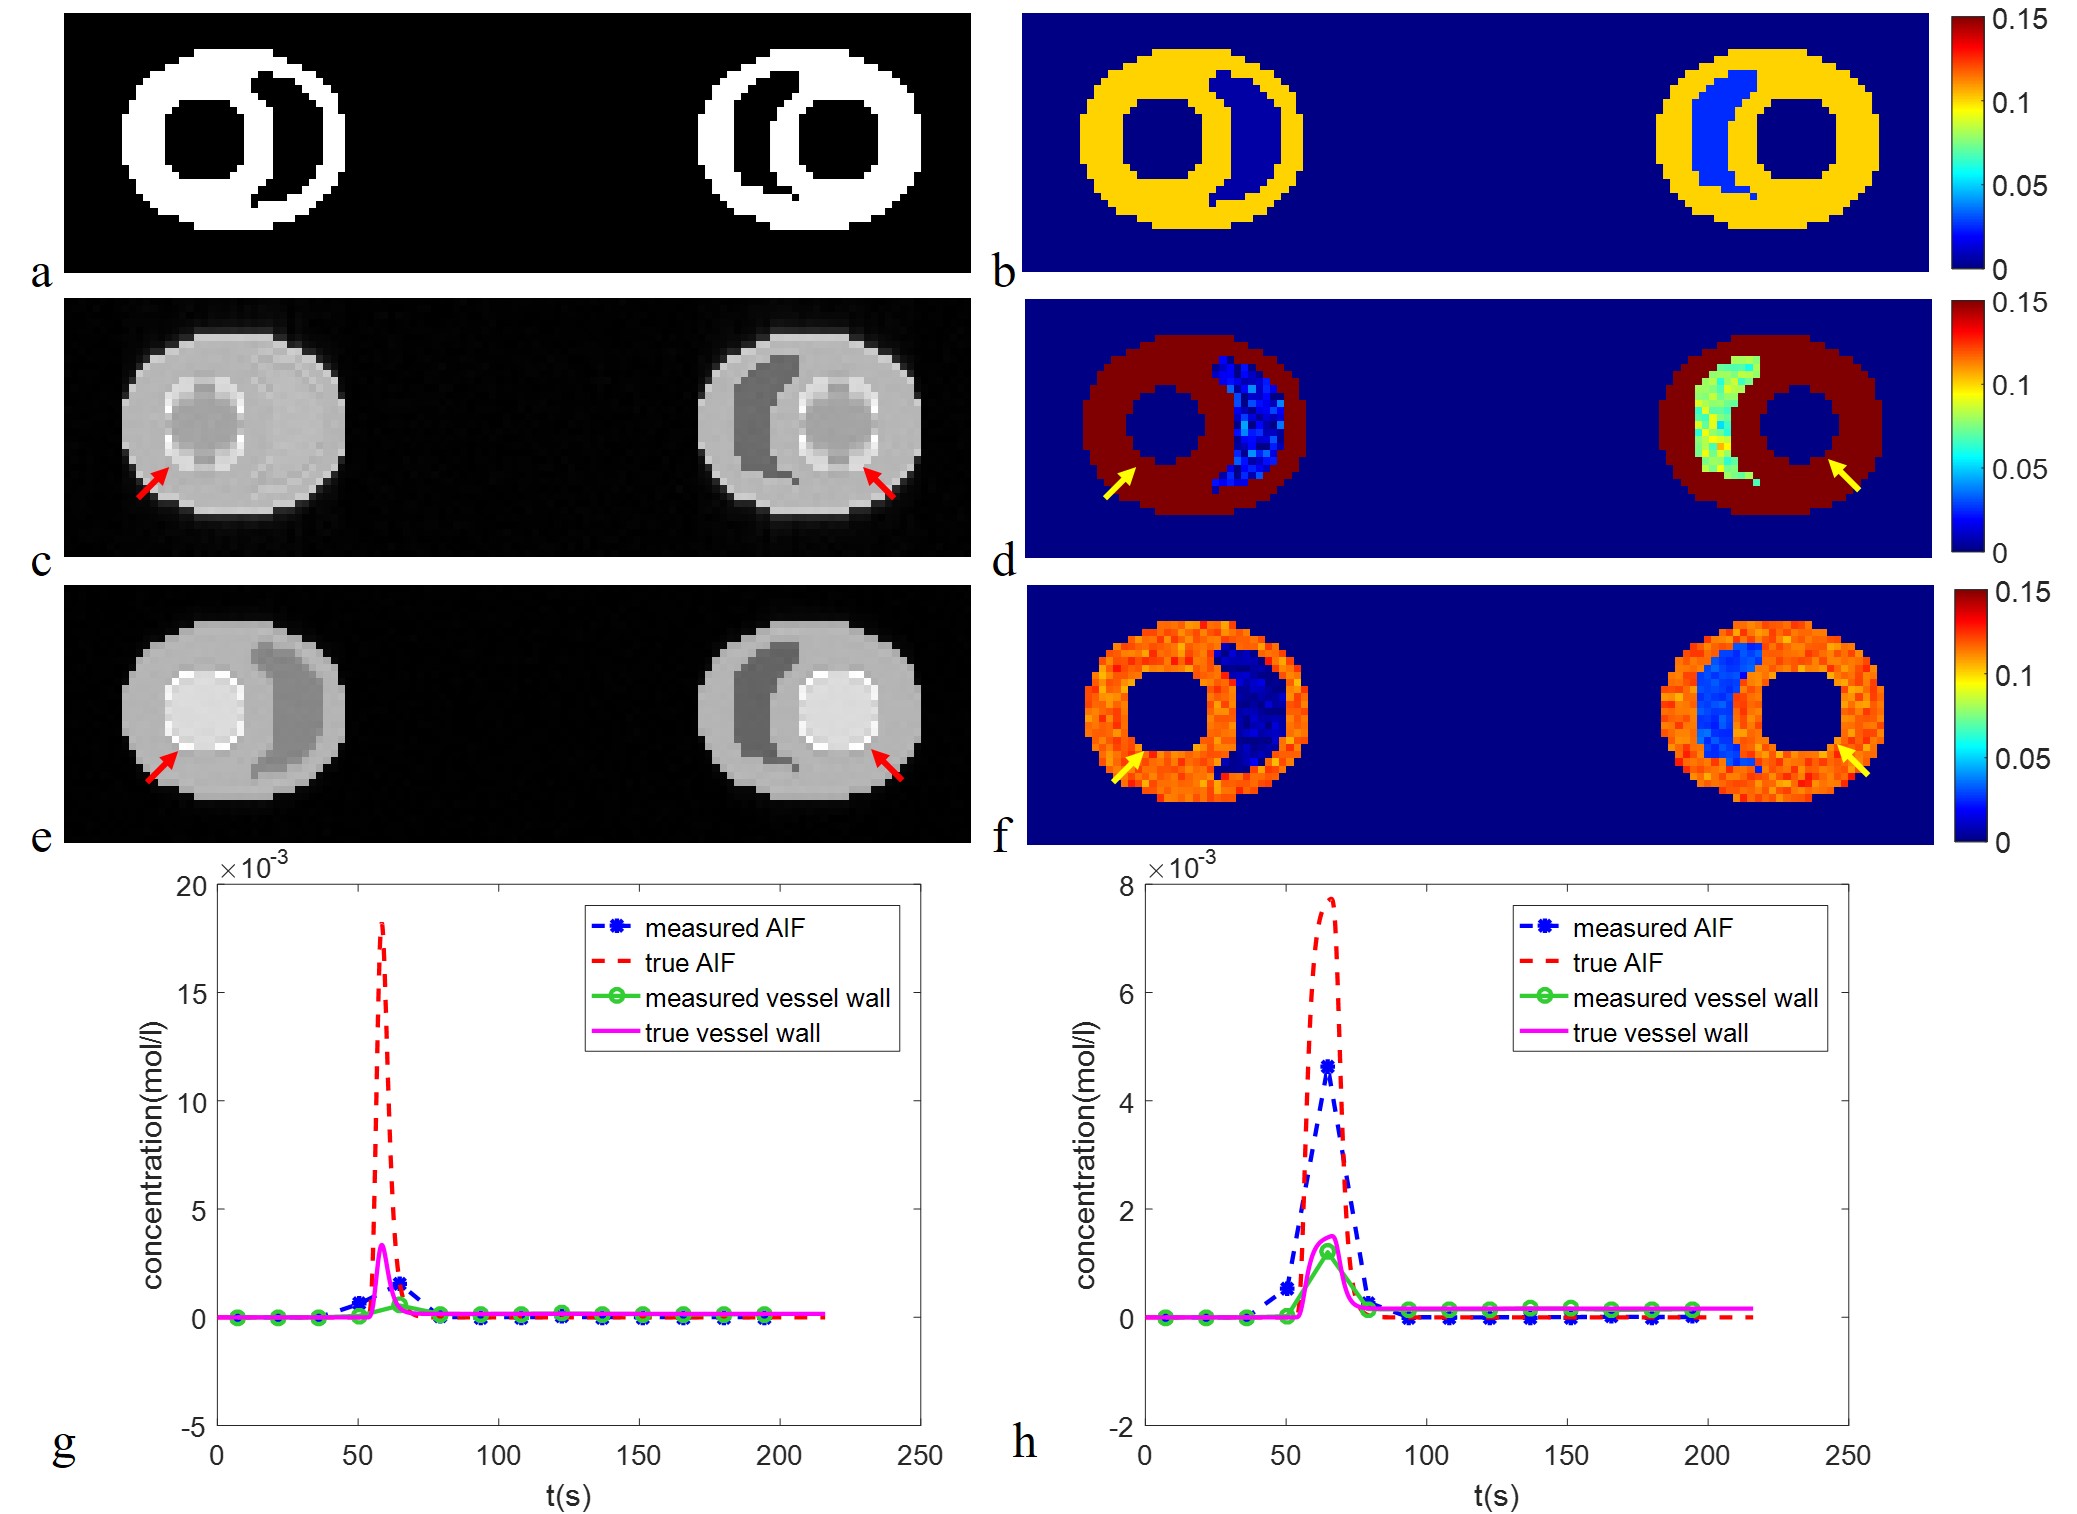
Fig 3. Typical reconstructed dynamic images (cropped), estimated Ktrans map (cropped,min-1) and the contrast concentration curves of bright-blood DCE.
a) True region of interest (ROI); b) True Ktrans map;
At the injection dose=0.1mmol/kg, effective injection rate=2mmol/s, time delay=0s: c) 5th reconstructed dynamic image; d) Estimated Ktrans map; g) Contrast concentration curves of the measured AIF, true AIF, measured vessel wall and true vessel wall;
At the injection dose=0.1mmol/kg, effective injection rate=0.5mmol/s, time delay=0s: e) 5th reconstructed dynamic image; f) Estimated Ktrans map; h) Contrast concentration curves of the measured AIF, true AIF, measured vessel wall and true vessel wall;