5030
The spiral trajectory correction effect on arterial spin labeling acquired with high-slew-rate gradient on a compact 3T scanner1Department of Radiology, Mayo Clinic, Rochester, MN, United States
Synopsis
Proper design of the arterial spin-labeled (ASL) readout trajectory can minimize signal loss, reduce artifacts, and consequently improve the quality of ASL-derived perfusion maps. High performance gradients can improve MR image quality in spiral acquisition to reduce susceptibility and off-resonance effect. However, the eddy current and the system delay can degrade image quality by causing image rotation and blurring effects. In this work, the image artifact was corrected with a truer trajectory measured by a dynamic field camera. The effects of the trajectory correction on ASL images are investigated on a low-cryogen, compact 3T MRI system.
Introduction
The quality of arterial spin-labeled (ASL)-derived perfusion map depends on various factors.1 Proper design of the ASL readout trajectory can minimize signal loss and reduce artifacts. The 3D fast spin-echo stack of spirals2 has been widely used for ASL imaging. As is well-known, the trajectory correction for the eddy current and the system delay can enhance the image quality in spiral acquisition.3,4 A low-cryogen, compact 3T MRI system equipped with high performance gradients has been reported,5-10 which can produce a maximum amplitude of 80 mT/m with a slew rate of 700 T/m/s simultaneously. In this work, the effects of the readout trajectory correction on ASL images acquired with the high performance gradients on the compact 3T are investigated.Methods
Five healthy volunteer subjects (3 male, 2 female, 30.2 ± 7.7 y.o.) were scanned on the compact 3T after obtaining written informed consent under an IRB-approved protocol.
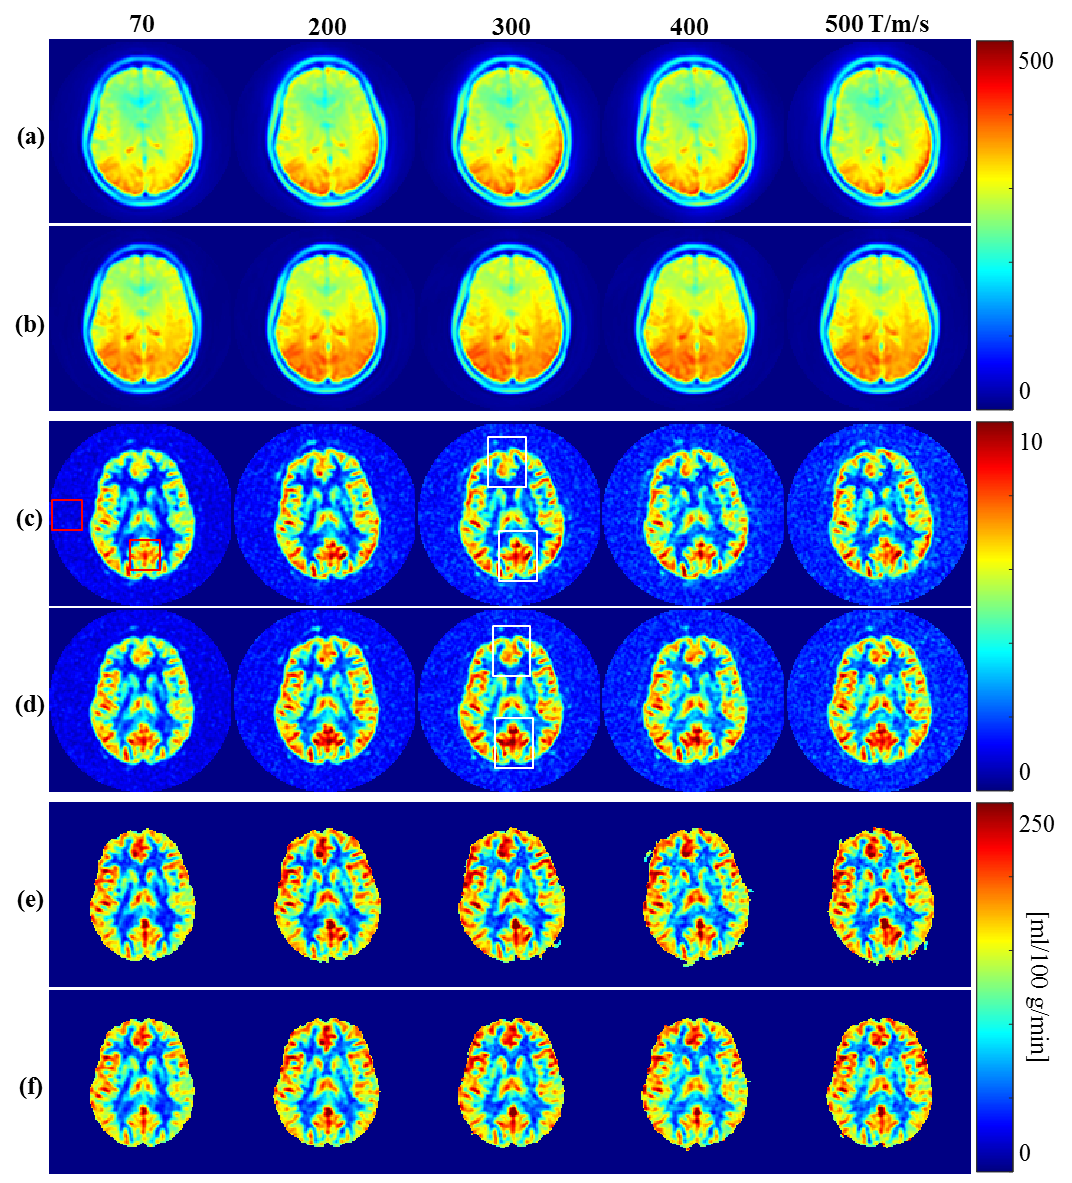
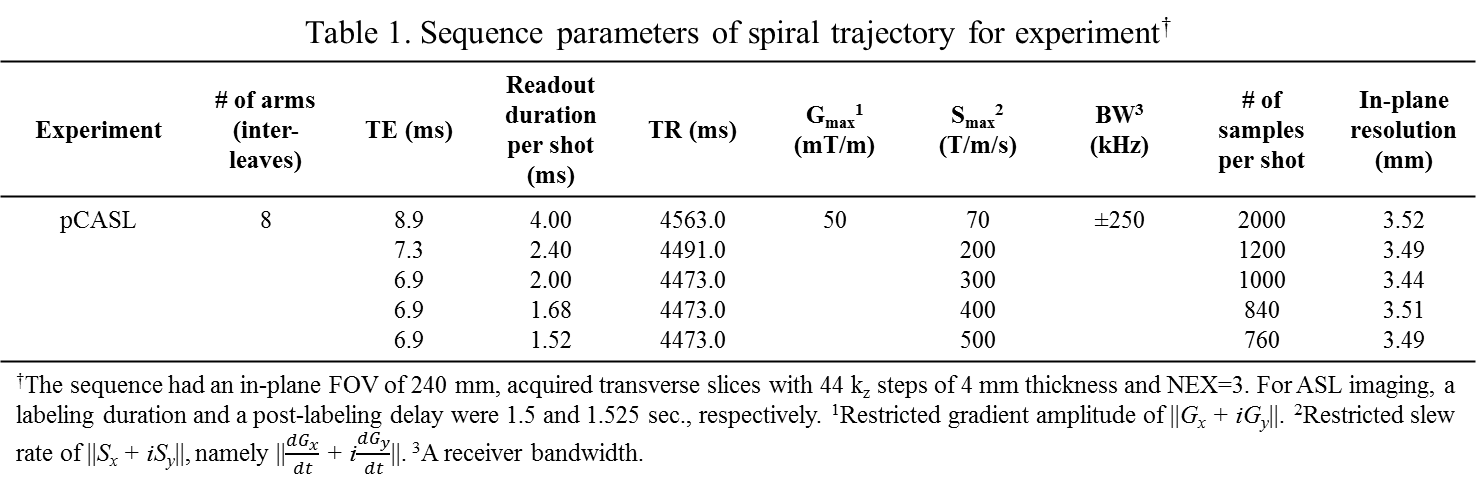
Subtractions between controlled and labeled images (ΔM) and proton-density-weighted (PDw) images were obtained with a pseudo-Continuous Arterial Spin Labeling (pCASL) sequence11,12 using a series of maximum slew rate values ($$$S_{max}$$$) as described in Table 1. The order of pCASL acquisitions was randomized for each subject. The in-plane resolution was set to approximately 3.5 mm by adjusting the number of samples. To correct the trajectory deviation,4 the actual trajectories of 1st-order k-space terms (kx & ky) were separately measured using a dynamic field camera with NMR field probes containing 19F (Skope, Zurich, Switzerland).13,14 Image reconstruction via density compensated gridding was performed with Orchestra (GE Healthcare,Waukesha,WI,US) in Matlab (The MathWorks, Inc.,Natick,MA,US). The CBF map was calculated by the following equation.1 $$CBF=\frac{6000\cdot\lambda\cdot{S}_{\Delta{M}}\cdot\exp\left(T_{Post\_labeling\_delay}/T_{1,blood}\right)}{2\cdot\alpha\cdot{T}_{1,blood}\cdot{S}_{PDw}\cdot\left(1-\exp\left(-T_{Labeling\_duration}/T_{1,blood}\right)\right)}[ml/100g/min]$$, where $$$\lambda$$$ and $$$\alpha$$$ were set to 0.9 ml/g and 0.85, respectively.1 For comparison, two ROIs (red boxes in Figure 1(c)) were placed on occipital region and in the background, respectively.
To study the effect of $$$S_{max}$$$ on CBF maps,
the trajectory-corrected PDw images
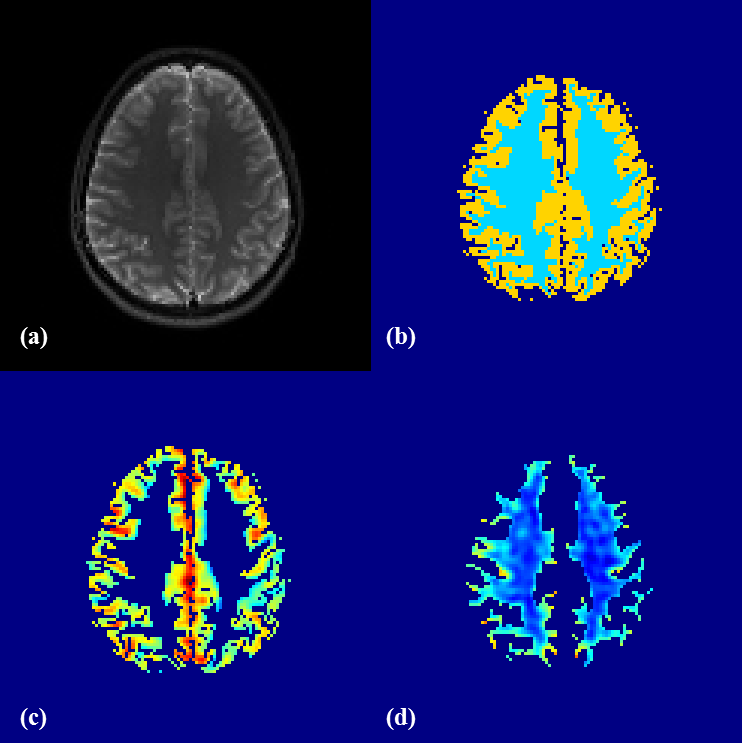
were used to realign all the other trajectory-corrected images. The T2-weighted
fast spin-echo image was co-registered with the PDw images and segmented to make masks for gray and white matter
(GM and WM) by SPM12 toolbox (Statistical Parametric Mapping, Wellcome Trust
Centre for Neuroimaging,UK) with Matlab. The perfusion SNR15 and
the CBFs on GM and WM were evaluated.
Results
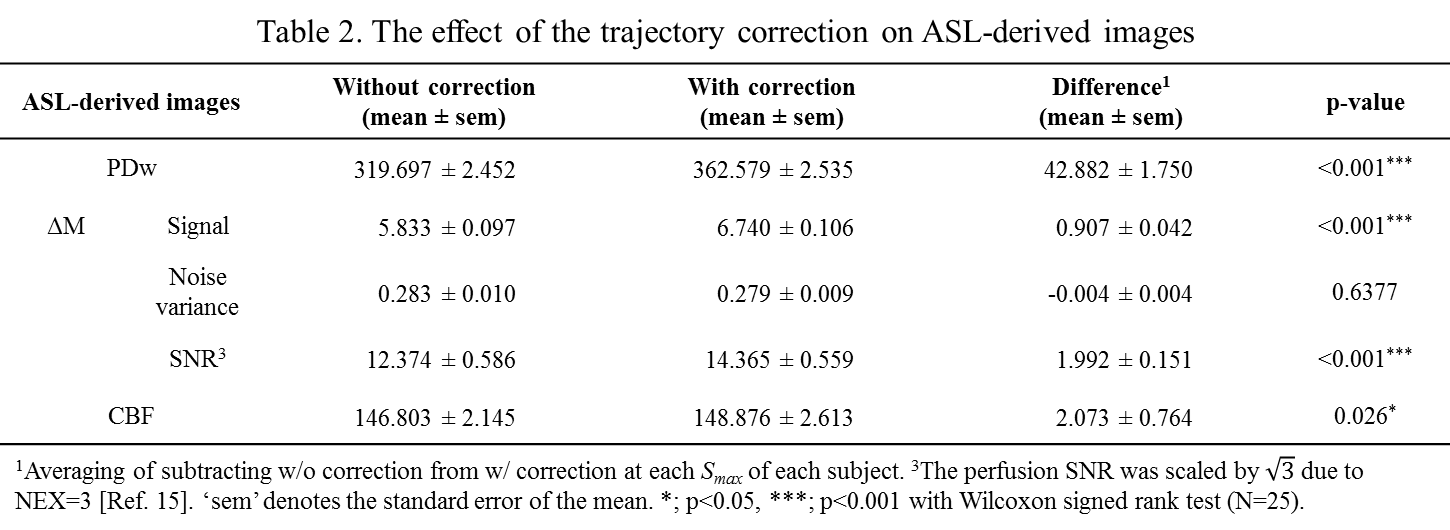
Figure 1 shows sample images of PDw, ΔM and CBF. In the images with the nominal, uncorrected trajectory, the structures in ΔM and the corresponding CBF map were rotated counterclockwise as white boxes in Figure 1(c, d). However, this artefactual rotation was corrected by accounting for the measured trajectory during reconstruction. As shown in Table 2, the trajectory correction enhanced the signal in all of ASL-related images, regardless of $$$S_{max}$$$.
Figure 2 shows examples of an anatomical image co-registered with the trajectory-corrected PDw and two masks of GM and WM. CBFs on GM and WM were evaluated, respectively.
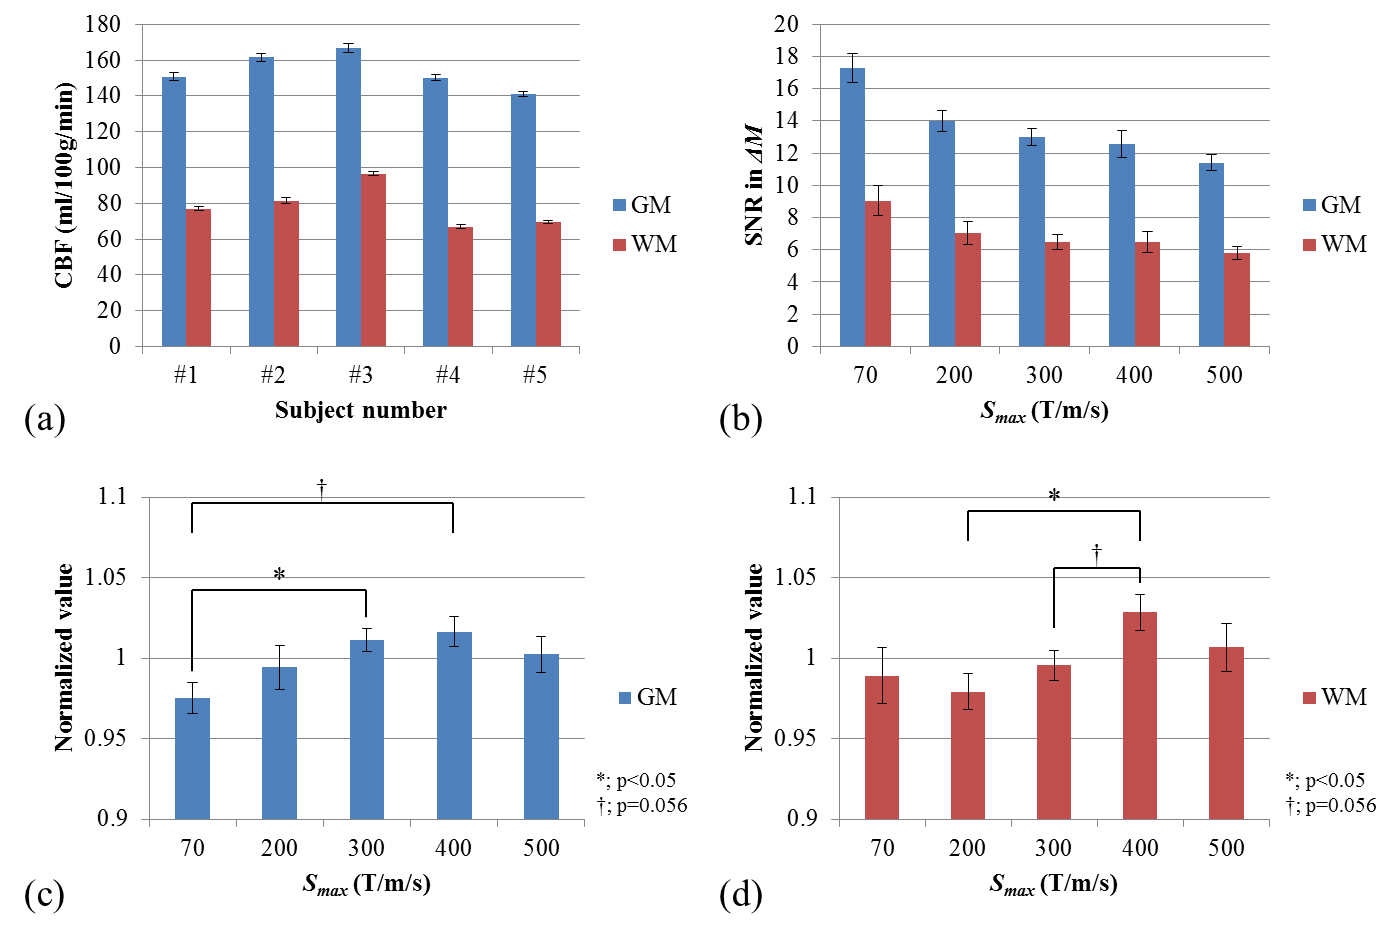
As shown in Figure 3(a), the average values of CBF on GM and WM differed from individual to individual. Thus, CBFs of GM and WM in each subject were normalized by intra-subject averages and then averaged across subjects depending on $$$S_{max}$$$. In Figure 3(c, d), statistically significant difference between $$$S_{max}$$$ of 70 and 300 was observed in CBF of GM while significant difference between in $$$S_{max}$$$ of 200 and 400 in CBF of WM.
Discussion
The effect of high gradient performance, especially the slew rate, was investigated on ASL-related images acquired with a spiral acquisition. Since a high $$$S_{max}$$$ in spiral imaging not only caused image rotation but also the shear distortion on the image, the realignment across images was performed only for the trajectory-corrected images. It appears that trajectory measurement was needed to correct the image distortion as well as to improve SNR in ΔM images.
Based on images with corrections, the effect of $$$S_{max}$$$ on CBF map was investigated. Although the perfusion SNR tended to reduce as $$$S_{max}$$$ increased as shown in Figure 3(b), the CBFs on GM and WM were slightly high when $$$S_{max}$$$ were 300 and 400 T/m/s, respectively. This could be attributed to the shorter TE enabled by high $$$S_{max}$$$, but further study will be required.
Conclusion
The trajectory-corrected ASL-related images showed improved SNR and reduced distortion, and consequently enhanced the quality of the perfusion map. We note that the trajectory only needed to be measured once, i.e., a single Skope trajectory measurement was effective in correcting the data from all subjects. Image quality can also be improved by choosing an appropriate value for the maximum slew rate for spiral trajectory.Acknowledgements
The authors thanked R Marc Lebel from GE healthcare and Ek T Tan from GE Global Research for the aid in providing pulse sequence implementation. This work was supported in part by research grant NIH U01-EB024450.References
1 Alsop, D. C. et al. Recommended implementation of arterial spin-labeled perfusion MRI for clinical applications: A consensus of the ISMRM perfusion study group and the European consortium for ASL in dementia. Magn Reson Med 73, 102-116, doi:10.1002/mrm.25197 (2015).
2 Ye, F. Q., Frank, J. A., Weinberger, D. R. & McLaughlin, A. C. Noise reduction in 3D perfusion imaging by attenuating the static signal in arterial spin tagging (ASSIST). Magn Reson Med 44, 92-100 (2000).
3 Bhavsar, P. S., Zwart, N. R. & Pipe, J. G. Fast, variable system delay correction for spiral MRI. Magnetic Resonance in Medicine, doi:10.1002/mrm.24730 (2014).
4 Kang, D. et al. Artifact correction in spiral trajectory with high gradient performance. Submitted in ISMRM 2019 (Abstract ID 4397).
5 Lee, S. K. et al. Peripheral nerve stimulation characteristics of an asymmetric head-only gradient coil compatible with a high-channel-count receiver array. Magn Reson Med 76, 1939-1950, doi:10.1002/mrm.26044 (2016).
6 Foo, T. K. F. et al. Lightweight, compact, and high-performance 3T MR system for imaging the brain and extremities. Magn Reson Med 80, 2232-2245, doi:10.1002/mrm.27175 (2018).
7 Weavers, P. T. et al. Technical Note: Compact three-tesla magnetic resonance imager with high-performance gradients passes ACR image quality and acoustic noise tests. Med Phys 43, 1259-1264, doi:10.1118/1.4941362 (2016).
8 Weavers, P. T. et al. B0 concomitant field compensation for MRI systems employing asymmetric transverse gradient coils. Magn Reson Med 79, 1538-1544, doi:10.1002/mrm.26790 (2018).
9 Tao, S. et al. Gradient nonlinearity calibration and correction for a compact, asymmetric magnetic resonance imaging gradient system. Phys Med Biol 62, N18-N31, doi:10.1088/1361-6560/aa524f (2017).
10 Tao, S. et al. Gradient pre-emphasis to counteract first-order concomitant fields on asymmetric MRI gradient systems. Magn Reson Med 77, 2250-2262, doi:10.1002/mrm.26315 (2017).
11 Dai, W., Garcia, D., de Bazelaire, C. & Alsop, D. C. Continuous flow-driven inversion for arterial spin labeling using pulsed radio frequency and gradient fields. Magn Reson Med 60, 1488-1497, doi:10.1002/mrm.21790 (2008).
12 Maleki, N., Dai, W. & Alsop, D. C. Optimization of background suppression for arterial spin labeling perfusion imaging. MAGMA 25, 127-133, doi:10.1007/s10334-011-0286-3 (2012).
13 Kasper, L. et al. Rapid anatomical brain imaging using spiral acquisition and an expanded signal model. NeuroImage, doi:10.1016/j.neuroimage.2017.07.062 (2018).
14 Dietrich, B. E. et al. A field camera for MR sequence monitoring and system analysis. Magn Reson Med 75, 1831-1840, doi:10.1002/mrm.25770 (2016).
15 Xu, G. et al. Reliability and precision of pseudo-continuous arterial spin labeling perfusion MRI on 3.0 T and comparison with 15O-water PET in elderly subjects at risk for Alzheimer's disease. NMR Biomed 23, 286-293, doi:10.1002/nbm.1462 (2010).
Figures