5029
Reproducibility of Selective Localised T2-Relaxation-Under-Spin-Tagging (SL-TRUST) for Regional Cerebral Oxygen Extraction Fraction1Wellcome Centre for Integrative Neuroimaging, University of Oxford, Oxford, United Kingdom
Synopsis
In this study, we offer preliminary results of a reproducibility study on a novel sequence: Selective Localised TRUST (SL-TRUST). SL-TRUST is an MR acquisition method for acquiring spatially specific cerebral tissue oxygen extraction fraction (OEF) values through measurements of venous blood T2 in the superior sagittal sinus. Three subjects underwent four scan sessions over a seven day period and the inter/intra session variability of SL-TRUST was evaluated. The resulting venous blood T2 and tissue OEF values from spatially specific regions (a single hemisphere, and a 70x80x80mm tissue region) are compared to whole brain measures obtained using TRUST.
Introduction
Abnormal variations in brain tissue oxygen extraction fraction (OEF) can be an important indicator of cerebrovascular distress and cell death. Most current MR methods for measuring OEF, such as T2-relaxation-under-spin-tagging (TRUST)1 are limited to global (whole-brain) measurements, however there is a drive to develop methods (e.g. QUIXOTIC) which can acquire spatially specific measurements, for cases where the damage to tissue is highly localised such as ischemic stroke. We have developed and optimized an MR sequence based on TRUST, Selective Localised TRUST, which can achieve spatially specific venous blood T2 measurements, decoded in the superior sagittal sinus (SSS) vein2. This allows OEF measurements from a single hemisphere (RHS) and from an ~80x70x80mm tissue region in the territory of the middle cerebral artery (MCA) to be acquired.
In this study we verified the temporal and spatial reproducibility of SL-TRUST. The intra/inter session variability (Coefficients of Variability, CoV) of SL-TRUST T2 values were evaluated in three healthy controls and compared to the ground truth value of TRUST whole-brain T2. Using an additional measure of venous blood T1 to estimate blood hematocrit (hct), T2 is converted to OEF values.
Theory
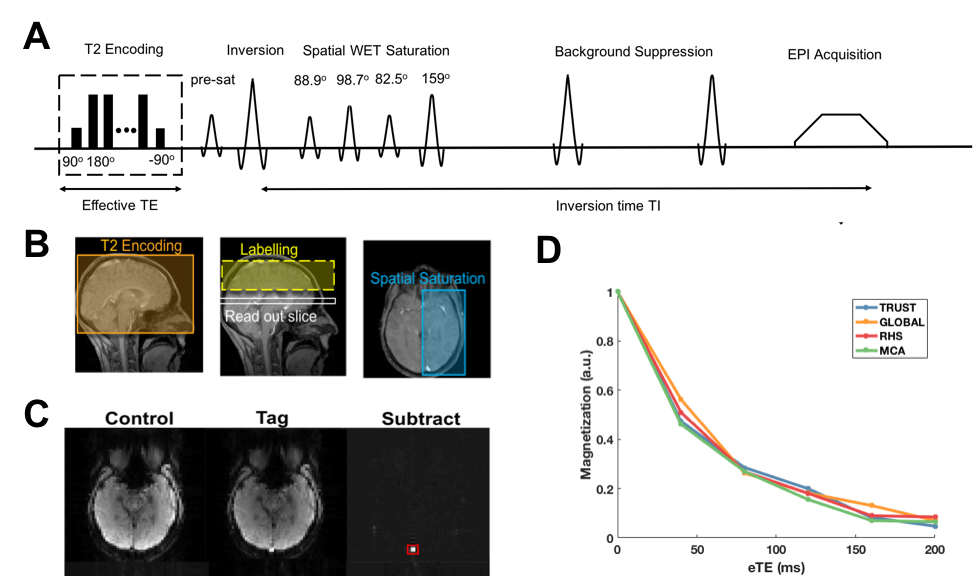
SL-TRUST applies a T2-weighting to the blood spins whilst still in the tissue vasculature, which is subsequently decoded in the SSS after a delay TI2. Spatial specificity is achieved using a cosine-modulated multi-flip angle WET saturation scheme3, thus the only signal measured in the SSS are those from venous spins that originate from regions outside the saturation areas, Fig.1. The venous blood T2 measurement is converted to a measure of OEF using Eq.1: $$$\frac{1}{T_2} = A + B \cdot{OEF} + C \cdot{OEF^2}$$$ where $$$A$$$, $$$B$$$, and $$$C$$$ are derived from previous experimental data and are dependent on blood hct4. We utilise a multi-TI inversion recovery with slice selective background suppression to measure venous blood T1 in the SSS and use Eq.2 to estimate subject-specific hct at 3T: $$$\frac{1}{T_1} = (0.7 \pm 0.11) + (0.27 \pm 0.05)$$$.
Method
Data were acquired on 3 healthy participants (mean age 33, 2F) on a 3T Siemens Verio, 32 channel head receive coil system (Erlangen, Germany). Details of data post processing and T2 fitting have been described previously2.
The MR acquisition protocol took 10 minutes and included (in a randomised order):
- Whole-brain TRUST1
- Global (whole-brain) SL-TRUST
- Hemispherical SL-TRUST
- Tissue region approximately 80x80x70 mm contained within the MCA territory using SL-TRUST
The values from each of the above acquisitions are given the identifiers TRUST, GLOBAL, RHS, and MCA, respectively. Each participant was scanned on 4-5 separate scan sessions within a 7-day period, with a minimum gap of 24hrs. The above protocol was also repeated both with and without subject repositioning during scan sessions, thus allowing evaluation of both CoVintrasession and CoVintersession6. During the first scan session an additional T1 measurement was acquired in order to estimate individual hct levels.
Results
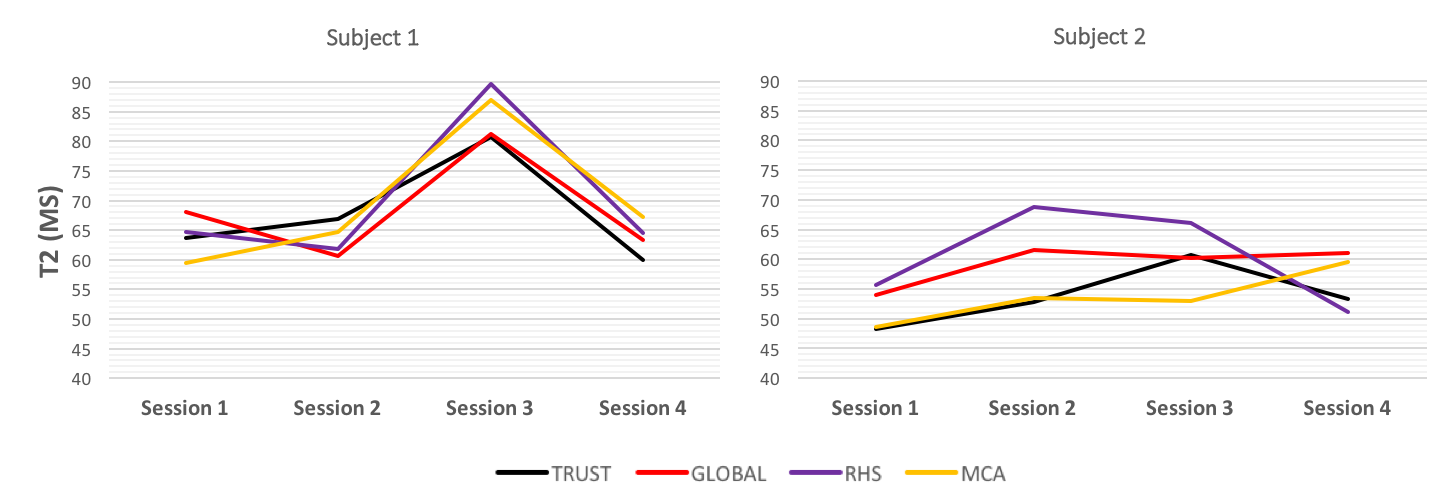
Variations in T2 are shown across multiple scan sessions, Fig. 2, with some visible differences of up to 10ms. One session showed a subject with a 20ms fluctuation in T2 in comparison to earlier and later scan sessions, which could be due to physiological changes such as increased blood flow. An additional measure of cerebral blood flow would be required to confirm this, and would be included in any clinical study into the sensitivity of SL-TRUST to changes in OEF. A higher than expected intra-session variability could also be explained by physiological changes during the scan, such as the participant falling asleep.
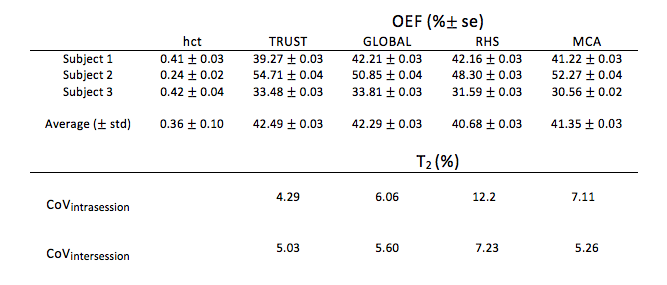
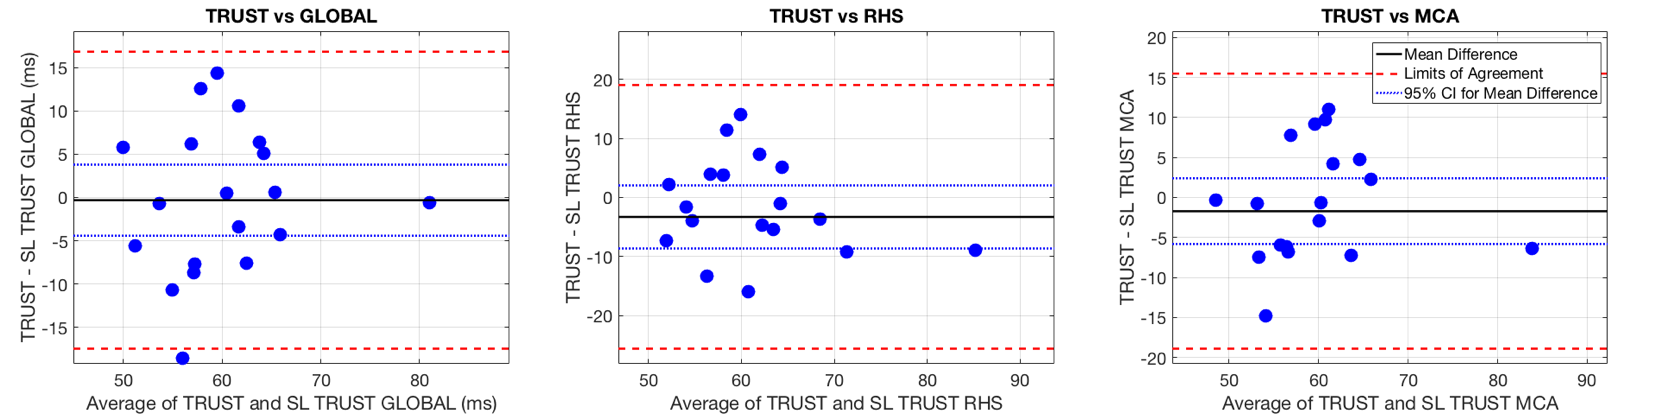
The mean OEF values for spatially specific SL-TRUST agree well with those obtained using whole brain TRUST across all subjects, Table 1. Bland-Altman plot analysis, Fig. 3, reveals that whilst there is little to no systematic bias between the two methods, they are not entirely in agreement.
Conclusion
Whilst there is some unexplained variation in T2 across sessions, within the subjects this variation seems consistent across the acquisitions. In comparison to previous reproducibility studies using TRUST we find a similar intersession variability but a higher intrasession variability6.
These are preliminary results in an ongoing reproducibility study from which we aim to improve the statistical power of our measurements. Future projects will involve assessing the sensitivity of the method to changes in cerebral OEF, either in patients, or in healthy controls using a gas challenge.
Overall, previous steps taken to mitigate SNR barriers, such as static tissue nulling strategies, and the use of an effective WET spatial saturation scheme to isolate regional blood spins3, appear to allow the acquisition of spatially-specific measures of venous blood T2 and thus cerebral OEF, with a similar accuracy as TRUST.
Acknowledgements
This work was supported by funding from the Engineering and Physical Sciences Research Council (EPSRC) and Medical Research Council (MRC) [grant number EP/L016052/1], the Dunhill Medical Trust and the Royal Academy of Engineering.References
1. Hanzhang Lu and Yulin Ge. Quantitative evaluation of oxygenation in venous vessels using t2- relaxation-under-spin-tagging mri. Magnetic resonance in medicine, 60(2):357–363, 2008.
2. Caitlin O'Brien, Thomas Okell and Peter Jezzard. Regional Oxygen Extraction Fraction Measurements in the Middle Cerebral Artery Territory using Selective Localised T2-Relaxation-Under-Spin-Tagging (SL-TRUST). In: Proceedings of the 26th Annual ISMRM Scientific Meeting, Paris, France, ISMRM, 2017.
3. Gallichan D. Measuring cerebral blood flow using arterial spin labelling with magnetic resoance imaging (unpublished doctoral thesis). University of Oxford, United Kingdom, 2007.
4. Xavier Golay, M Johanna Silvennoinen, Jinyuan Zhou, Chekesha S Clingman, Risto A Kauppinen, James J Pekar, and Peter van Zij. Measurement of tissue oxygen extraction ratios from venous blood t2: increased precision and validation of principle. Magnetic resonance in medicine, 46(2):282–291, 2001
5. Shimada, K., Nagasaka, T., Shidahara, M., Machida, Y., & Tamura, H. In vivo measurement of longitudinal relaxation time of human blood by inversion-recovery fast gradient-echo MR imaging at 3T. Magnetic Resonance in Medical Sciences, 11(4), 265-271, 2012.
6. Peiying Liu, Feng Xu, and Hanzhang Lu. Test-Retest Reproducibility of a Rapid Method to Measure Brain Oxygen Metabolism. Magnetic Resonance in Medicine, 69:675-681, 2013
Figures