5028
In vivo quantification of arterial blood longitudinal relaxation time during graded hyperoxia at 3T using an intermittent cuff occlusion paradigm1Department of Radiology, University of Pennsylvania, Philadelphia, PA, United States
Synopsis
Breathing hyperoxic gas results in dissolved oxygen in blood plasma, shortening T1 of arterial blood (T1a). Quantification of T1a is difficult due to blood flow between the inversion and acquisition. Here, this problem is overcome using an intermittent cuff occlusion protocol to suspend flow in the femoral artery and vein. An inversion recovery-prepared bSSFP sequence was used to measure T1a during normoxia (FiO2=21% O2) and graded hyperoxia (FiO2~33%, 48%, 55%, 100% O2) in ten healthy subjects at 3T. During normoxia, T1a was 1819±142ms, which was shortened to 1522±100ms during maximal hyperoxia, and the relationship between T1a and PETO2 was linear.
Introduction
Hyperoxia gas mixture breathing, defined as fractional oxygen in inspired air (FiO2)>20.9%, is an isometabolic stimulus commonly used for calibrated fMRI studies1,2. Hyperoxia increases the oxygen carrying capacity of blood via oxygen dissolved in plasma. Oxygen itself is paramagnetic; therefore, the increased dissolved oxygen, which is proportional to FiO2, shortens the longitudinal relaxation time (T1) of blood3. Accurate knowledge of arterial blood T1 (T1a) is especially important for quantification of perfusion via arterial spin labeling (ASL)4.
Typically, in vivo quantification of T1a using traditional inversion recovery (IR) methods is not feasible due to transit of blood between the inversion pulse and image acquisition. Here, the problem of flow is overcome using an intermittent arterial occlusion protocol where blood flow is suspended in the femoral artery and vein during image acquisition, thereby allowing for quantification of T1a in vivo using standard methods.
Methods
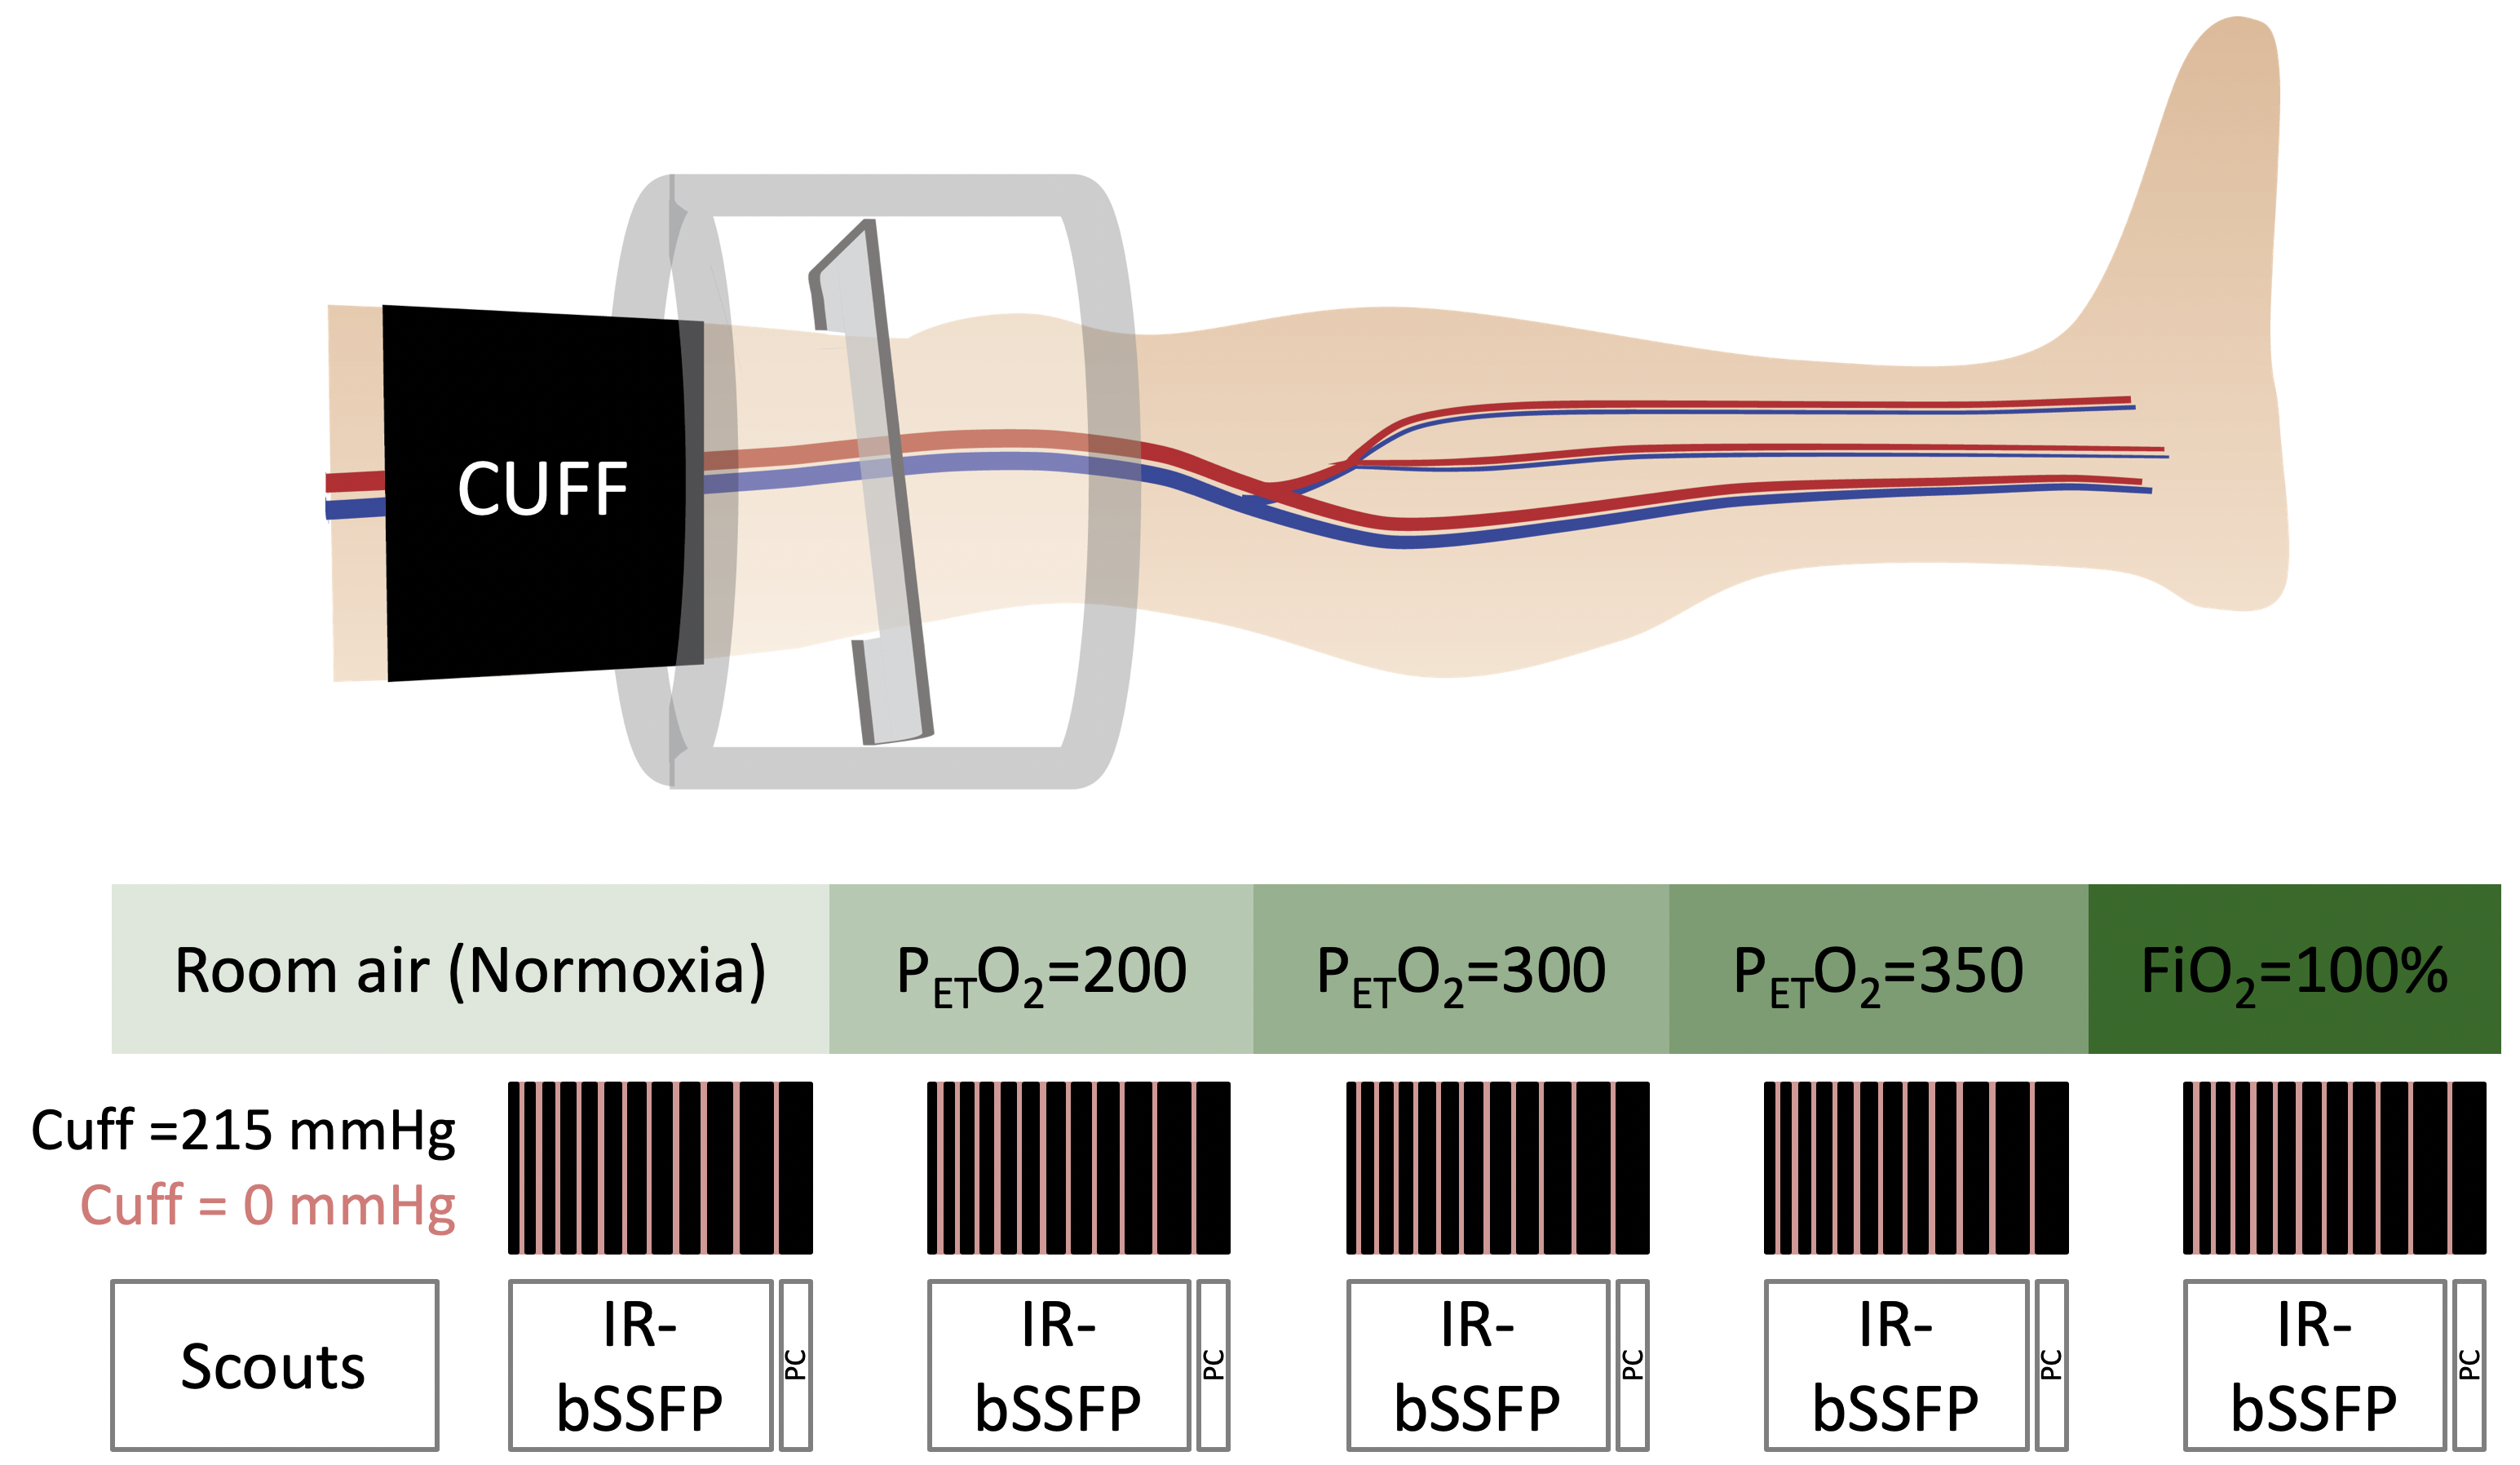
Experiment: In this IRB approved study, data were acquired at 3T (Siemens) in ten subjects (30.5±3.8 years, 6 male). Figure 1 summarizes the experimental protocol. Subjects were supine with their right leg centered in an 8ch transmit-receive knee coil. A pneumatic tourniquet (Hokanson) was secured around the thigh, and pressure in the cuff was alternated between 215mmHg (inflated) and 0mmHg (deflated) during the image acquisition, yielding intermittent arterial occlusion. The image acquisition plane was prescribed distal to the cuff, perpendicular to the femoral artery to mitigate partial volume effects. For each level of hyperoxia, an IR-bSSFP sequence (written in SequenceTree5) was used for data collection, and pressure in the cuff was rapidly deflated and re-inflated during the 8.3 s recovery time between bSSFP acquisition and inversion.
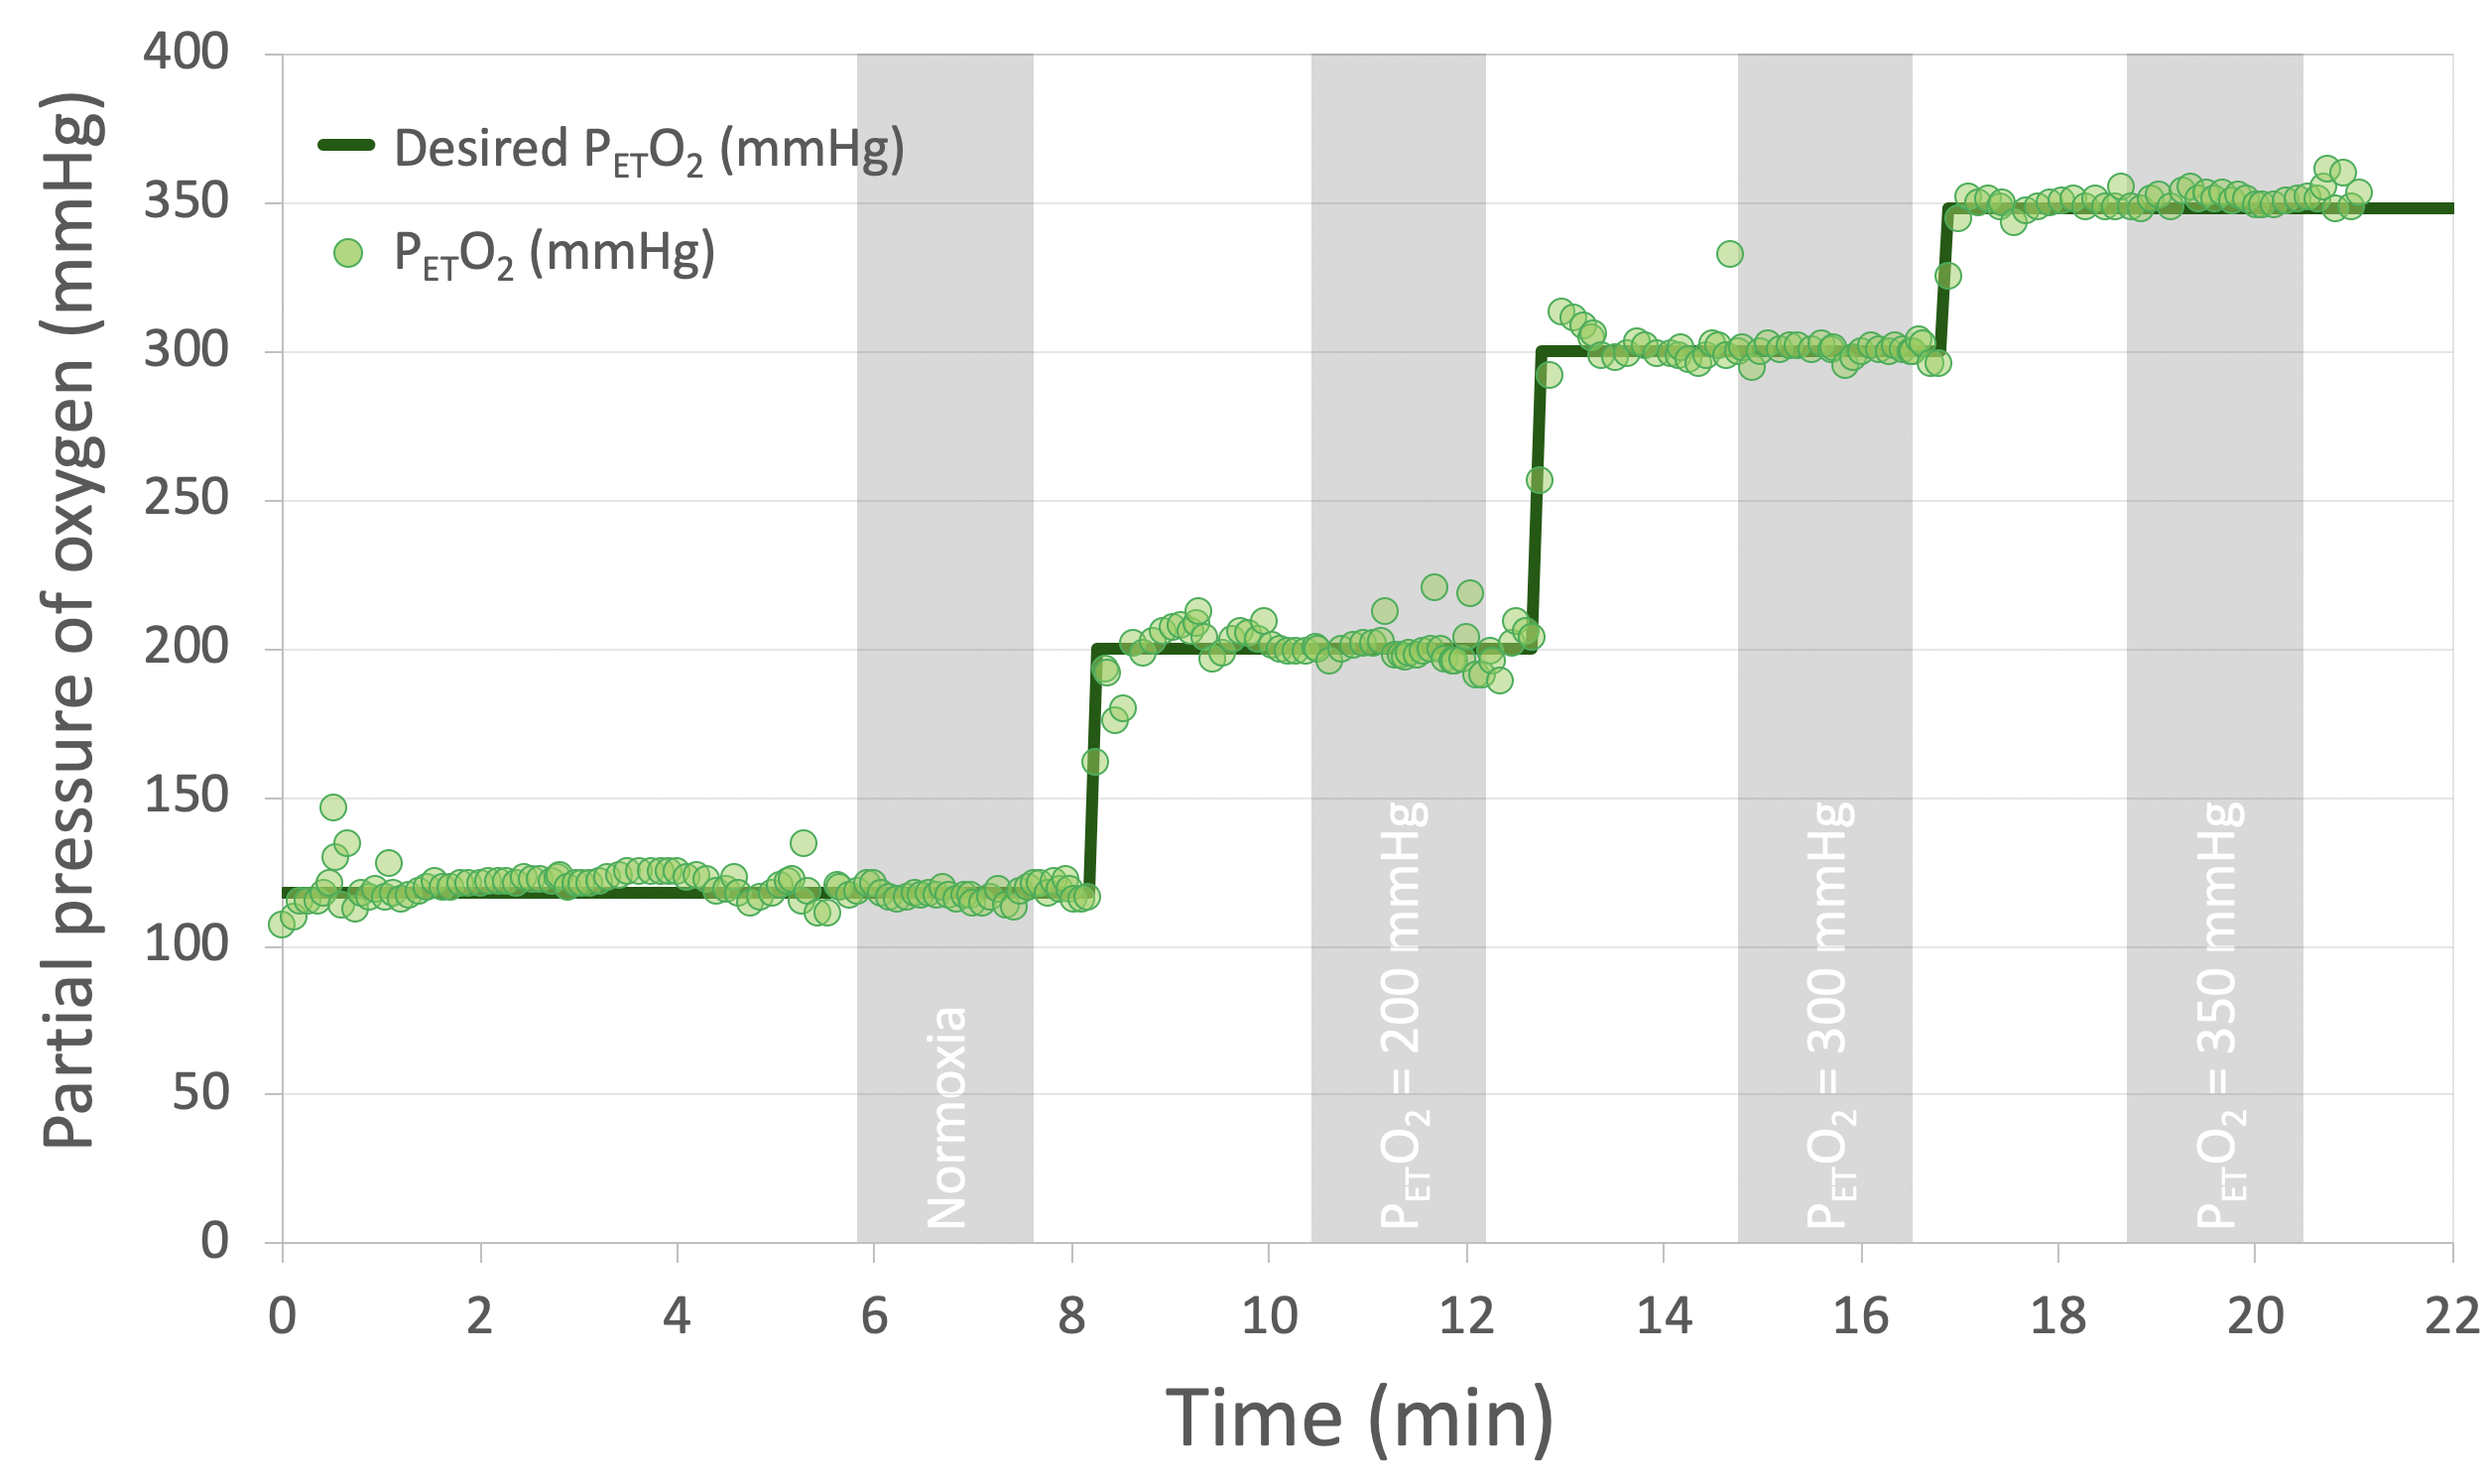
Hyperoxia levels were: (1) normoxia (FiO2~21%, partial pressure of end tidal oxygen (PETO2)=113mmHg), (2) PETO2=200mmHg (FiO2~33%), (3) PETO2=300mmHg (FiO2~48%), (4) PETO2=350mmHg (FiO2~55%), and (5) FiO2=100% (PETO2~670mmHg) (Figure 2). Hyperoxic gas was delivered via a two-way non-rebreathing valve with input from the RespirAct Gas Control System (Thornhill Research) for graded hyperoxia, or 100L Douglas bag for 100% hyperoxia. Hematocrit was measured at the end of the experiment.
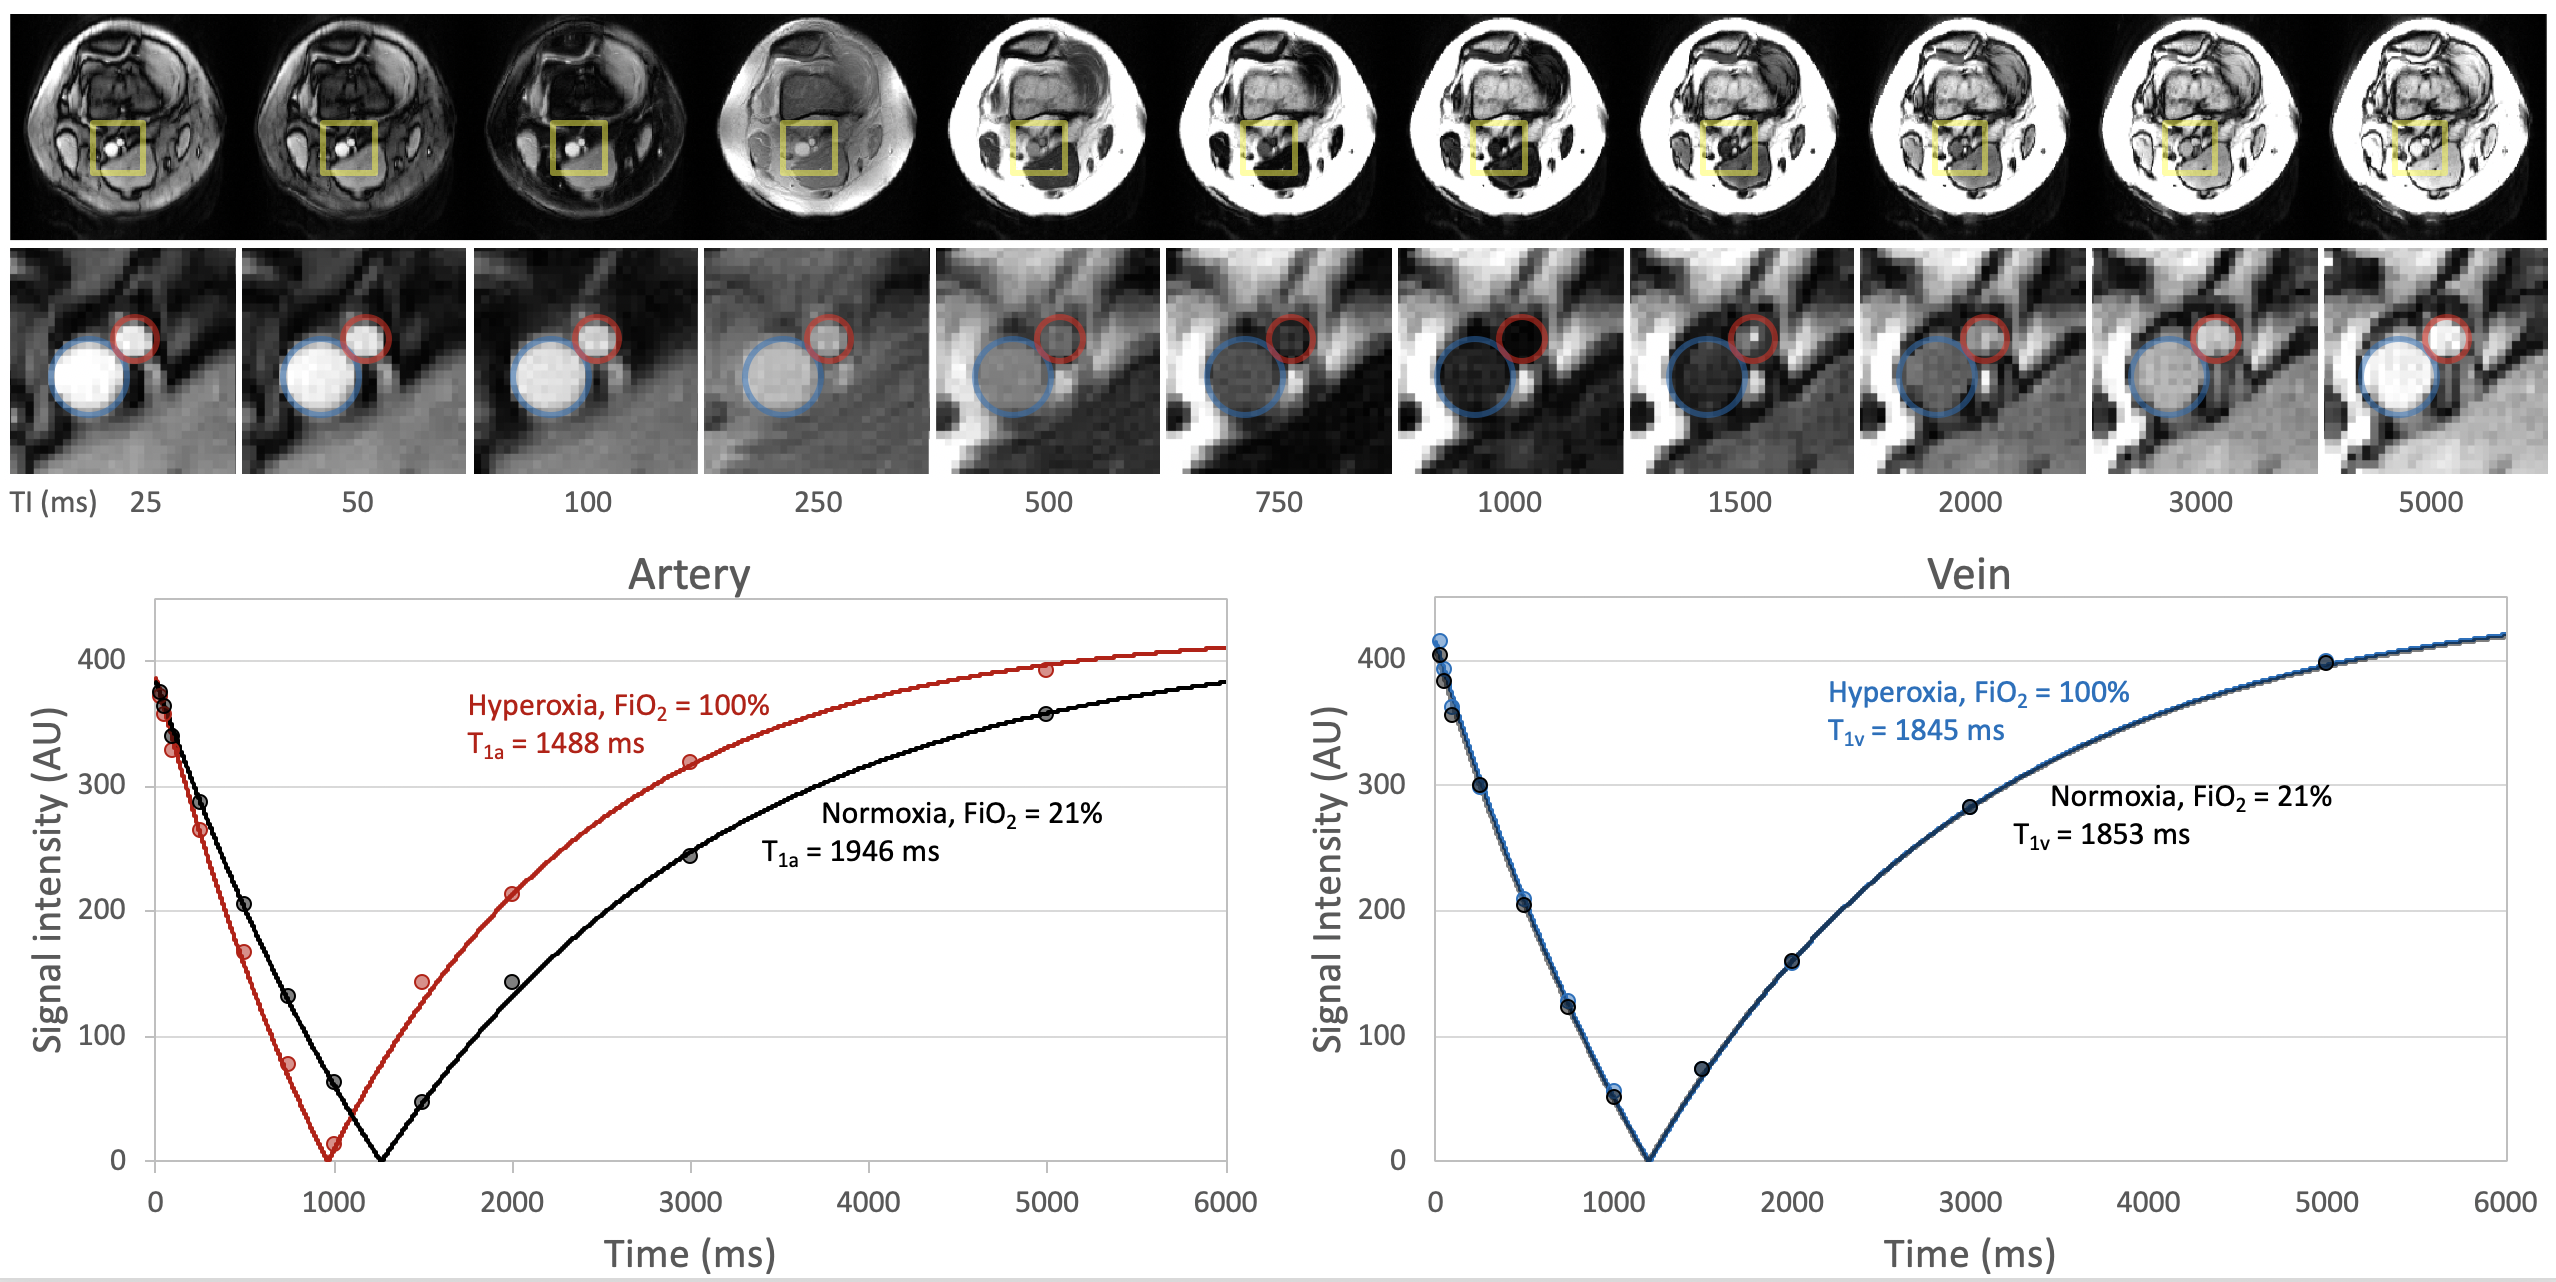
Sequence: IR-bSSFP sequence parameters include: FOV=160×160mm2, slice thickness=8mm, resolution=1×1mm2, bSSFP TR/TE=3.50/1.75ms, flip angle=60°, linear ramp catalyzation, bSSFP duration=360ms, inversion times (TI)=25, 50, 100, 250, 500, 750, 1000, 1500, 2000, 3000, 5000 ms, recovery time=8.3s, total scan time=109s. Immediately after the last TI, the cuff was deflated and inflated a final time, and phase contrast data were acquired to confirm flow suspension.
Analysis: Regions of interest (ROIs) in the femoral artery (and vein, if visible) were drawn on the IR-bSSFP images and a three-parameter fit6,7 was used to estimate T1 for each condition in each subject.
Results
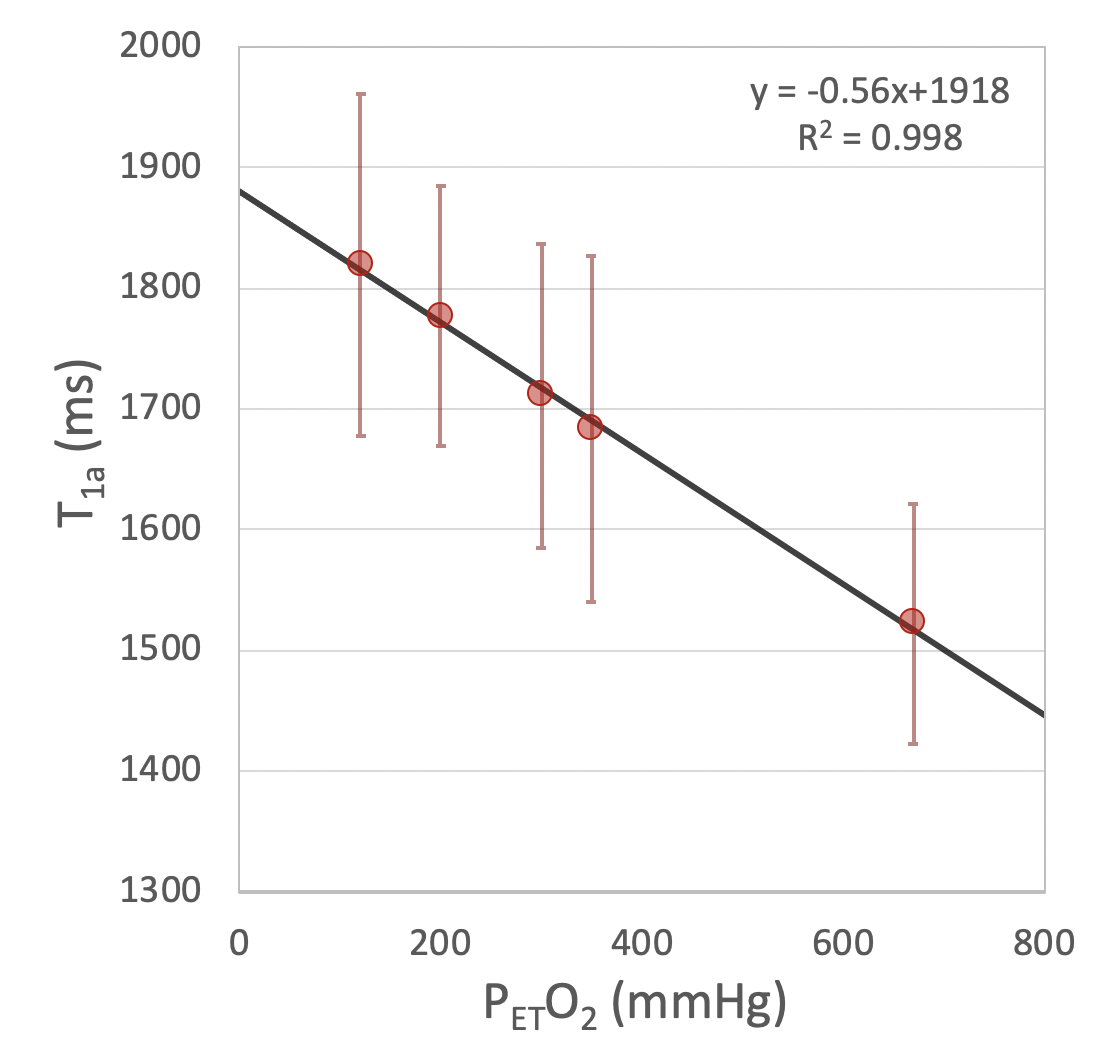
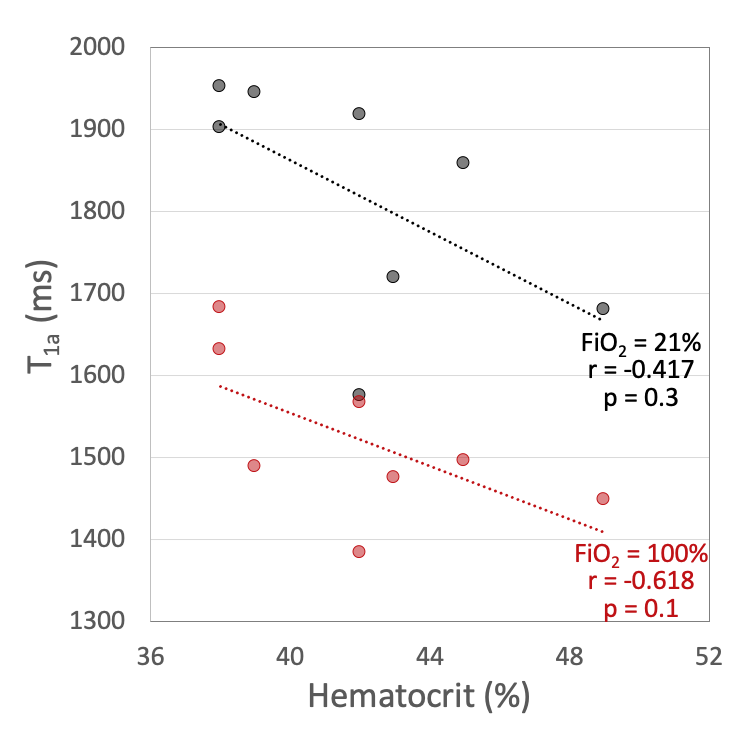
In two subjects, inter-image motion precluded accurate analysis. In another subject, the RespirAct system was not functioning properly, thus data were obtained during normoxia and 100% hyperoxia only. Figure 3 shows images in a representative subject, along with measured data and T1 fit. T1a was significantly negatively correlated with PETO2 (Figure 4), while T1 of venous blood remained relatively constant in the 5 subjects in which it was measurable (T1v=1799±291ms). Mean T1a was 1819±142ms during normoxia, which shortened to 1522±100ms during the maximal hyperoxia stimulus. Some, but not all of the inter-subject variation in T1a could be explained by hematocrit (Figure 5).Discussion
A previous pilot study investigated use of a continuous arterial occlusion, however we noticed that the artery became progressively smaller throughout the image series, likely due to reduced intra-arterial pressure distal to the cuff. Therefore, even though arterial saturation should remain constant in stagnant arterial blood (since oxygen extraction occurs in the capillary bed), we opted to use an intermittent arterial flow suspension protocol to maintain sufficient vessel size.
The hyperoxic T1a reported herein is in good agreement with previous studies that have estimated T1a using unconventional ASL-based methods (1500±40ms in rats8 and 1490±90ms in humans9 at 100% FiO2). There was no change in venous blood T1 during hyperoxia, as expected since plasma-dissolved oxygen is negligible in venous blood10. In this relatively small sample, a significant correlation was not observed between hematocrit and T1a, however, it is expected that with increased power, this known association would be observed4. The quantified normoxic T1a is in fair agreement with prior reports6,7.
Conclusion
Use of a flow suspension protocol allows measurement of arterial T1 in vivo with an inversion recovery sequence. Although T1a is determined in the femoral artery, this value should be representative of blood throughout the arterial circulation. The precise knowledge of T1a will provide more accurate quantification of the cerebral perfusion response to hyperoxia using ASL.Acknowledgements
This work was supported by NIH Grants R21 EB022687 and T32 EB020087.References
- Chiarelli PA, Bulte DP, Wise R, Gallichan D, Jezzard P. A calibration method for quantitative BOLD fMRI based on hyperoxia. NeuroImage. 2007;37(3):808-820.
- Lajoie I, Tancredi FB, Hoge RD. The impact of inspired oxygen levels on calibrated fMRI measurements of M, OEF and resting CMRO2 using combined hypercapnia and hyperoxia. PLoS ONE. 2017;12(3): e0174932.
- Tadamura E, Hatabu H, Li W, Prasad Pottumarthi V, Edelman Robert R. Effect of oxygen inhalation on relaxation times in various tissues. J Magn Reson Imaging. 1997;7(1):220–225.
- Detre JA, Leigh JS, Williams DS, Koretsky AP. Perfusion imaging. Magn Reson Med. 1992;23(1):37–45.
- Magland JF, Li C, Langham MC, Wehrli FW. Pulse sequence programming in a dynamic visual environment: SequenceTree. Magn Reson Med. 2016; 75(1)257-265.
- Wu WC, Jain V, Li C, Giannetta M, Hurt H, Wehrli FW, Wang DJ. In vivo venous blood T1 measurement using inversion recovery true-FISP in children and adults. Magn Reson Med. 2010;64(4):1140–1147.
- Lu H, Clingman C, Golay X, van Zijl PCM. Determining the longitudinal relaxation time (T1) of blood at 3.0 Tesla. Magn Reson Med. 2004;52(3):679–682.
- Pilkinton DT, Hiraki T, Detre JA, Greenberg JH, Reddy R. Absolute cerebral blood flow quantification with pulsed arterial spin labeling during hyperoxia corrected with the simultaneous measurement of the longitudinal relaxation time of arterial blood. Magn Reson Med. 2011;67(6):1556–1565.
- Siero JCW, Strother MK, Faraco CC, Hoogduin H, Hendrikse J, Donahue MJ. In vivo quantification of hyperoxic arterial blood water T1. NMR Biomed. 2015;28(11):1518–1525.
- Dunn JF, Nwaigwe CI, Roche M. Measurement of arterial, venous, and interstitial pO2 during acute hypoxia in rat brain using a time-resolved luminescence-based oxygen sensor. Adv Exp Med Biol. 1999;471:43-48.
Figures