5026
Optimizing MRF-ASL Scan Design towards Precise Quantification of Hemodynamic Properties in Cerebrovascular Disorders1University of Michigan, Ann Arbor, MI, United States
Synopsis
We investigate an optimization method to make fast, precise quantification of hemodynamic and tissue properties from an MRF ASL scan more robust to their respective feasible ranges, particularly when conditions pertaining to cerebrovascular disorders are included in consideration. We further validate our methods on synthetic and healthy human subject data.
Purpose
Multiparametric hemodynamic estimates obtained by combining ASL and MR Fingerprinting can be helpful in the comprehensive diagnosis and treatment planning of several cerebrovascular disorders[1,2]. However, this requires precise quantifiability over a wide parameter range.
In previous work[3], we focused on optimizing ASL scan designs for fast, precise estimation at a single parameter value representative of normative function. Here, we: (i) extend our optimization towards precise quantification over a wide range of parameter values that includes a number of pathological conditions while maintaining constraints on total scan time, and (ii) use separate neural networks for regression based estimation of individual parameters.
Methods
In our scan optimization approach, the cost function uses the Cramer-Rao Bound, which is the inverse of the Fisher information matrix defined as follows:
$$\begin{align}\mathbf{F}(\mathbf{\underline{\theta}};\mathbf{\underline{\nu}})&=\frac{1}{\sigma^2}\cdot[\nabla_{\mathbf{\underline{\theta}}}\mathbf{\underline{s}}]^T[\nabla_{\mathbf{\underline{\theta}}}\mathbf{\underline{s}}],\qquad (1)\end{align}$$
where, $$$\mathbf{\underline{s}}(\cdot)\in\mathbb{R}^{N\times 1}$$$ is the signal generated from our model, $$$\mathbf{\underline{\theta}}\in\mathbb{R}^{K\times 1}$$$ represents a single set of hemodynamic parameters, $$$\mathbf{\underline{\nu}}\in\mathbb{R}^{P\times 1}$$$ are the scan parameter(s) and $$$\sigma^2$$$ is the i.i.d. Gaussian noise variance.
In our previous work[3], we optimized the scan parameters $$$\mathbf{\underline{\nu}}$$$, namely the sequence of labeling durations of the ASL scan, by minimizing a weighted trace of $$$\mathbf{F}^{-1}$$$ for a fixed vector $$$\mathbf{\underline{\theta}}$$$. Here we optimize the scan timing parameters by considering a representative collection of true parameter values, $$$\mathbf{\Theta}$$$, spread uniformly over a comprehensive range by minimizing the following cost function:
$$\begin{align}\hat{\nu}=\underset{{\nu \in \mathscr{V}}}{\arg\min}~~\frac{1}{|\mathbf{\Theta}|}\underset{\mathbf{\underline{\theta}}\in\mathbf{\Theta}}{\sum}\text{Tr} \bigg(\mathbf{W}\cdot\frac{|\mathbf{F}^{-1}(\mathbf{\underline{\theta}},\nu)|^{0.5}}{\mathbf{N}(\mathbf{\underline{\theta}})}\cdot\mathbf{W}\bigg)\label{objfun},\qquad (2)\end{align}$$
where $$$\mathbf{W}$$$ is a diagonal weighting matrix assigning priority to each hemodynamic parameter in the cost function and $$$\mathbf{N}(\mathbf{\underline{\theta}})=(\mathbf{\underline{\theta}}^{0.5})(\mathbf{\underline{\theta}}^{0.5})^T$$$ is a normalization matrix that is divided element-wise into the inverse Fisher information matrix.
Since, given a signal model, the Cramer-Rao Bound predicts the lowest possible variance in parameter estimates from an unbiased estimator, using exhaustive search to minimize the design cost function eqn. (2) ensures that our optimized scan yields precise estimates.
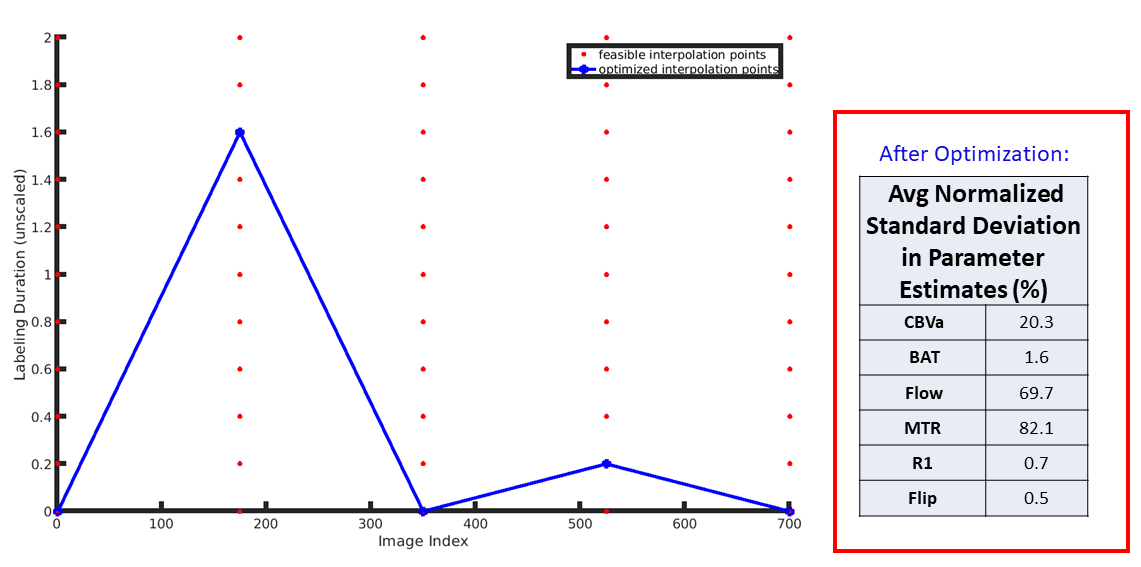
The set of candidate labeling timing schedules is described using a linear interpolation of 5 equidistant points in the 'labeling space' (Fig 1).
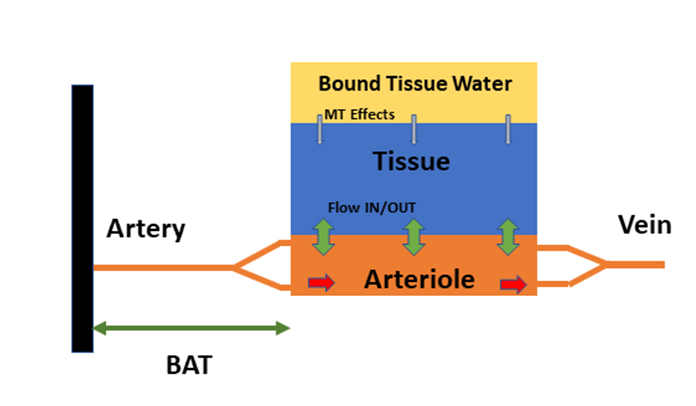
We train individual neural networks[3,4,5] for estimating each parameter using training data generated by this optimized scan design and the model in Figure 2. Namely, these parameters are Bolus Arrival Time (BAT), Perfusion (CBF), Magnetization Transfer Rate (MTR), Cerebral Blood Volume (CBV), Tissue T1, and Flip Angles. Using individual networks alleviates the need for relative weighing of targets during training, significantly reducing the need for parameter tuning.
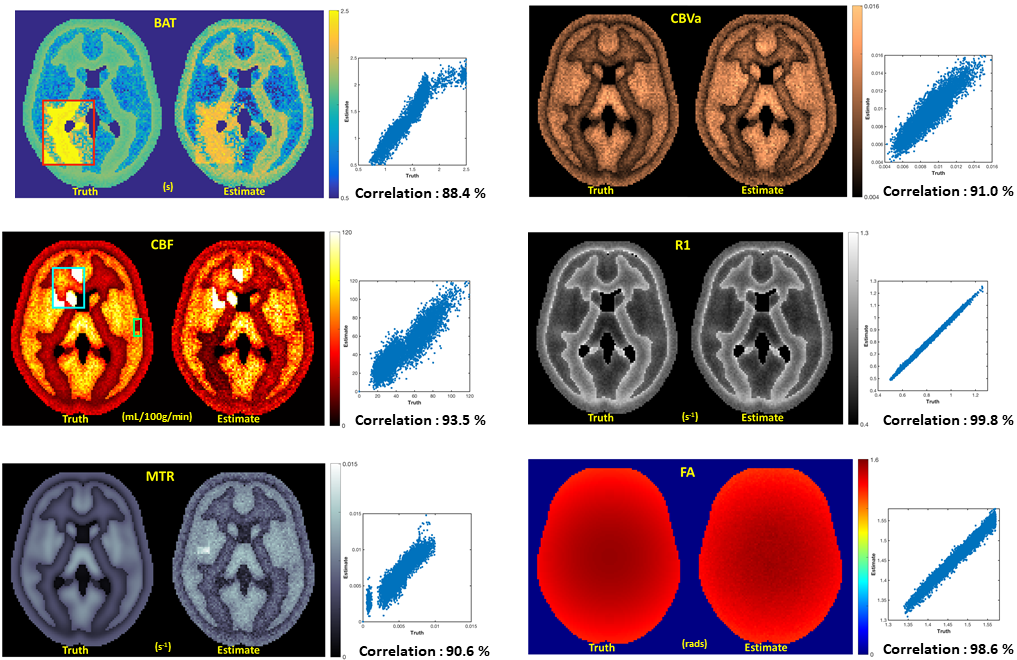
The trained estimators are then used on synthetically generated anthropomorphic phantoms with built-in regions that capture tissue properties prevalent in cerebrovascular diseases like stroke (very low flows), tumor (higher flows), Moyamoya disease (high BATs) etc.
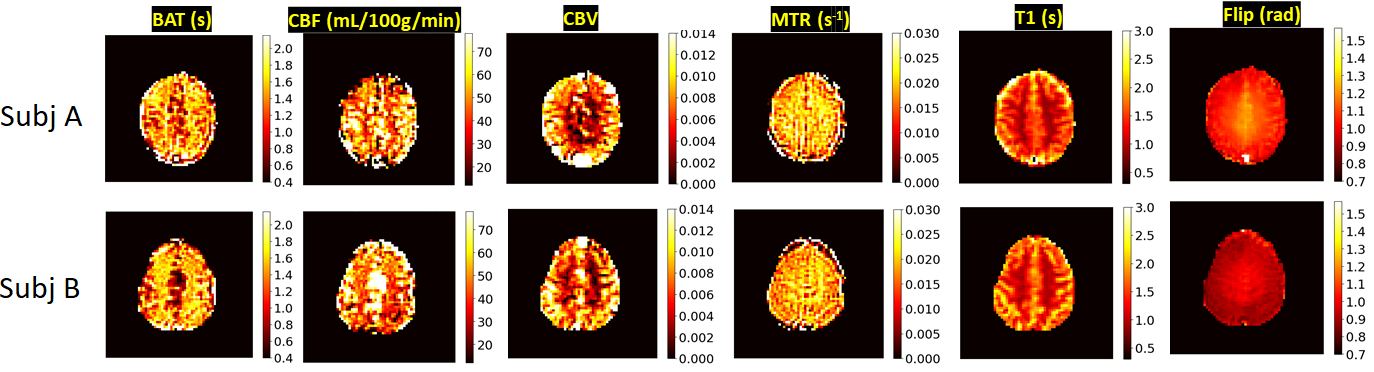
We also test our methods on data acquired from two healthy human subjects on a 3T MRI scanner with a 32 channel coil (MR750, GE, Waukesha, WI).
Results
Figure1 depicts the optimized schedule for 700 frames and a 600s scan duration, as well as the predicted average normalized standard deviation of parameter estimates over a pathological range. It is clear that linear interpolation allows us to explore the 'label space' effectively.
Figure 3 shows predicted as well as ground truth maps for the synthetic 'pathological phantoms'. Regions of particular pathological interest are highlighted in the ground truth maps. Clearly, there is high fidelity between the maps even in regions with anomalies that are difficult to quantify.
Moreover, Figure 4 shows estimated parameter maps from two healthy human subjects. The maps look plausible and the predictions are in line with values typically found in literature, but they are noticeably 'noisy' for certain hemodynamic properties. Coupled with the impressive results on synthetic data, this observation suggests imperfections in our modeling.
Conclusions
Combining CRB based optimization with regressional neural networks in MRF ASL enables fast, precise estimates of hemodynamic parameters and tissue properties in the presence of anomalies that are difficult to characterize. Our results on synthetic and healthy subject data hint at realizing the clinical potential of MRF ASL in diagnostics and treatment planning of multiple disorders.
Future work will involve more extensive testing and validation of our methods on patients with cerebrovascular disorders, as well as investigating more accurate signal modeling.
Acknowledgements
NIH R21EB021562References
[1] K.L. Wright, Y. Jiang, D. Ma, D.C. Noll, M.A. Griswold, V. Gulani, and L. Hernandez-Garcia. 2018. “Estimation of Perfusion Properties with MR Fingerprinting Arterial Spin Labeling.” Magnetic Resonance Imaging 50. doi:10.1016/j.mri.2018.03.011.
[2] Pan Su, Deng Mao, Peiying Liu, Yang Li, Marco C. Pinho, Babu G. Welch, and Hanzhang Lu. "Multiparametric estimation of brain hemodynamics with MR fingerprinting ASL". Magnetic Resonance inMedicine, 00(November):1–12, 2016.
[3] Anish Lahiri, Jeffrey Fessler, and Luis Hernandez-Garcia. 2018. “Optimized Scan Design for ASL Fingerprinting and Multiparametric Estimation Using Neural Network Regression.” In Proc Intl Soc Mag Reson Med, 309.
[4] Cohen, O., Zhu, B., & Rosen, M. S. (2018). "MR fingerprinting Deep RecOnstruction NEtwork (DRONE). Magnetic Resonance in Medicine", 80(3), 885–894. https://doi.org/10.1002/mrm.27198
[5] Patrick Virtue, Stella X. Yu, Michael Lustig, "Better than Real: Complex-valued Neural Nets for MRI Fingerprinting", Proc. IEEE International Conference on Image Processing (ICIP), 2017
Figures