5024
Quantification of Multiple Boli Arterial Spin Labelling in Mice and RatsSamantha Paterson1, Camille Graff2, Antoine Vallatos3, and William Holmes1
1Neuroscience & Psychology, University of Glasgow, Glasgow, United Kingdom, 2Grenoble INP, Grenoble, France, 3University of Edinburgh, Edinburgh, United Kingdom
Synopsis
A need for high SNR quantitative ASL has driven the quantification of mbASL, a high SNR ASL sequence that uses adiabatic pulses to label multiple boli of arterial water. The sequence has a hybrid PASL & CASL nature with a modified Buxton kinetic model used to describe this hybrid-like nature. We have shown that experimental results mirror theoretical predictions with signal distribution changing with labelling slice thickness. High SNR mbASL images in mice and rats with significantly higher signal than the standard FAIR sequence have been produced and CBF images and values acquired that agree with the literature.
Introduction
There is a clinical & pre-clinical need for high SNR quantitative ASL. We introduce a quantitative model for a high SNR ASL sequence (mbASL) in rats and mice, which uses a train of adiabatic pulses to label multiple boli of arterial water1. mbASL can be described as a hybrid of PASL and CASL: either as a multiple PASL with limited labelling thickness or a large thickness CASL. We have been able to fully quantify this technique in mice and rats by describing mbASL signal as a sum of limited thickness PASL signals2. Using a modification of Buxton’s kinetic model (Figure 1) to account for multiple boli slice-selective labelling, we were able to reproduce a range of mbASL signal distributions.Methods
Variable labelling slice thickness mbASL experiments were performed using CD1 mice (n=6) & Wistar rats (n=6). The distance between labelling and imaging slice was kept constant. Exploration of the labelled bolus arrival at different post-label delay times used 1-shot mbASL with an inversion time (CI) of 500ms and a time after inversion TI= 50:500:4050ms (NA=10). CBF maps were produced using a T1 map and a 4-shot mbASL (NA=10, CI = 5000ms, TI = 50ms). mbASL was compared with FAIR, NA= 10, TI = 1750ms.Results & Discussion
The number of pulses for optimal signal decreased as the thickness of the labelling slice increased, with the optimal values dependent on the animal strain. The arrival of the labelled bolus changes distribution as the slice thickness increases shifting from a CASL-like distribution to a PASL-like distribution. Figure 2 demonstrates this, with the peak signal changing from 50ms for a 4mm slice to 550ms and 1050ms for the larger thicknesses which is mirrored in the rat results. For the larger slice thickness in rats, we see the signal peak at multiple points which we believe is due to blood circulation from the heart. The signal seen in Figure 2 reflects the theoretical predictions (Figure 3) from the model that the ΔM distribution would change at different post label delays with increasing thickness. This confirms the hybrid nature of the mbASL sequence. The sequence has shown a large increase in overall signal and SNR compared to the standard FAIR sequence (Figure 4). The model has been used to produce CBF maps using acquired mbASL images and T1 maps (Figure 5) in rats and mice. Early analysis is producing CBF values that agree with FAIR values and the literature3,4. There is high potential for this sequence to be adapted for different animal strains and clinical use. With its adaptable nature for signal distribution, mbASL has potential to measure CBF non-invasively with a higher SNR and accuracy compared to the standard ASL sequences.Conclusion
We have been able to fully quantify the mbASL sequence and produce quantitative CBF maps for mice and rats which agree with literature values3,4. The sequence has shown significantly higher signal and SNR over the standard FAIR sequence in both mice and rats.Acknowledgements
Many thanks to Jim Mullin for his technical help with the MRI scanning, and to the University of Glasgow and EPSRC for my funding.References
1Vallatos, A et al. (2017), 2Buxton, R. B. et. al. (1998), 3Muir, E. R. et al. (2008), 4Sicard, K. M et al. (2005).Figures
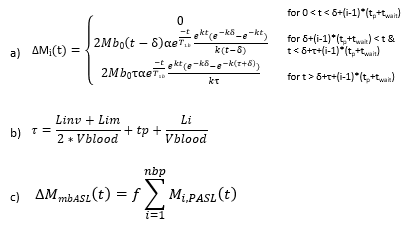
Figure 1: Equations describing the Buxton
Kinetic Model. a) The modified Buxton PASL kinetic model. b) The modification
to tau. c) The mbASL equation for calculating CBF.
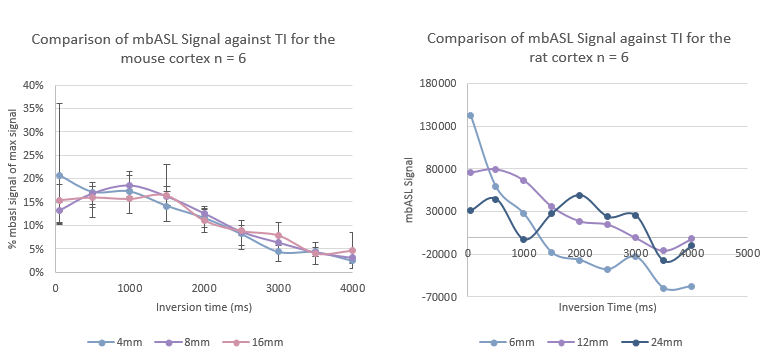
Figure 2: a) mbASL signal against TI for
various slice thicknesses for mice a) and rats b).
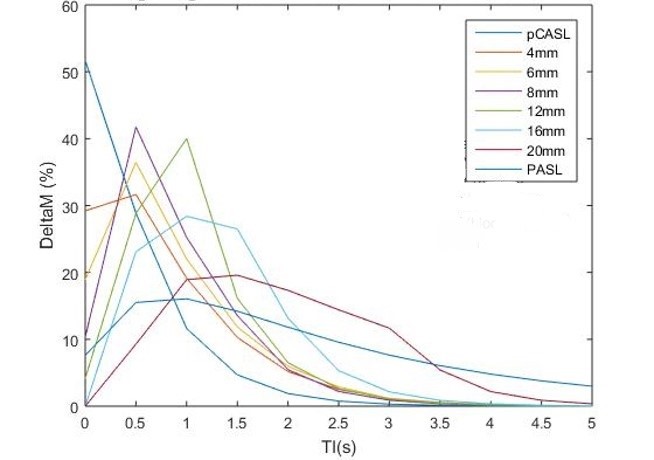
Figure 3: Distribution of theoretical signal
at different labelling slice thicknesses showing the change from pCASL to PASL.
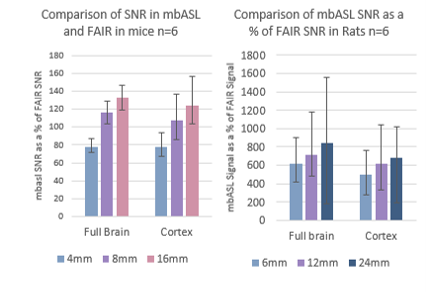
Figure 4:Data for full brain and cortex ROI has shown a large increase in SNR over the standard FAIR sequence for a) mice and b) rats.
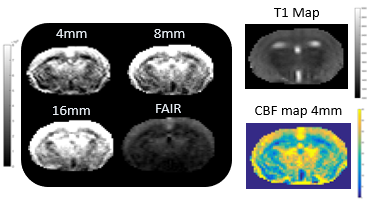
Figure 5: a) ASL perfusion maps acquired
using mbASL at multiple thickness and FAIR. b) T1
map for the same animal used to produce the CBF map in c) for 4mm thickness.