5022
A Pipeline for ASL Quantification and Analysis using Inter-regional Differences and Machine Learning: Application to Young Onset Alzheimer’s Disease1Medical Physics and Biomedical Engineering, University College London, London, United Kingdom, 2Department of Biomedical Engineering, King's College London, London, United Kingdom, 3Dementia Research Centre, UCL Queen Square Institute of Neurology, University College London, London, United Kingdom, 4Department of Brain Repair and Rehabilitation, UCL Queen Square Institute of Neurology, University College London, London, United Kingdom, 5Leonard Wolfson Experimental Neurology Centre, University College London, London, United Kingdom
Synopsis
Arterial Spin Labelling (ASL) is an MRI method to measure cerebral blood flow with potential to assist early dementia diagnosis. Here, ASL data acquired from patients with young onset Alzheimer’s disease (AD) was analysed, using both a novel region based statistical approach and voxel based machine learning. This is the first study to analyse ASL data from patients with Posterior Cortical Atrophy using machine learning. Both approaches are shown to identify regions known to be affected by AD. Inter-region analysis suggests the parietal lobe is the most useful benchmark region, to separate region specific hypoperfusion from global perfusion changes.
Introduction
Arterial Spin Labelling (ASL) is a non-invasive MRI method to measure cerebral blood flow (CBF) with great potential to assist in early dementia diagnosis – which may allow emerging therapies to be administered earlier with greater effect. However, difficulties in quantitative consistency frustrate the development of robust ASL biomarkers. Here, ASL data acquired from patients with Young Onset Alzheimer’s Disease (YOAD) was analysed with an optimized processing pipeline, using both a novel region based statistical approach and voxel based machine learning.Methods
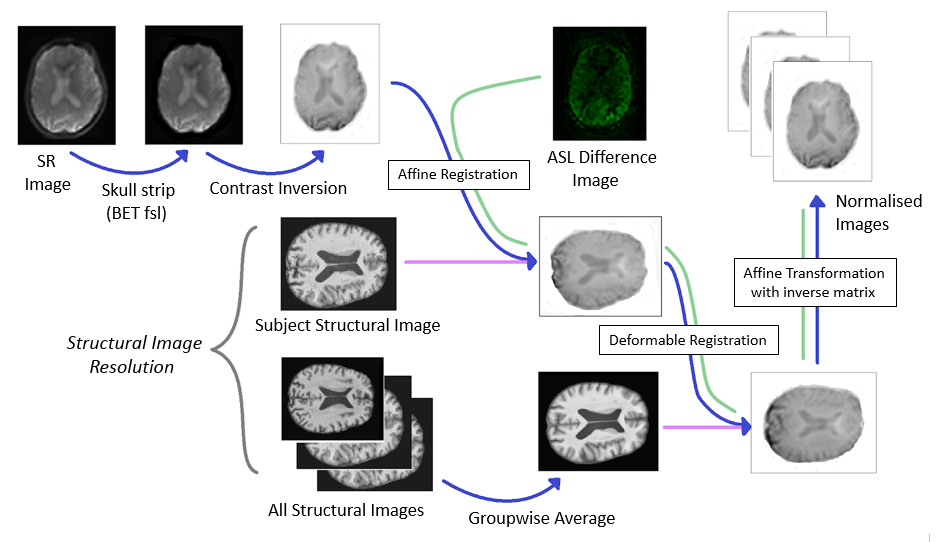
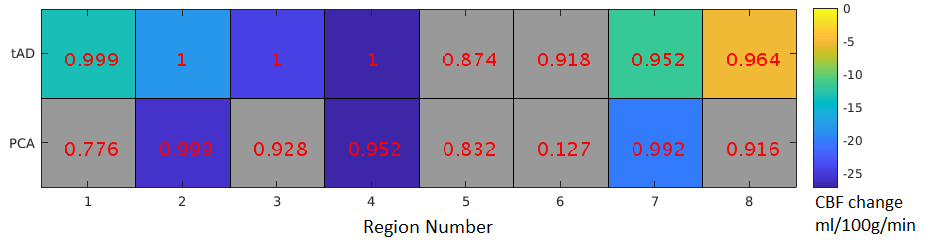
Following manual removal of motion corrupted data with obvious halo artefacts, the YOAD study cohort (age 51-70) consisted of: 22 healthy controls, 23 patients diagnosed with typical AD (tAD), and 10 with Posterior Cortical Atrophy (PCA). Structural T1 weighted images were acquired (MPRAGE, 1.1mm isotropic resolution, TR 2.2s, TI 0.9ms). Five ASL image pairs were acquired per subject (8-shot 3D GRASE, FAIR Q2 TIPS, 3.8×3.8×4.0mm, TI 2s, bolus length 0.8s). Using the same acquisition scheme, saturation recovery (SR) images were acquired with recovery times of 1, 2 and 5s, to fit M0 maps for calibration of the ASL data. After group-wise registration using the NiftyReg toolbox [1] (figure 1) CBF was quantified using Oxford ASL [2]. Separate CBF maps were calculated for grey matter (GM) and white matter (WM) using linear regression partial volume correction (PVC) [3]. The GM and WM CBF maps were normalised to remove inter-individual global perfusion differences. A constant was added to each voxel of the CBF map, in order to shift the peak of each map’s CBF distribution to the group average. The MPRAGE images were parcellated into 8 ROIs using GIF [4] (see figure 2) which were transferred to the normalized GM perfusion images for analysis. Mean CBF values were computed for each anatomical region, with voxels containing a volume fraction of different regions handled in a similar manner to the PVC approach. For example, in a voxel containing contribution from the frontal, temporal and limbic lobes:$$ \begin{gather} \begin{bmatrix} P_1 \\ P_2 \\ P_3 \end{bmatrix} = \begin{bmatrix} F_1 & T_1 & L_1 \\ F_2 & T_2 & L_2 \\ F_3 & T_3 & L_3 \end{bmatrix} \times \begin{bmatrix} P_F \\ P_T \\ P_L \end{bmatrix} \end{gather} $$
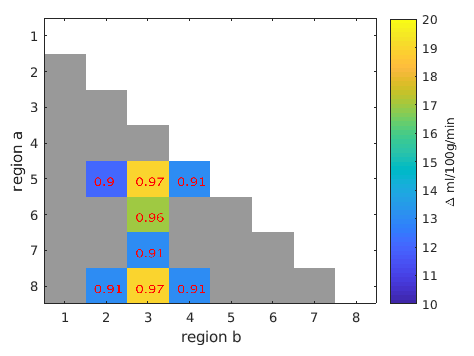
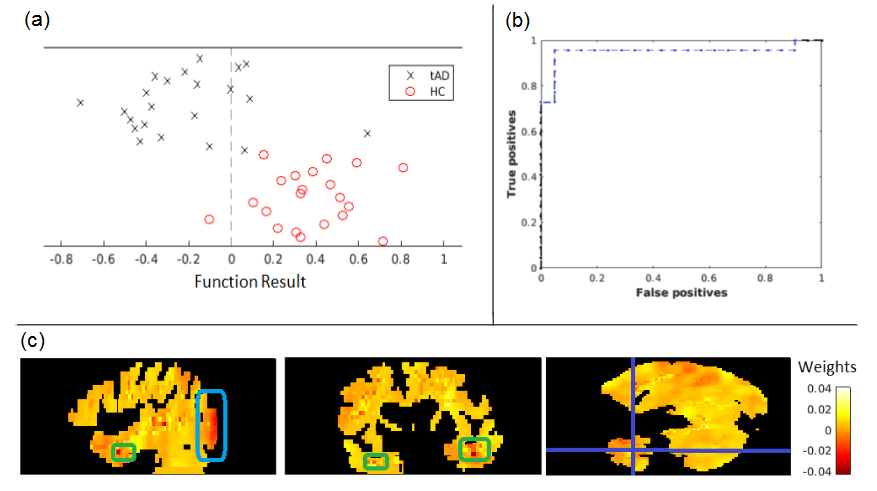
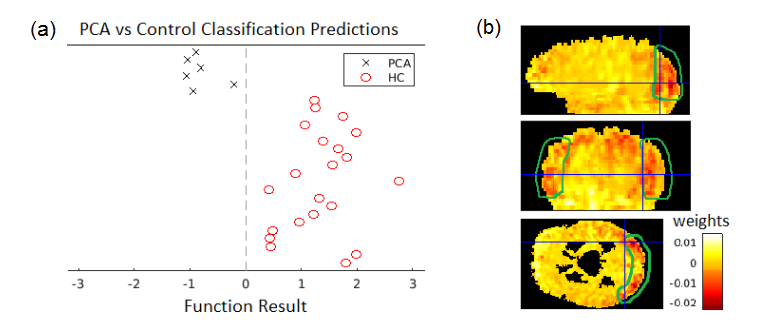
where $$$P_n$$$ is the CBF in the nth voxel in a 5x5x5 kernel surrounding the target voxel, $$$F_n$$$ ,$$$T_n$$$ and $$$L_n$$$ are the regions volume fractions in the nth voxel, while $$$P_F$$$ , $$$P_T$$$ and $$$P_L$$$ are the CBF of each tissue type. In a simple comparison of regional CBF, significant differences between ROIs in control and dementia subject CBF maps are identified using a t-test (figure 2). In the novel approach proposed here, within-subject inter-regional perfusion differences are compared between control and dementia subjects (figure 3), using an inhomogeneous variance t-test [5]. As a second analysis, the PRoNTo toolbox [6] was used to train a classifier for each dementia type to predict whether a perfusion map belongs to that group or the control group. Via a binary support vector machine, this produced a weights map which reveals perfusion increases/decreases in a voxel linked to the disease. When the weights map is multiplied voxelwise with a perfusion map, a sum of the result above 0 is classified as a dementia case.
Results
The results (figure 2) show significant hypoperfusion linked to tAD in the external cortical lobes and hippocampus, as expected [7][8]. In PCA patients, hypoperfusion was observed in the temporal lobes, parietal lobes and hippocampus, agreeing with previous studies [9].The inter-regional analysis (figure 3) yielded significant results only for the tAD subjects, with the parietal lobe identified as a useful reference region. The machine learning analysis showed hippocampal and occipital lobe hypoperfusion linked to tAD (figure 4), and occipital lobe hypoperfusion linked to PCA (figure 5).Discussion
Overall, this study demonstrated that statistically significant regional changes in perfusion can be discerned in small groups of patients with young onset AD, with both traditional statistical methods and also with a machine learning algorithm usually applied to large datasets. This is the first study to analyse ASL data from patients with Posterior Cortical Atrophy using machine learning. The novel inter-regional analysis suggested the parietal lobe is the most useful benchmark region, to separate region specific hypoperfusion associated with tAD from global perfusion changes.
Conclusion
ASL is increasingly used as a secondary diagnostic for dementia, and a quantitative biomarker which can distinguish between different dementia types is desirable. This study confirms the perfusion patterns linked with two types of AD seen in previous work, and suggests pattern recognition and inter-regional comparison of perfusion changes as more robust biomarkers to individual variation.Acknowledgements
First author is in receipt of an EPSRC PhD stipend.References
[1] Modat M, Cash DM, Daga P, Winston GP, Duncan JS, Ourselin S. Global image registration using a symmetric block-matching approach. J Med Imaging (Bellingham). 2014;1(2):024003.
[2] Chappell MA, et al. Variational Bayesian Inference for a Nonlinear Forward Model. IEEE TRANSACTIONS ON SIGNAL PROCESSING. 2009;57(1):223–236.
[3] Asllani I, Borogovac A, Brown TR. Regression algorithm correcting for partial volume effects in arterial spin labeling MRI. Magn Reson Med. 2008;60(6):1362-71.
[4] Cardoso J, Modat M, Wolz R, Melbourne A, Cash DM, Rueckert D, Ourselin S. Geodesic Information Flows: Spatially-Variant Graphs and Their Application to Segmentation and Fusion. IEEE Transactions on Medical Imaging. 2015;34(9):1976-1988.
[5] Moser BK, Stevens GR. Homogeneity of Variance in the Two-Sample Means Test. The American Statistician. 1992;46(1):19-21.
[6] Schrouff J, Rosa MJ, Rondina JM, Marquand AF, Chu C, Ashburner J, Phillips C, Richiardi J, Mourao-Miranda J. PRoNTo: Pattern Recognition for Neuroimaging Toolbox. Neuroinformatics. 2013.
[7] Asllani I., Habeck C., Scarmeas N., Borogovac A., Brown T. R., Stern Y. Multivariate and univariate analysis of continuous arterial spin labeling perfusion MRI in Alzheimer's disease. Journal of Cerebral Blood Flow and Metabolism. 2008;28(4):725–736.
[8] Okonkwo OC, Xu G, Oh JM, Dowling MN, Carlsson CM, Gallagher CL, Birdsill AC, Palotti M, Wharton W, Johnson SC et al. Cerebral Blood Flow is Diminished in Asymptomatic Middle-Aged Adults with Maternal History of Alzheimer's Disease. Cerebral Cortex. 2014;24(4):978–988.
[9] Lehmann M, Melbourne A, Dickson J C, et al. A novel use of arterial spin labelling MRI to demonstrate focal hypoperfusion in individuals with posterior cortical atrophy: a multimodalimaging study. J Neurol Neurosurg Psychiatry 2016;87:1032–1034.
Figures