5021
A Split-Label Design for Simultaneous Measurements of Perfusion in Distant Slices by Pulsed Arterial Spin Labeling1C.J. Gorter Center for high field MRI, Department of Radiology, Leiden University Medical Center, Leiden, Netherlands
Synopsis
Most Arterial-Spin-Labeling (ASL-)MRI in exercised muscle employ single-slice acquisitions. However, fiber-type and oxidative capacity vary along the length of healthy muscles. Therefore, multi-slice acquisitions are desirable. Multi-slice pulsed ASL coverage is limited because the label is created proximally from the stack of slices. In muscle, this implies long transit times to the most distal slice due to slow flow. We propose a split-label design adaptation of FAIR that allows for sufficient labeling for distant slices. We validated our approach in the brain to take advantage of the high resting-state perfusion, and applied it in the lower leg muscle after exercise.
Introduction
Arterial Spin Labeling (ASL-)MRI is gaining popularity in muscle research, as it can monitor perfusion changes upon (or during) exercise non-invasively. Most of these studies employ single-slice acquisitions, although fiber type and oxidative capacity vary along the length of healthy muscles.1-3 Observations over the total muscle-length are particularly relevant in the context of muscular dystrophies, where proximo-distal differences in muscle degeneration in individual muscles have been observed.4-6 However, obtaining a large coverage of the leg is challenging for ASL-MRI. Coverage of standard multi-slice pulsed ASL is limited by the fact that label is created proximally from the stack of slices. For 10-15cm long muscles, this implies long transit times to the most distal slice due to slow flow. We propose a split-label design adaptation of FAIR that allows for sufficient labeling for distant slices. First, this approach was validated in the brain to take advantage of the higher resting-state perfusion compared to muscle. Second, it was employed for post-exercise recovery measurements in the calf muscle.Methods
Standard FAIR (Figures 1a&2a) included a selective WET pre-saturation, followed by selective or non-selective FOCI-inversion, and a 90⁰ post-labeling-saturation pulse. Single-shot EPI images were acquired with a Look-Locker scheme (10 phases, 25º flip-angle, PLD=250-2500 ms) and a multiband readout (MB-factor=2). Split-label FAIR consisted of the same elements, applied selectively and sequentially for each slice, preserving labeling between the slices (Figures 1b&2b). To compensate for differences in MT effects, the power of the two selective FOCI-pulses was half of that of the non-selective pulse.
Validation in brain. Five healthy volunteers were scanned at 3T (Philips Ingenia) using a 32-channel head coil. Perfusion was acquired in 2 slices (5mm-thick, slice-gap = 60mm, FOV:240x192mm2; matrix:76x76; TR/TE=3000/9.4ms) with: (1) Split-label FAIR, (2) standard multi-slice FAIR, (3) single-slice standard FAIR. M0 and T1-maps were also acquired and used to generate a grey matter mask. ASL-signal dynamics were compared across scans using (control-label)/M0, and normalized to the single-slice peak value for each volunteer. Data are reported as average and standard error across subjects and compared using a two-way ANOVA with Sidak correction for multiple comparisons.
Feasibility in muscle. Post-exercise perfusion was measured in 2 slices in the calf of one subject using an 8-elements receiver coil (FOV=180x200 mm2, matrix:68x68, TR/TE= 3000/19ms, PLD= 1600ms, 8mm-thickness, slice gap= 70mm). Plantar flexion was performed against an elastic band until exhaustion. Three QUIPSS-pulses were applied 100ms before imaging to obtain a sharp labeling bolus. Background suppression was used to improve the temporal perfusion SNR and was optimized to also act as fat suppression (TIs: 650, 1300ms).
Results
In the distal slice, the standard multi-slice FAIR signal was significantly lower than the single-slice FAIR for all PLDs (p<0.001). The maximum value was 66±7% lower than with the single-slice FAIR, and was reached with a delay of 500ms (Figure 3). In the proximal slice, similar observations were made, but to a lesser extent: the maximum value was 30±15% lower than with the single-slice FAIR, and the delay was only 250ms. The differences in signal were no longer significant at long PLDs (>1500ms) in the proximal slice.
On the other hand, the split-label ASL signal intensity and time-course of both slices were closer to the single-slice results. In the proximal slice, split-FAIR showed a maximum difference of only 10.1% with single-slice FAIR at PLD=750ms and there was no difference at PLDs>1750ms. In the distal slice, results were significantly different at PLD=500 and 750ms (9.6%, p<0.05) and no longer thereafter. In muscle, different intensities and time-courses were detected post-exercise in the soleus muscle, with higher perfusion in the distal slice (Figure 4).
Discussion
Split-label FAIR performed better than standard-FAIR for perfusion measurements in 60-cm-distant slices in the brain. The label created between slices minimized the effect of long transit times in the most distal slice. Importantly, results were not different from single-slice FAIR for PLD=2000ms, the recommended value for brain acquisitions.7 While delayed and lower perfusion signal with standard-FAIR in the distal slice could be attributed to the 60mm gap between labeled bolus and acquisition plane, the similar observation in the proximal slice was likely indicative of a contribution from inflow of distal blood to the ASL signal. The lower values observed with the split-FAIR might be due to the effect of the post-saturation module of each slice on the labeled bolus. This effect was mild and should be taken into account for modeling and quantification. Our design could be applied in muscle, where future work will aim at exploring proximo-distal differences in muscle perfusion during exercise.Acknowledgements
This work was supported by the Netherlands Organization for Scientific Research (NWO), under research program VIDI, project "Similar but not the same", number 917.164.90References
1. Torrella, J.R., et al., Capillarity, fibre types and fibre morphometry in different sampling sites across and along the tibialis anterior muscle of the rat. Cells Tissues Organs, 2000. 167(2-3): p. 153-62.
2. Wang, L.C. and D. Kernell, Quantification of fibre type regionalisation: an analysis of lower hindlimb muscles in the rat. J Anat, 2001. 198(Pt 3): p. 295-308.
3. Boss, A., et al., Oxidative capacity varies along the length of healthy human tibialis anterior. J Physiol, 2018. 596(8): p. 1467-1483.
4. Hooijmans, M.T., et al., Non-uniform muscle fat replacement along the proximodistal axis in Duchenne muscular dystrophy. Neuromuscul Disord, 2017. 27(5): p. 458-464.
5. Chrzanowski, S.M., et al., Multi-slice MRI reveals heterogeneity in disease distribution along the length of muscle in Duchenne muscular dystrophy. Acta Myol, 2017. 36(3): p. 151-162.
6. Janssen, B.H., et al., Distinct disease phases in muscles of facioscapulohumeral dystrophy patients identified by MR detected fat infiltration. PLoS One, 2014. 9(1): p. e85416.
7. Alsop, D.C., et al., Recommended implementation of arterial spin-labeled perfusion MRI for clinical applications: A consensus of the ISMRM perfusion study group and the European consortium for ASL in dementia. Magn Reson Med, 2015. 73(1): p. 102-16.
Figures
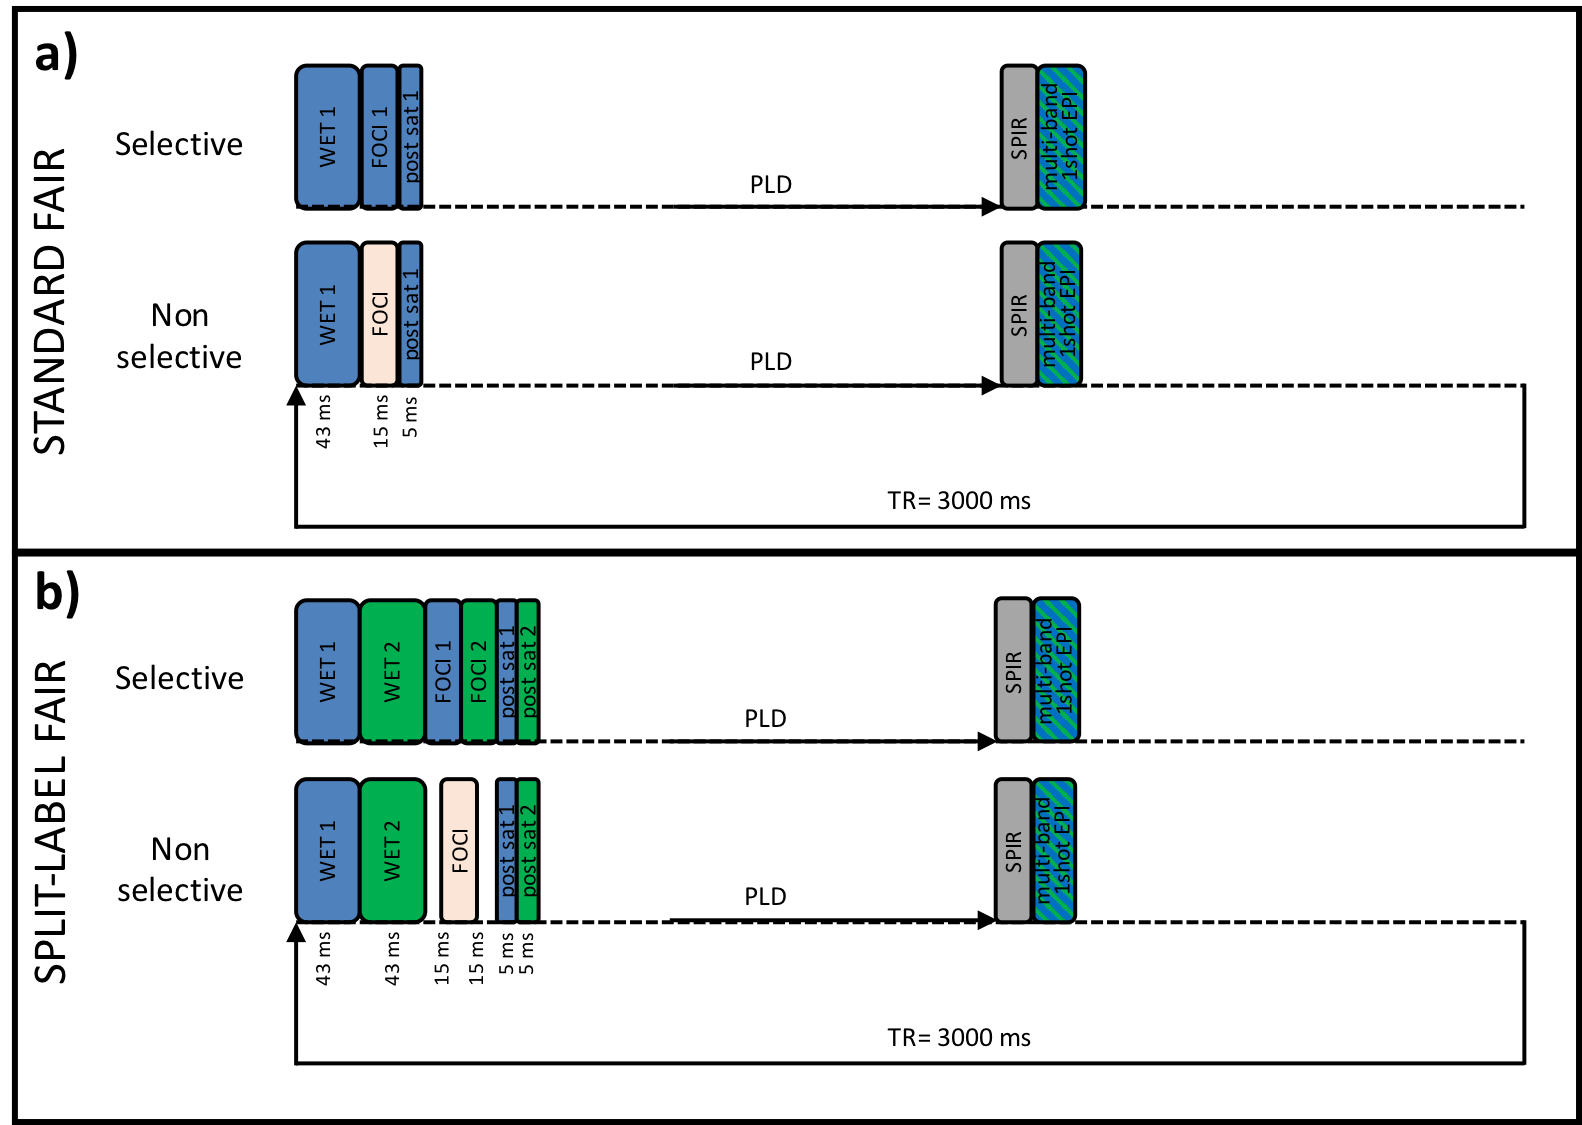
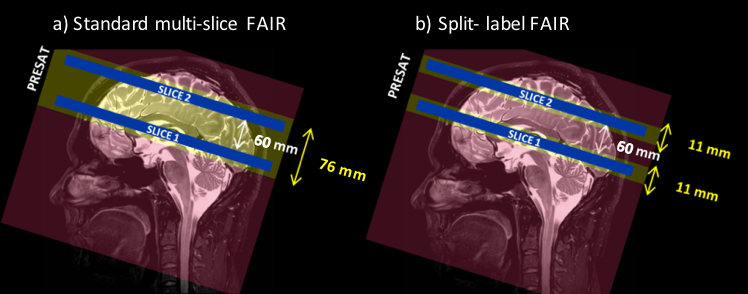
Figure 2: Slice positioning for the brain experiments: In blue are the acquisition slices (5mm thick) separated by a 60-mm gap. The yellow rectangles represent the coverage of the pre-saturation, post-saturation and selective inversion. The red rectangles indicate the resulting labeled regions. In the split-label design (b), the total saturation slabs thickness was 11mm for each slice, corresponding to a 5 mm slice thickness, and a 3mm additional label thickness on each side of the slices, whereas it was 70mm in the standard multi-slice FAIR.
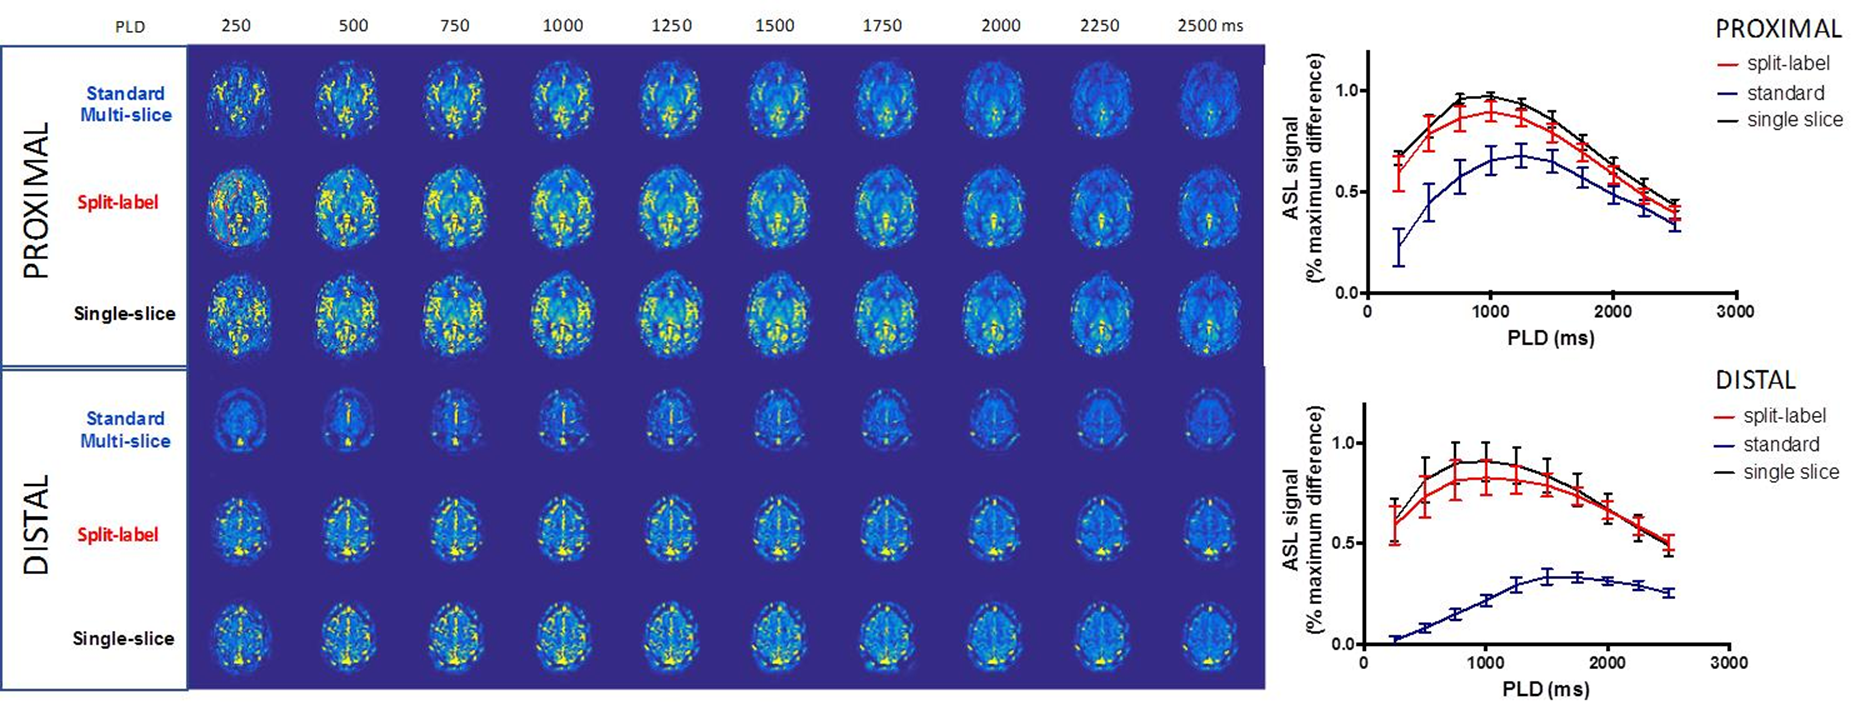
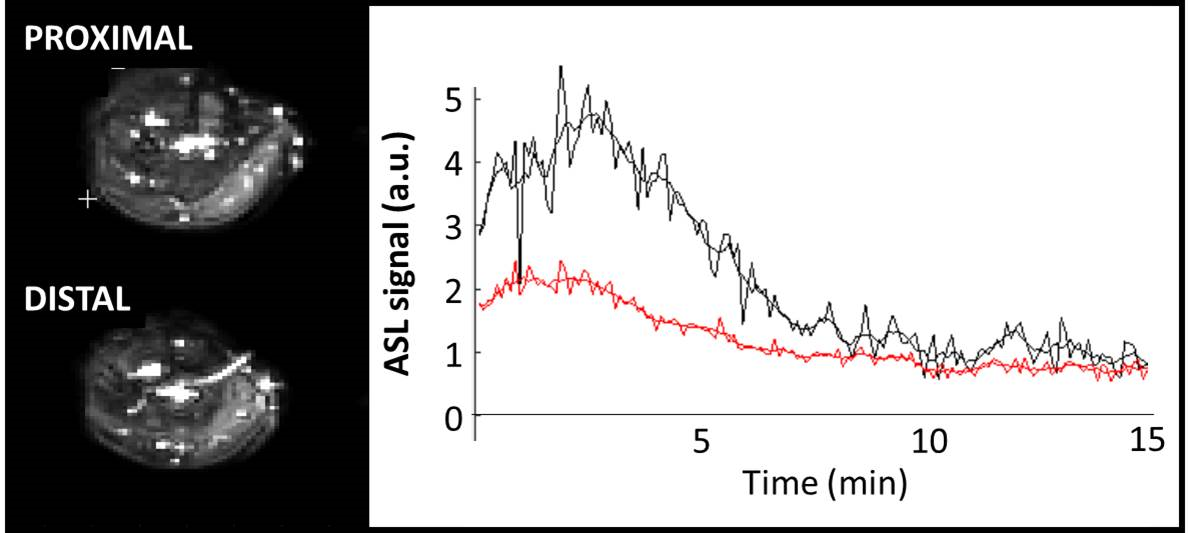
Figure 4: Exemple of ASL maps acquired in the calf of one subject in the proximal (top left) and distal slices (bottom left). The right panel shows the post-exercise time-course of the ASL signal over 15 min, from an ROI drawn in the soleus in the proximal (red) and distal (black) slices.