5020
Investigating Variability Sources in Kidney Perfusion Measurements with Pulsed ASL: A Phantom and In Vivo Pilot Study1Computer Assisted Clinical Medicine, Medical Faculty Mannheim, Heidelberg University, Mannheim, Mannheim, Germany
Synopsis
In this work, the variations of a 3D GRASE sequence with a fast pulsed ASL protocol at 3T were tested in isolation using a phantom and in vivo measurements. In vivo, 25 single scans in breath hold with a single volunteer were obtained in one session, thus reducing breathing motion and registration uncertainties as well as shimming, inter-volunteer and hydration stage variabilities. In phantom, we found a perfusion of 94.5 ± 5.4 ml/min/100g and in vivo, we found perfusion values in the expected physiological range with high standard deviation inter-scans but high correlation between kidneys. This suggests physiological instead of signal-to-noise related variations which would yield random inter-kidney variations.
Introduction
Cortical perfusion has been recently recognized as a potential biomarker to diagnose kidney diseases as quantified with arterial spin labeling (ASL)1. The reproducibility of ASL has been extensively investigated in previous works, albeit with mixed outcomes2. Typically, the reproducibility is tested using a cohort of volunteers and the evaluated protocols are based on several measurements either in the form of averaging or multiple inversion times. These approaches comprise several sources of variations (technical and physiological) which are difficult to analyze independently. In this work, we investigated perfusion measurements using a fast pulsed ASL sequence in vivo and with a perfusion phantom. Our in vivo approach was based on single acquisitions using breath hold with a single volunteer in one session, thus reducing breathing motion and registration uncertainties as well as shimming, inter-volunteer and hydration stage variabilities. The phantom measurement allowed the evaluation of the technique without physiological sources of variation.Methods
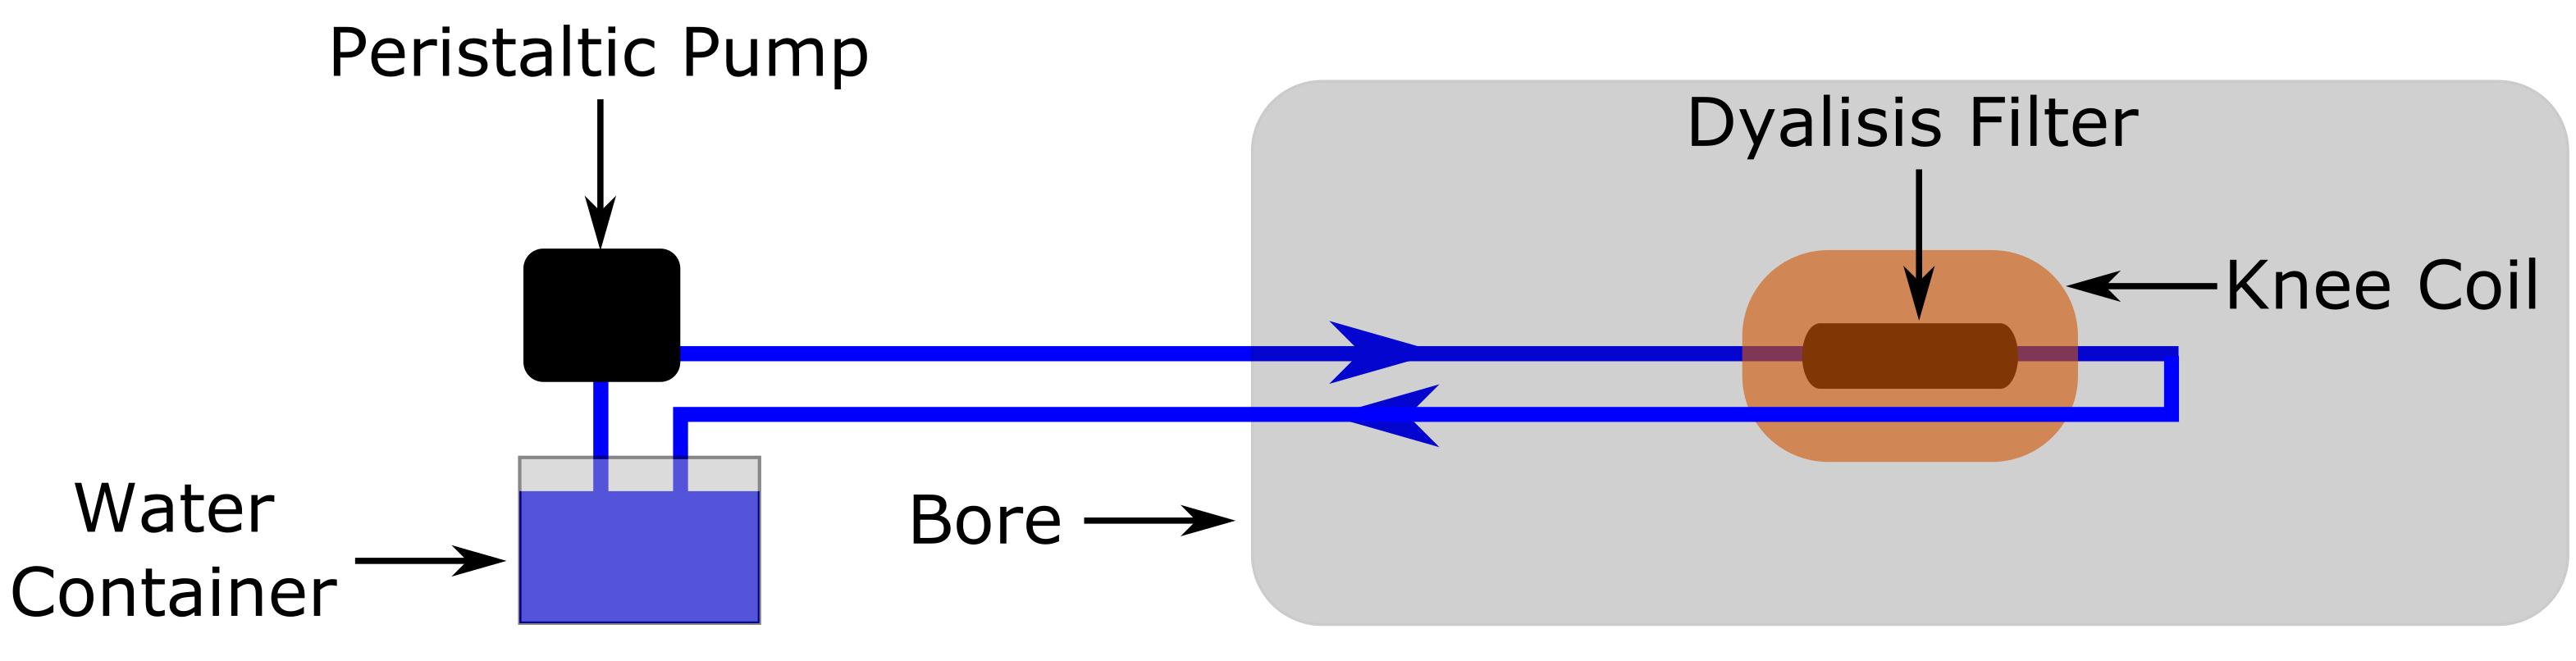
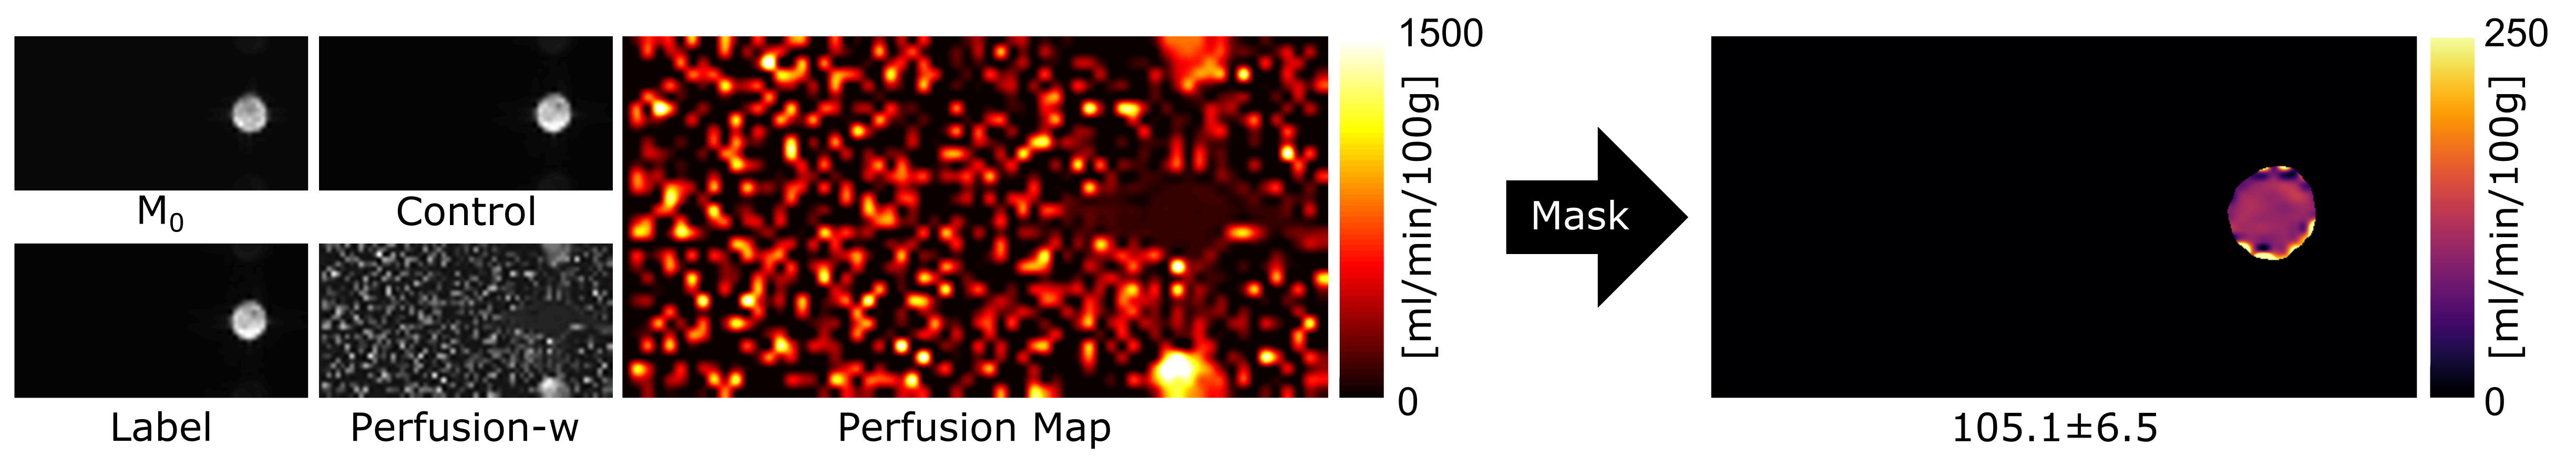
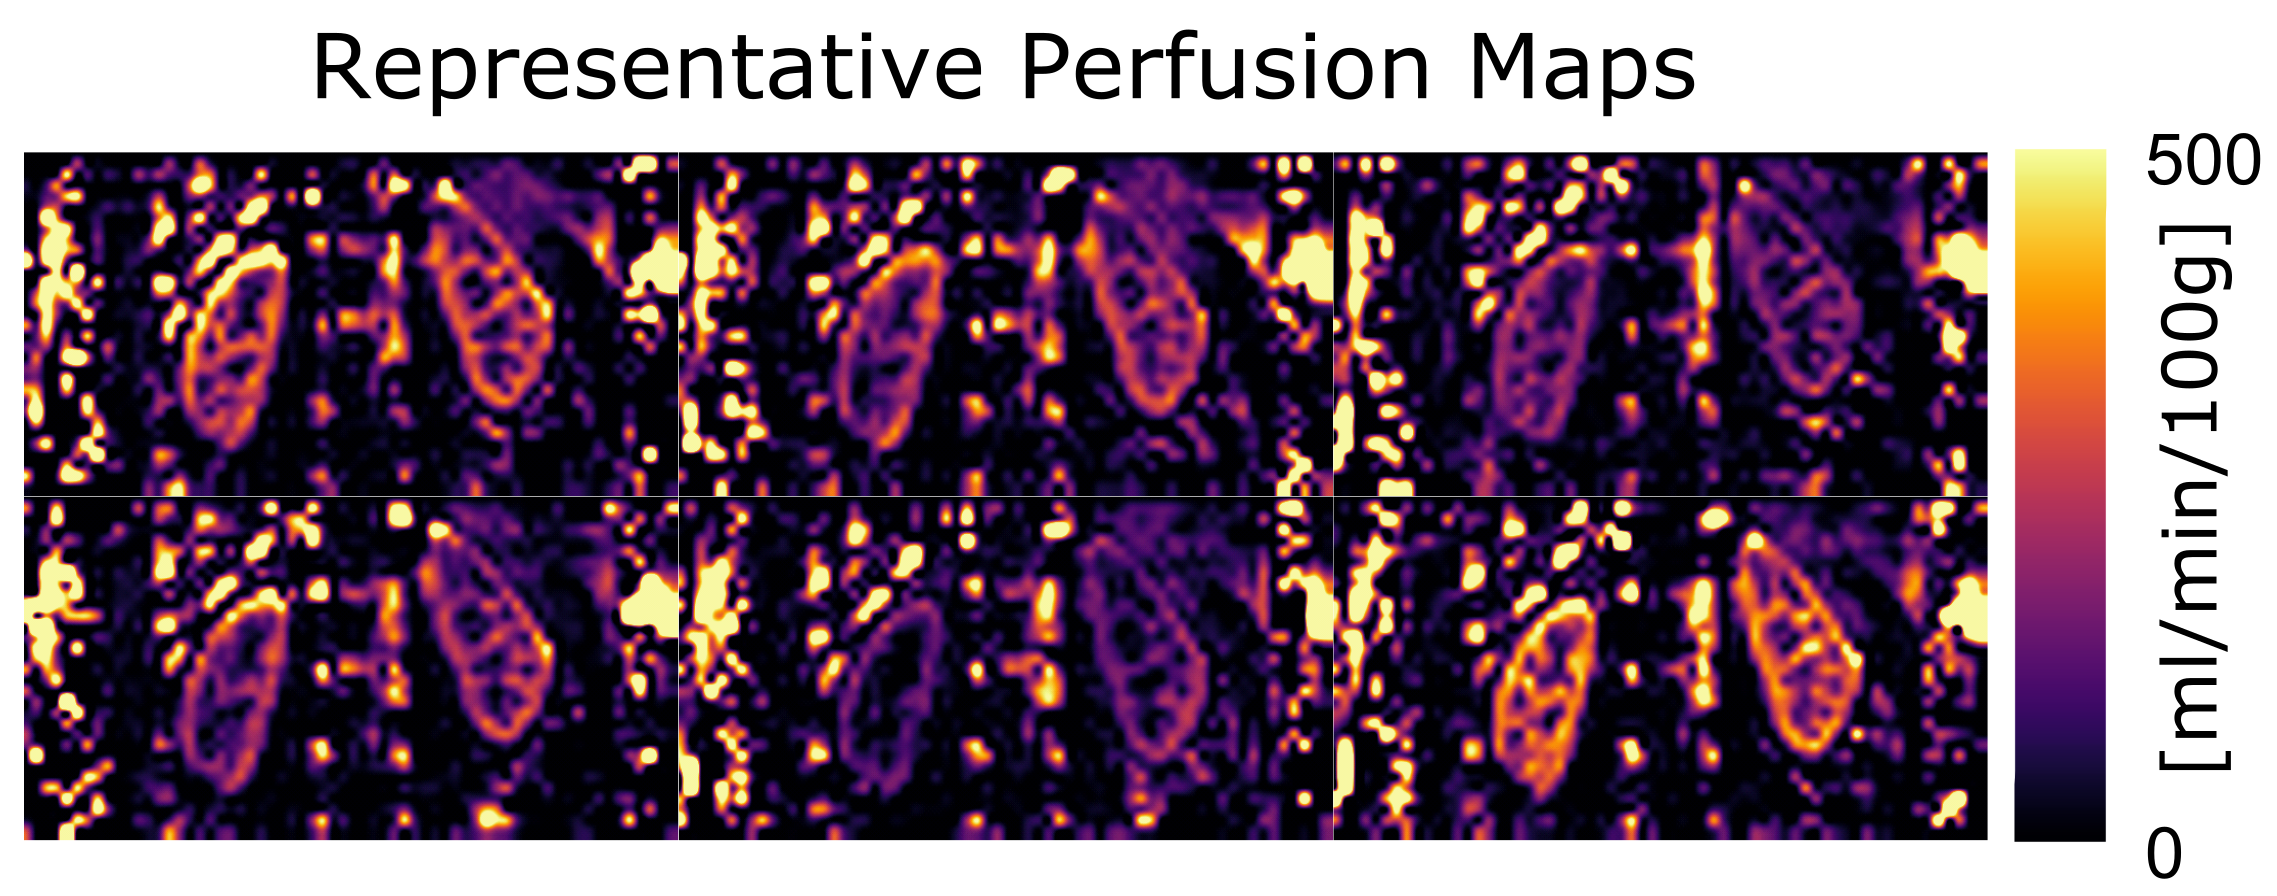
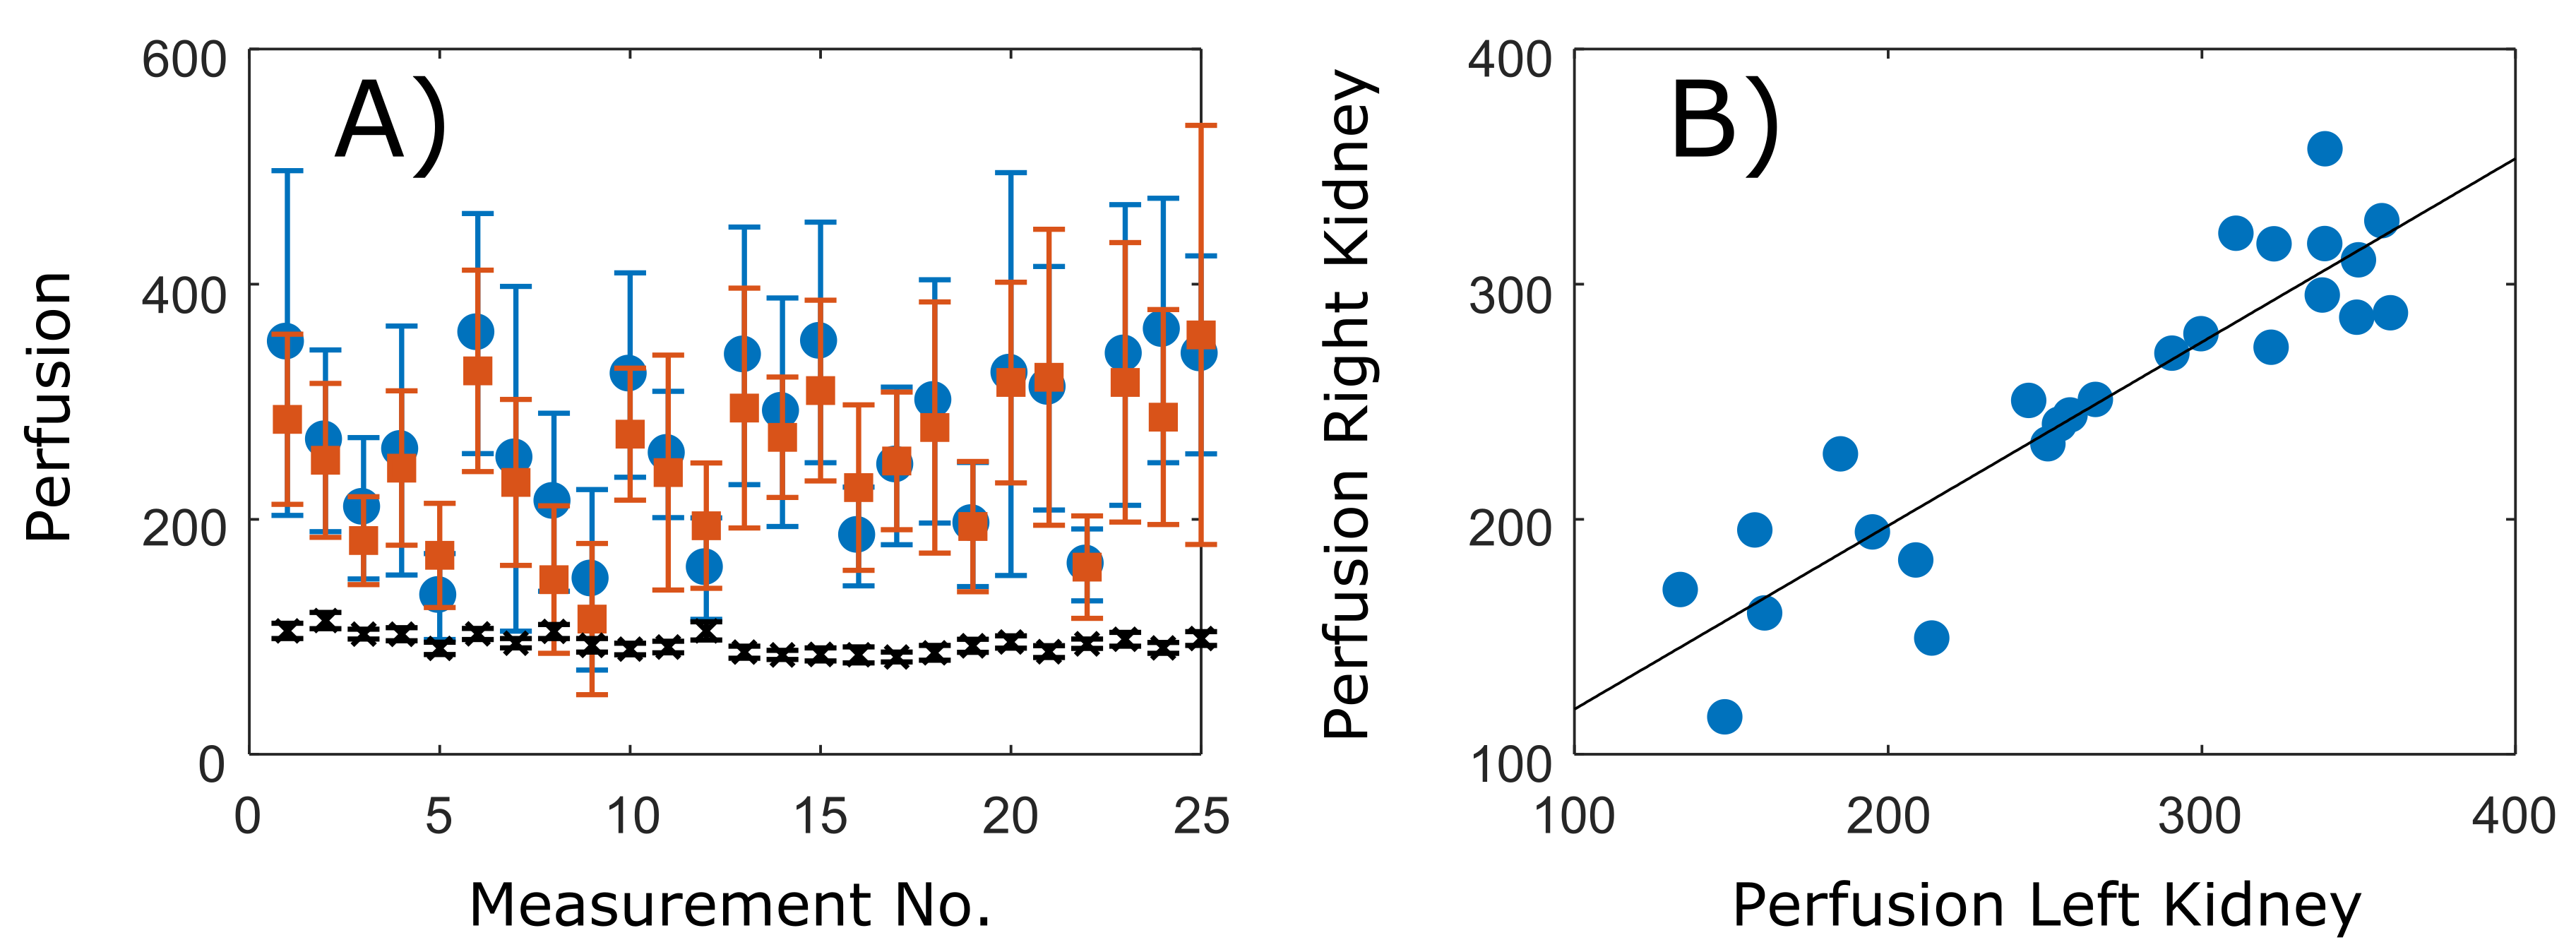
All measurements were performed in a 3T Skyra MR system (Siemens Healthineers) with prior informed consent using a pulsed ASL sequence with 3D GRASE readout3. A phantom consisted of a dialysis filter (HelixoneFX800, Fresenius Medical Care, Germany) in a closed system circulating water using a peristaltic pump set to a rotation velocity of 320 rpm (Fig. 1)4. The perfusion phantom was scanned axially 25 times using a local transmit 15-channel knee coil (Siemens Healthineers) with a TI of 2400 ms, Bolus Length of 500 ms, T1 of 4000 ms and no background suppression. In vivo measurements were performed coronal and background suppression was used with a single TI. The parameters for the acquisitions were: TE/TR = 26/7000 ms, EPI factor = 32, Turbo factor = 8, Field-of-view = 350x135 mm², Slice Thickness = 7 mm, Slices = 8, Matrix Size = 64x32, Averages = 1, TI = 1200 ms, Bolus Length = 950 ms, Background Suppression = 520 ms, T1 of blood = 1500 ms, TA = 20 seconds. One 25-year-old healthy male volunteer was scanned 25 times in one session where the volunteer remained in the scanner the entire time without being repositioned. Each 20-second scan was performed under a single breath hold and a 10-second pause between scans was used. Perfusion maps were calculated using the equation in Ref 5. For the quantification, the workflow included a bicubic interpolation to increase apparent resolution to aid the identification of the cortex. Manual region-of-interests were drawn in the cortex of both kidney using Matlab (The Mathworks, Natick, USA).Results
A perfusion of 94.5 ± 5.4 ml/min/100g was found in the phantom measurements (see a representative phantom measurement in Fig. 2). In the 25 in vivo measurements, the cortical perfusion was 266.9 ± 73.6 and 249 ± 63.2 ml/min/100g in the right and left kidneys, respectively. Moreover, a high correlation coefficient (0.91) was found for both kidneys (Figs. 3 and 4).Discussion
In this work, a fast pulsed ASL protocol based on a 3D GRASE sequence at 3 T allowed the opportunity to test perfusion in phantom and in vivo mitigating several important sources of variability. The perfusion values in phantom were similar to those previously found using dynamic contrast-enhanced MRI4. These values were lower than those expected for the kidney but each measurement showed a low standard deviation and overall they had high precision, which could be expected to be near the best possible performance of the sequence and protocol considering the lack of motion and the constant flow. The in vivo results were in the expected range and correlated well with previous studies2. Moreover, despite the high standard deviations, our results demonstrated similar variations between scans for both kidneys. This is an important finding since it suggests that a main source of variability between scans is likely due to an underlying physiological effect instead of a lack of signal-to-noise ratio which instead would create random variations between the kidneys. One possible explanation is the velocity of blood in the aorta due to pulsation which changes in a ca. 5-fold6. In this case, the use of multiple measurements could be reevaluated. In our future work, a cohort of volunteers will be investigated and the pulsation effects will be evaluated using ECG triggered acquisitions.Conclusion
Fast independent scans in phantom and in vivo during breath hold allowed us to obtain perfusion measurements with reduced influencing factors. We envision our results to contribute towards the development of fast and robust ASL protocols in the kidney to assist the diagnosis of kidney diseases.Acknowledgements
No acknowledgement found.References
1. Li LP, Tan H, Thacker JM, et al. Evaluation of Renal Blood Flow in Chronic Kidney Disease Using Arterial Spin Labeling Perfusion Magnetic Resonance Imaging. Kidney Int Rep 2017;2(1):36-43.
2. Odudu A, Nery F, Harteveld AA, Evans RG, Pendse D, Buchanan CE, Francis ST, Fernández-Seara MA. Arterial spin labelling MRI to measure renal perfusion: a systematic review and statement paper. Nephrol Dial Transplant 2018;33(suppl_2):ii15-ii21.
3. Günther M, Oshio K, and Feinberg DA. Single-shot 3D imaging techniques improve arterial spin labeling perfusion measurements. Magn Reson Med 2005;54(2), 491-498
4. Uhrig T, Hubertus S, Chacon-Caldera J, et al. Entwicklung eines Phantoms für DCE und ASL Messungen zur Quantifizierung von Perfusionsparametern, In Proc. DGMP Nuremberg, Germany 2018.
5. Martirosian P, Klose U, Mader I, and Schick F. FAIR true‐FISP perfusion imaging of the kidneys. Magn Reson Med 2004;51(2), 353-361.
6. Gabe IT, Gault JH, Ross J, et al. Measurement of instantaneous blood flow velocity and pressure in conscious man with a catheter-tip velocity probe. Circulation 1969;40(5), 603-614.
Figures