5015
Inaccuracy in Estimated CEST Contrast After Extrapolation from Two-Pool Quantitative MT Fitting1Physical Sciences, Sunnybrook Research Institute, Toronto, ON, Canada, 2Medical Biophysics, University of Toronto, Toronto, ON, Canada, 3Neurosurgery and Paediatric Neurosurgery, Medical University of Lublin, Lublin, Poland
Synopsis
A recently introduced technique has been used to remove the semisolid macromolecular magnetization transfer (MT) contribution from Z-spectra in order to isolate the contrast from chemical exchange saturation transfer (CEST) and the relayed nuclear Overhauser effect (rNOE). This is usually performed by first fitting Z-spectra acquired with high amplitude RF saturation with a two-pool quantitative MT model and then extrapolating an MT-only Z-spectrum to a lower saturation B1 and subtracting from Z-spectra acquired with the same B1. We aim to show that this two-step pipeline introduces inaccuracies into the extrapolation and describe them.
Introduction
Recently, a technique has been introduced to remove the semisolid macromolecular magnetization transfer (MT) contribution (termed MT contrast) from Z-spectra in order to isolate the contrast from chemical exchange saturation transfer (CEST) and the relayed nuclear Overhauser effect (rNOE)1,2. This is usually performed by first fitting Z-spectra acquired with high amplitude RF saturation with a two-pool (water and MT) quantitative MT (qMT) model3 and then extrapolating an MT-only Z-spectrum to a lower saturation B1 and subtracting from Z-spectra acquired with the same B1 and subtracting from Z-spectra acquired with the same B1. We aim to show that this two-step pipeline introduces inaccuracies into the extrapolation and describe them.Methods
A phantom containing 0.5, 1, 2% agar (the MT pool) by mass with and without 100 mM NH4Cl (ammonium chloride; the CEST pool) was imaged at 7 T (Ascend 300WB, Bruker BioSpin). The NH4Cl concentration was chosen to be similar to that of the in vivo amide CEST pool, 71.9 mM4. Z-spectra were acquired using magnetization transfer-prepared FLASH (saturation parameters: block pulse; B1 = 0.5, 1, 2, 4 µT with linearly spaced frequency offsets Δω and B1 = 3, 6 µT with log-spaced Δω; and duration ≈ 16 s). Z-spectra were B0-corrected using WASSR5. Additional T1 and B1 maps were acquired for model fitting. Models were fitted using least-squares curve fitting in MATLAB to all or a subset of the data as follows. Procedure 1: the three-pool (water, MT, and CEST) model6 was fitted to all the data. Procedure 2: the two-pool qMT model3 to the B1 = 3 and 6 µT Z-spectra. Procedure 3: the same as Procedure 2, but using |Δω| ≥ 12 ppm data only to try and avoid CEST contributions in the Z-spectra.Results
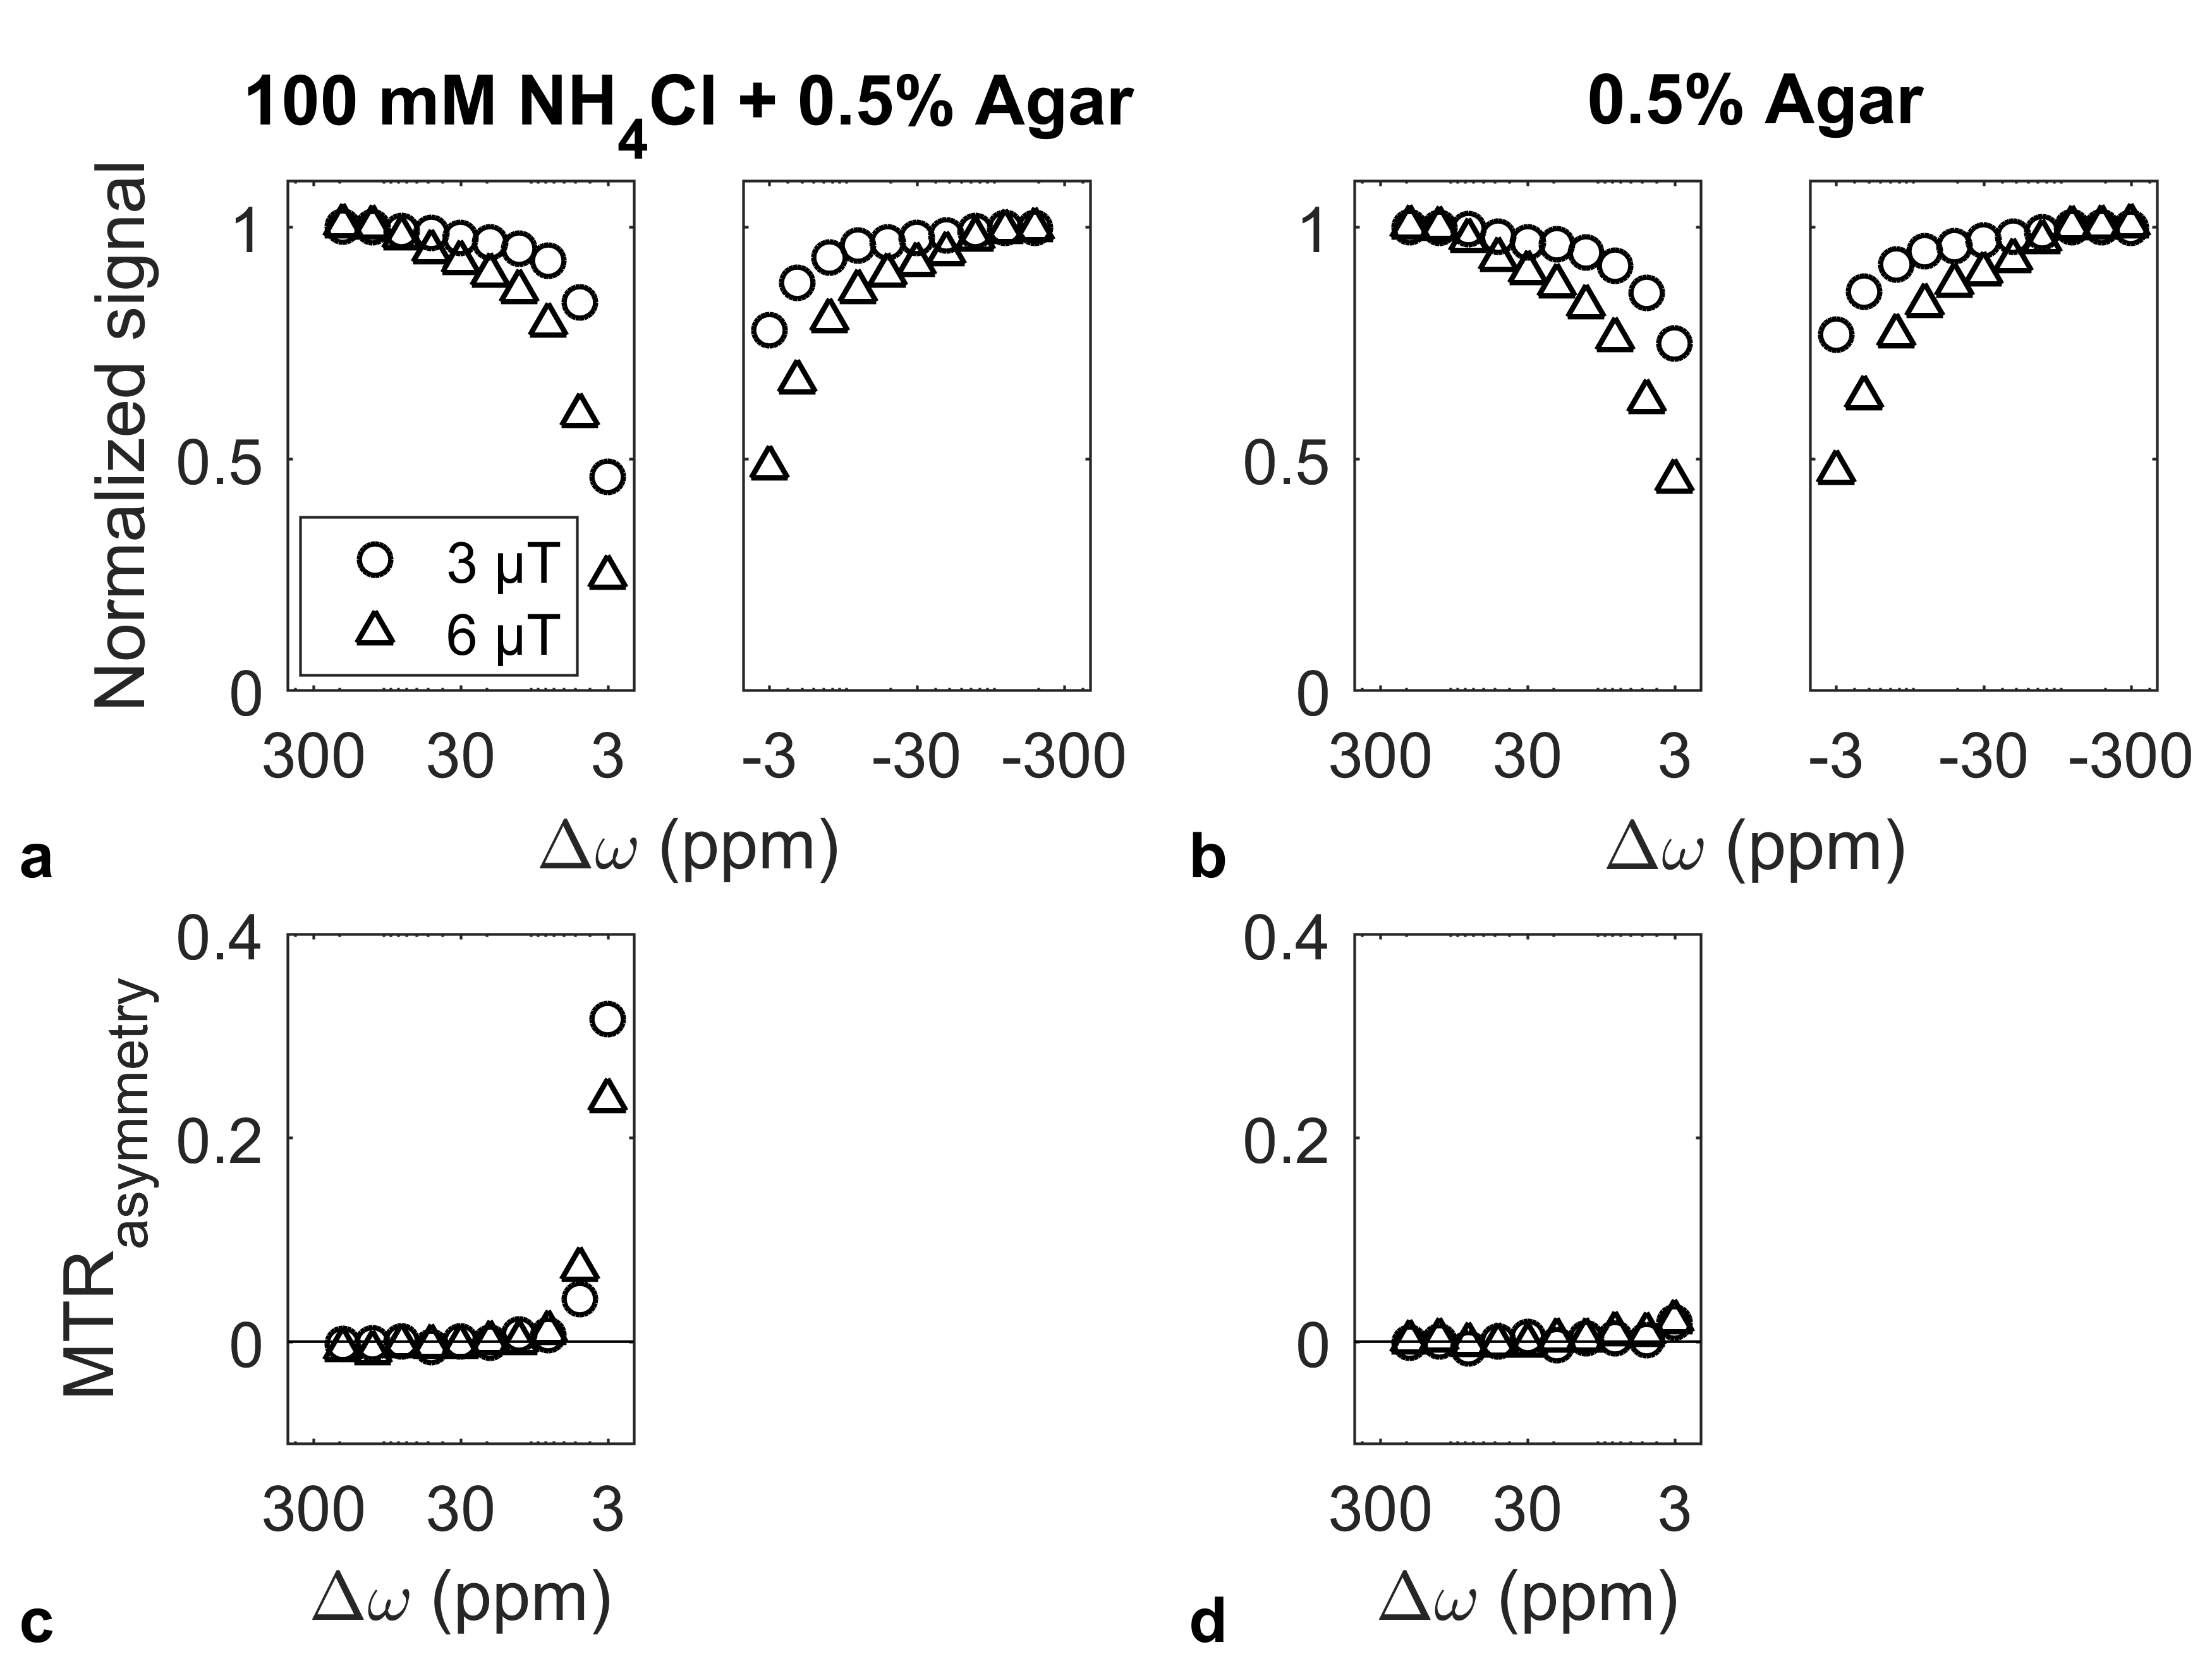
There was a large CEST contribution from NH4Cl even at saturation B1s of 3 and 6 µT. This was evident in the MTRasymmetry ([S(–Δω) – S(Δω)]/S0, where S is the signal at frequency offset Δω and S0 is that without saturation) in 100 mM NH4Cl + 0.5% agar (Fig. 1a), for example, but not pure agar (Fig. 1b), which had no CEST.
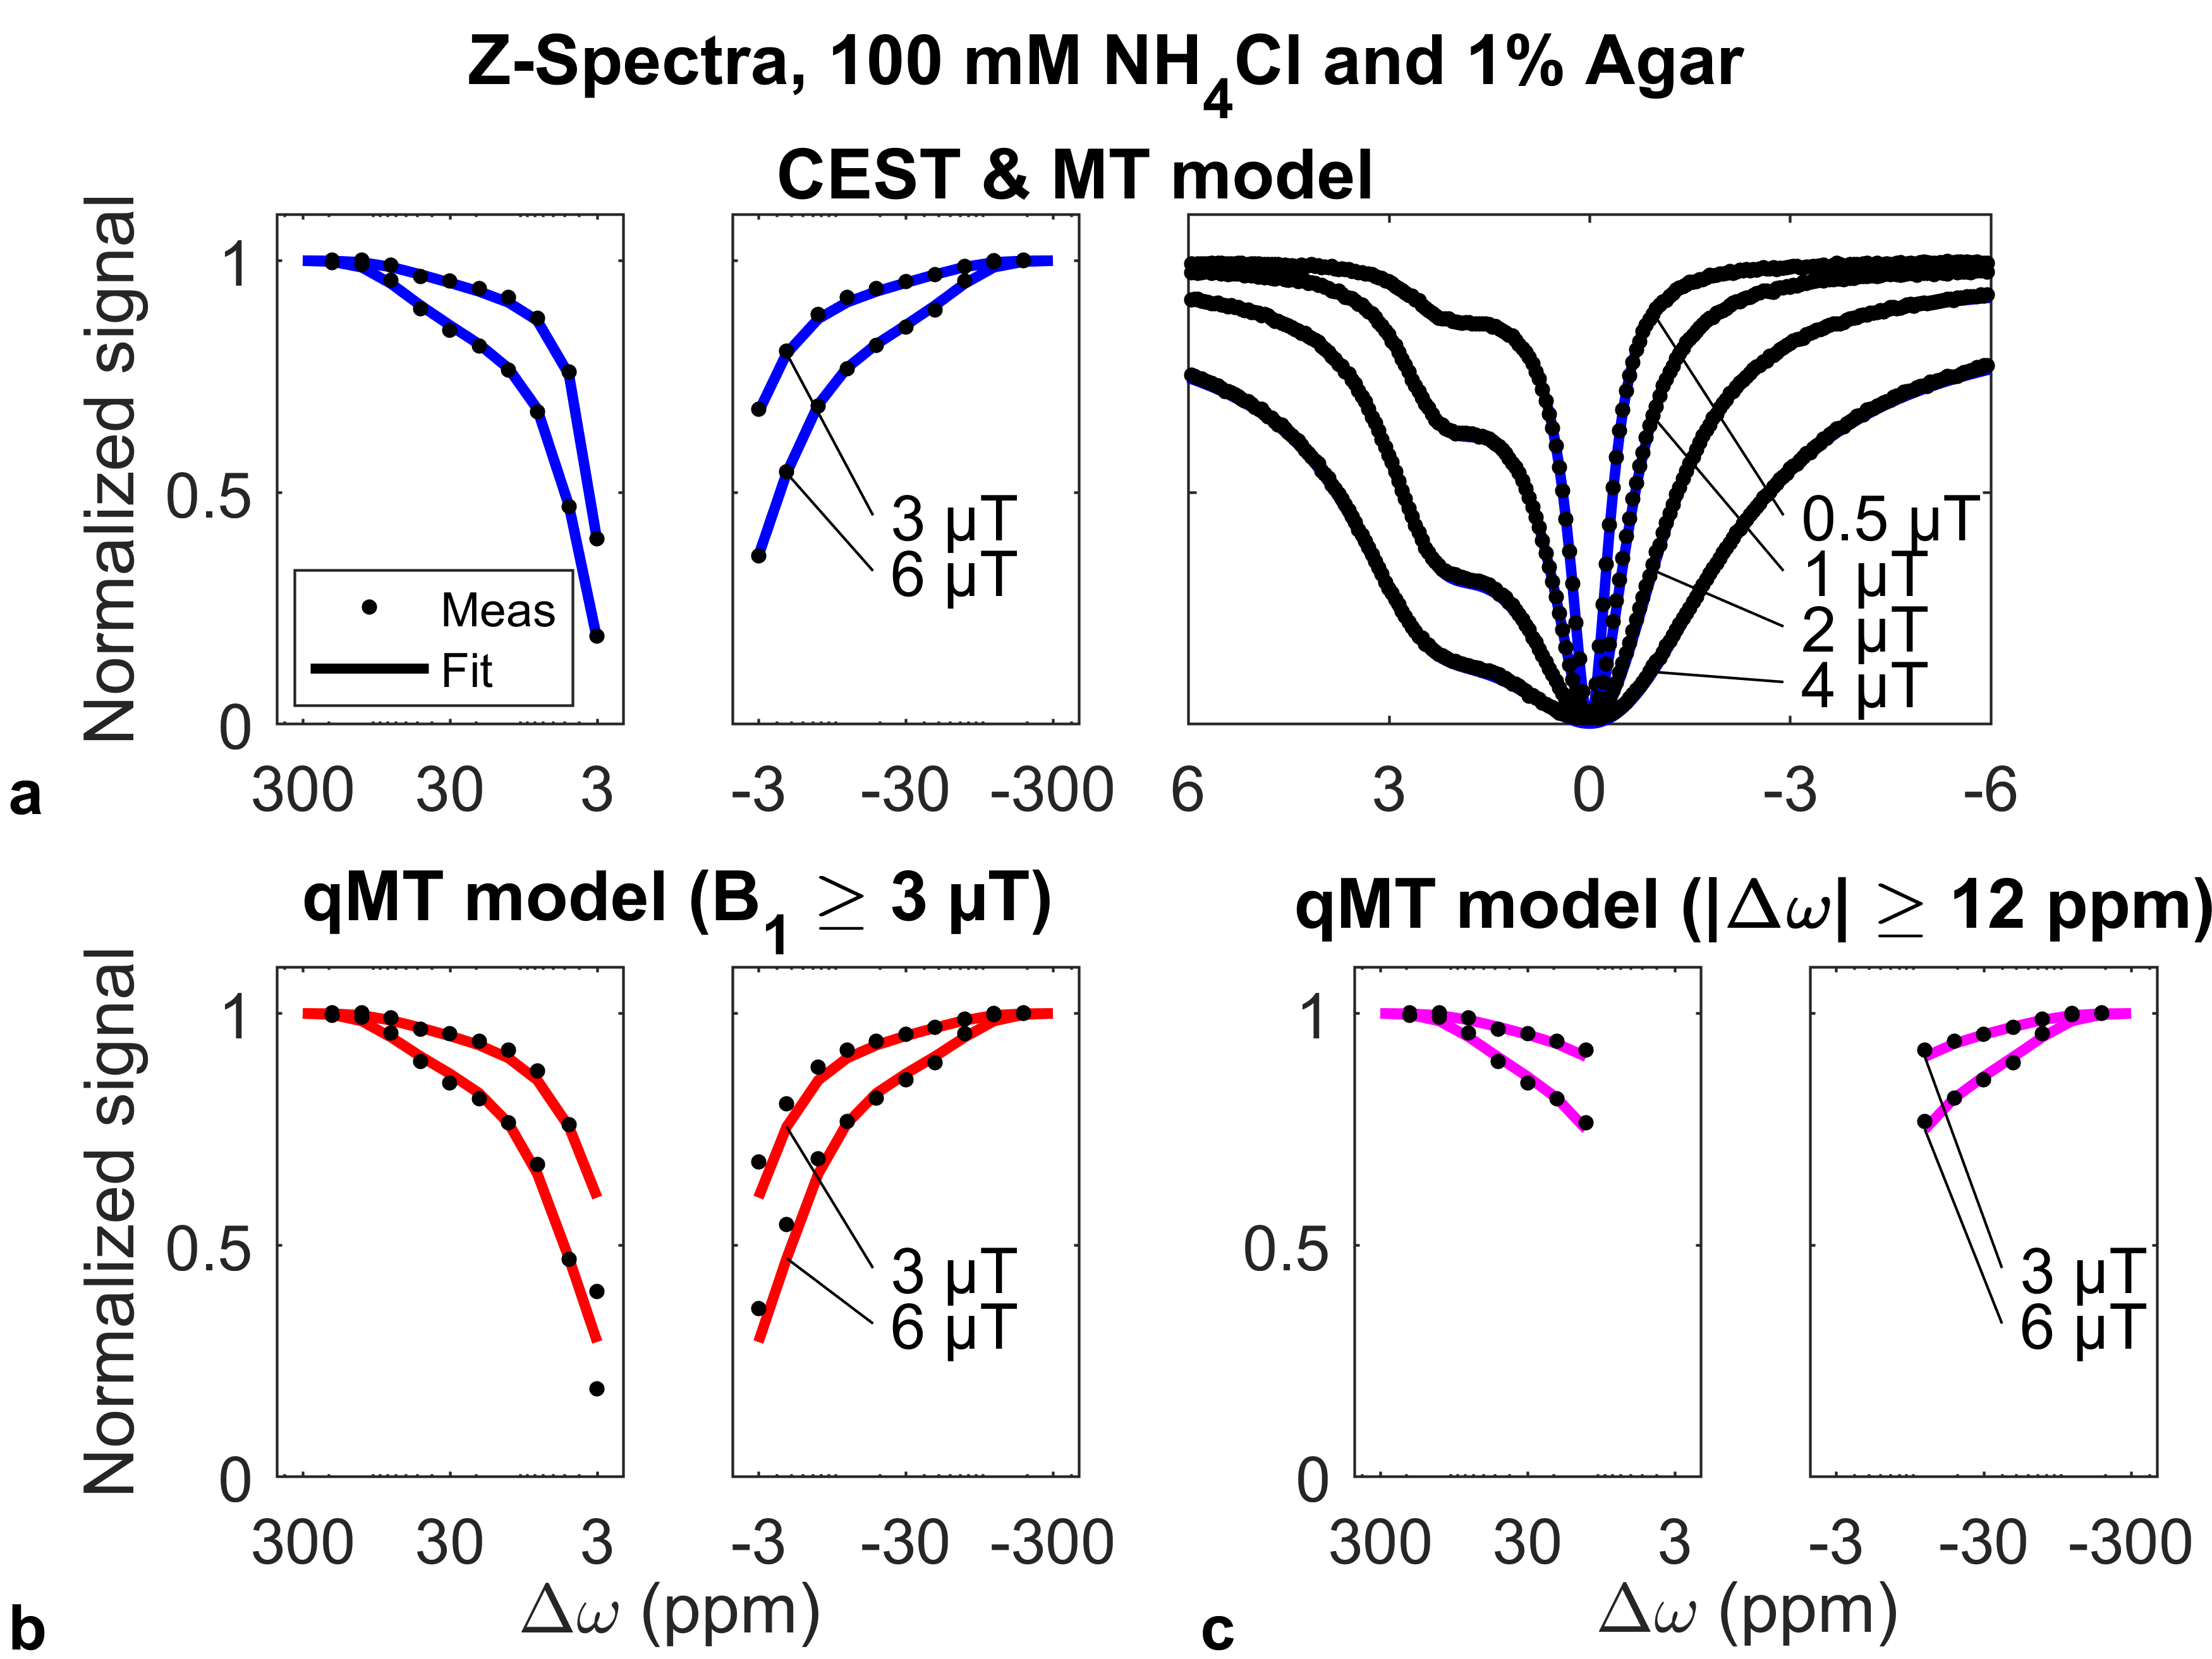
Figure 2 shows representative measured and fitted Z-spectra for all fitting procedures from the 0.5% agar sample. Fitting the combined CEST and MT model (Procedure 1) shows excellent agreement (Fig. 2a) as does Procedure 3 (Fig. 2c) with χ2reduced = 1.22 and 3.14, respectively, where χ2reduced = 1 indicates a perfect fit. Fitting with Procedure 2 (Fig. 2b) performs poorly with χ2reduced = 79, indicating an inadequate model, due to CEST contributions in the Z-spectra, for which the two-pool qMT model doesn’t account.
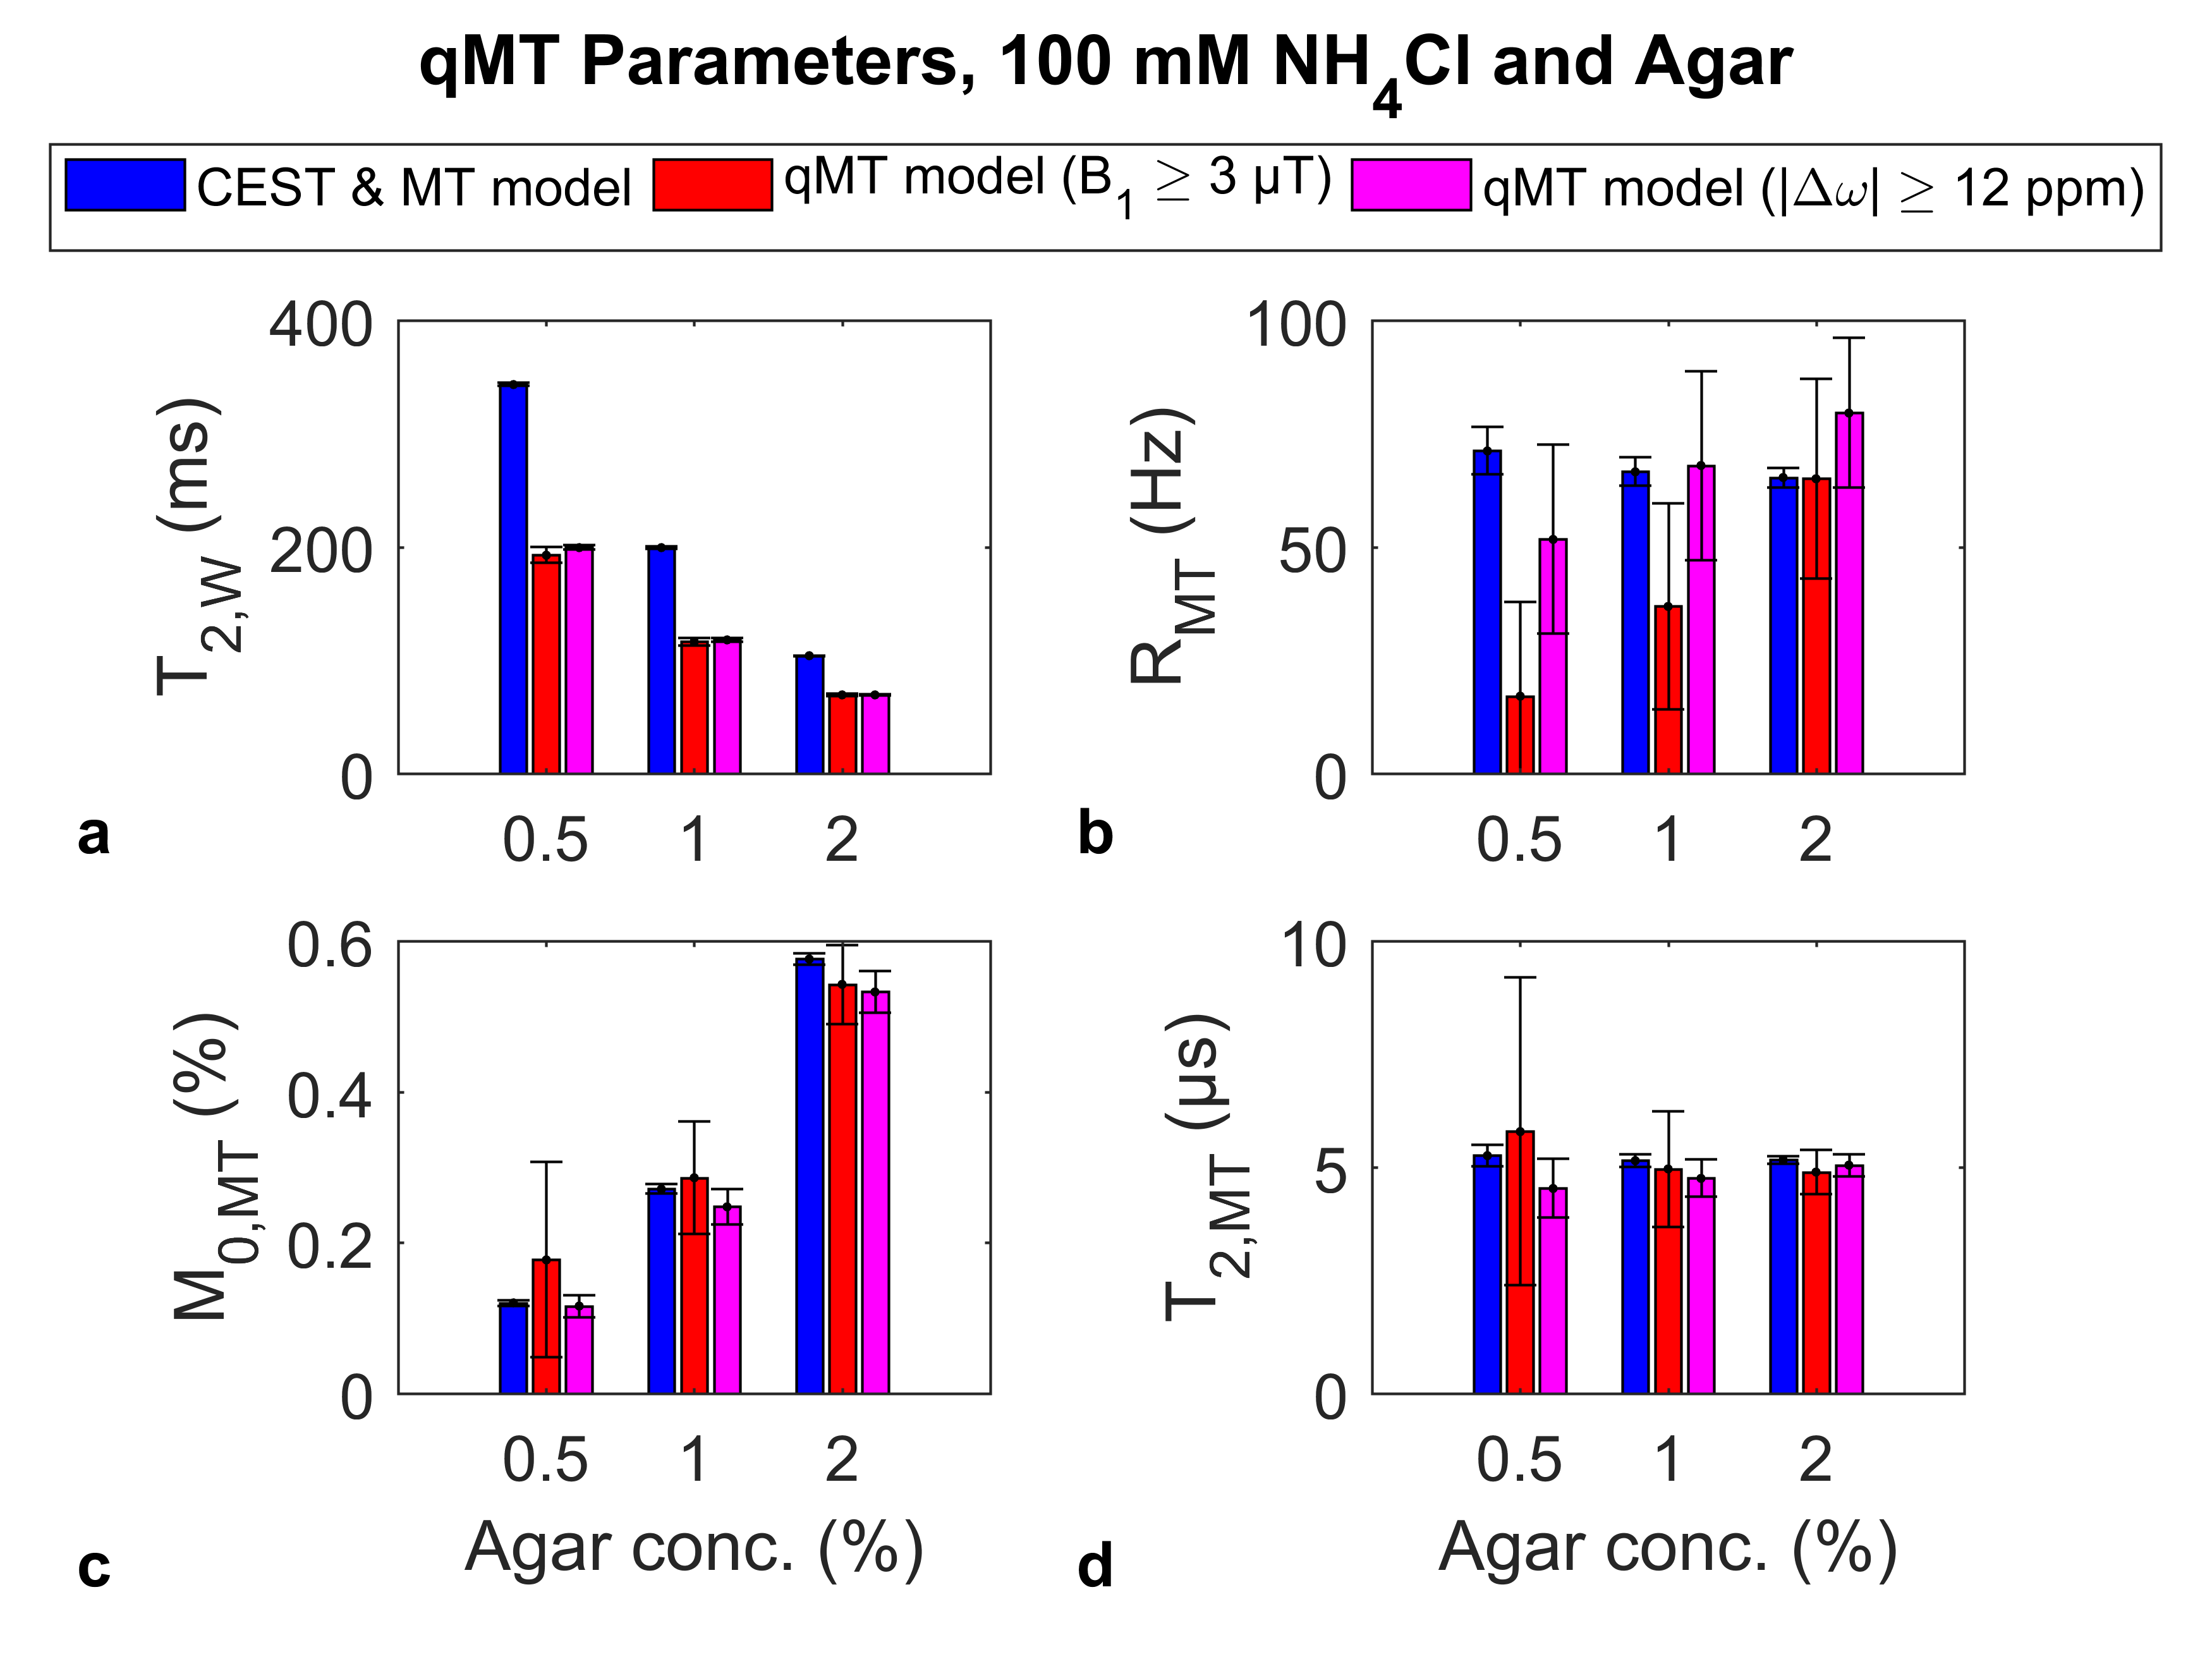
Figure 3 shows the estimates of the qMT model parameters T2 of the water and MT pools (T2,W and T2,MT, respectively) exchange rate (RMT), and MT pool size relative to that of water (M0,MT). Procedure 1 (blue) is taken to be truth as it was fitted to all data. Procedures 2 and 3 (red and magenta, respectively) significantly underestimate T2,W for all samples. Procedure 2 underestimates RMT for 0.5 and 1% agar, possibly due to CEST contamination, but Procedure 3, which removed some of the CEST contribution, has better accuracy for 1 and 2% agar, albeit with large uncertainty. M0,MT and T2,MT are in agreement between all fitting procedures, but have larger uncertainty with Procedure 2.
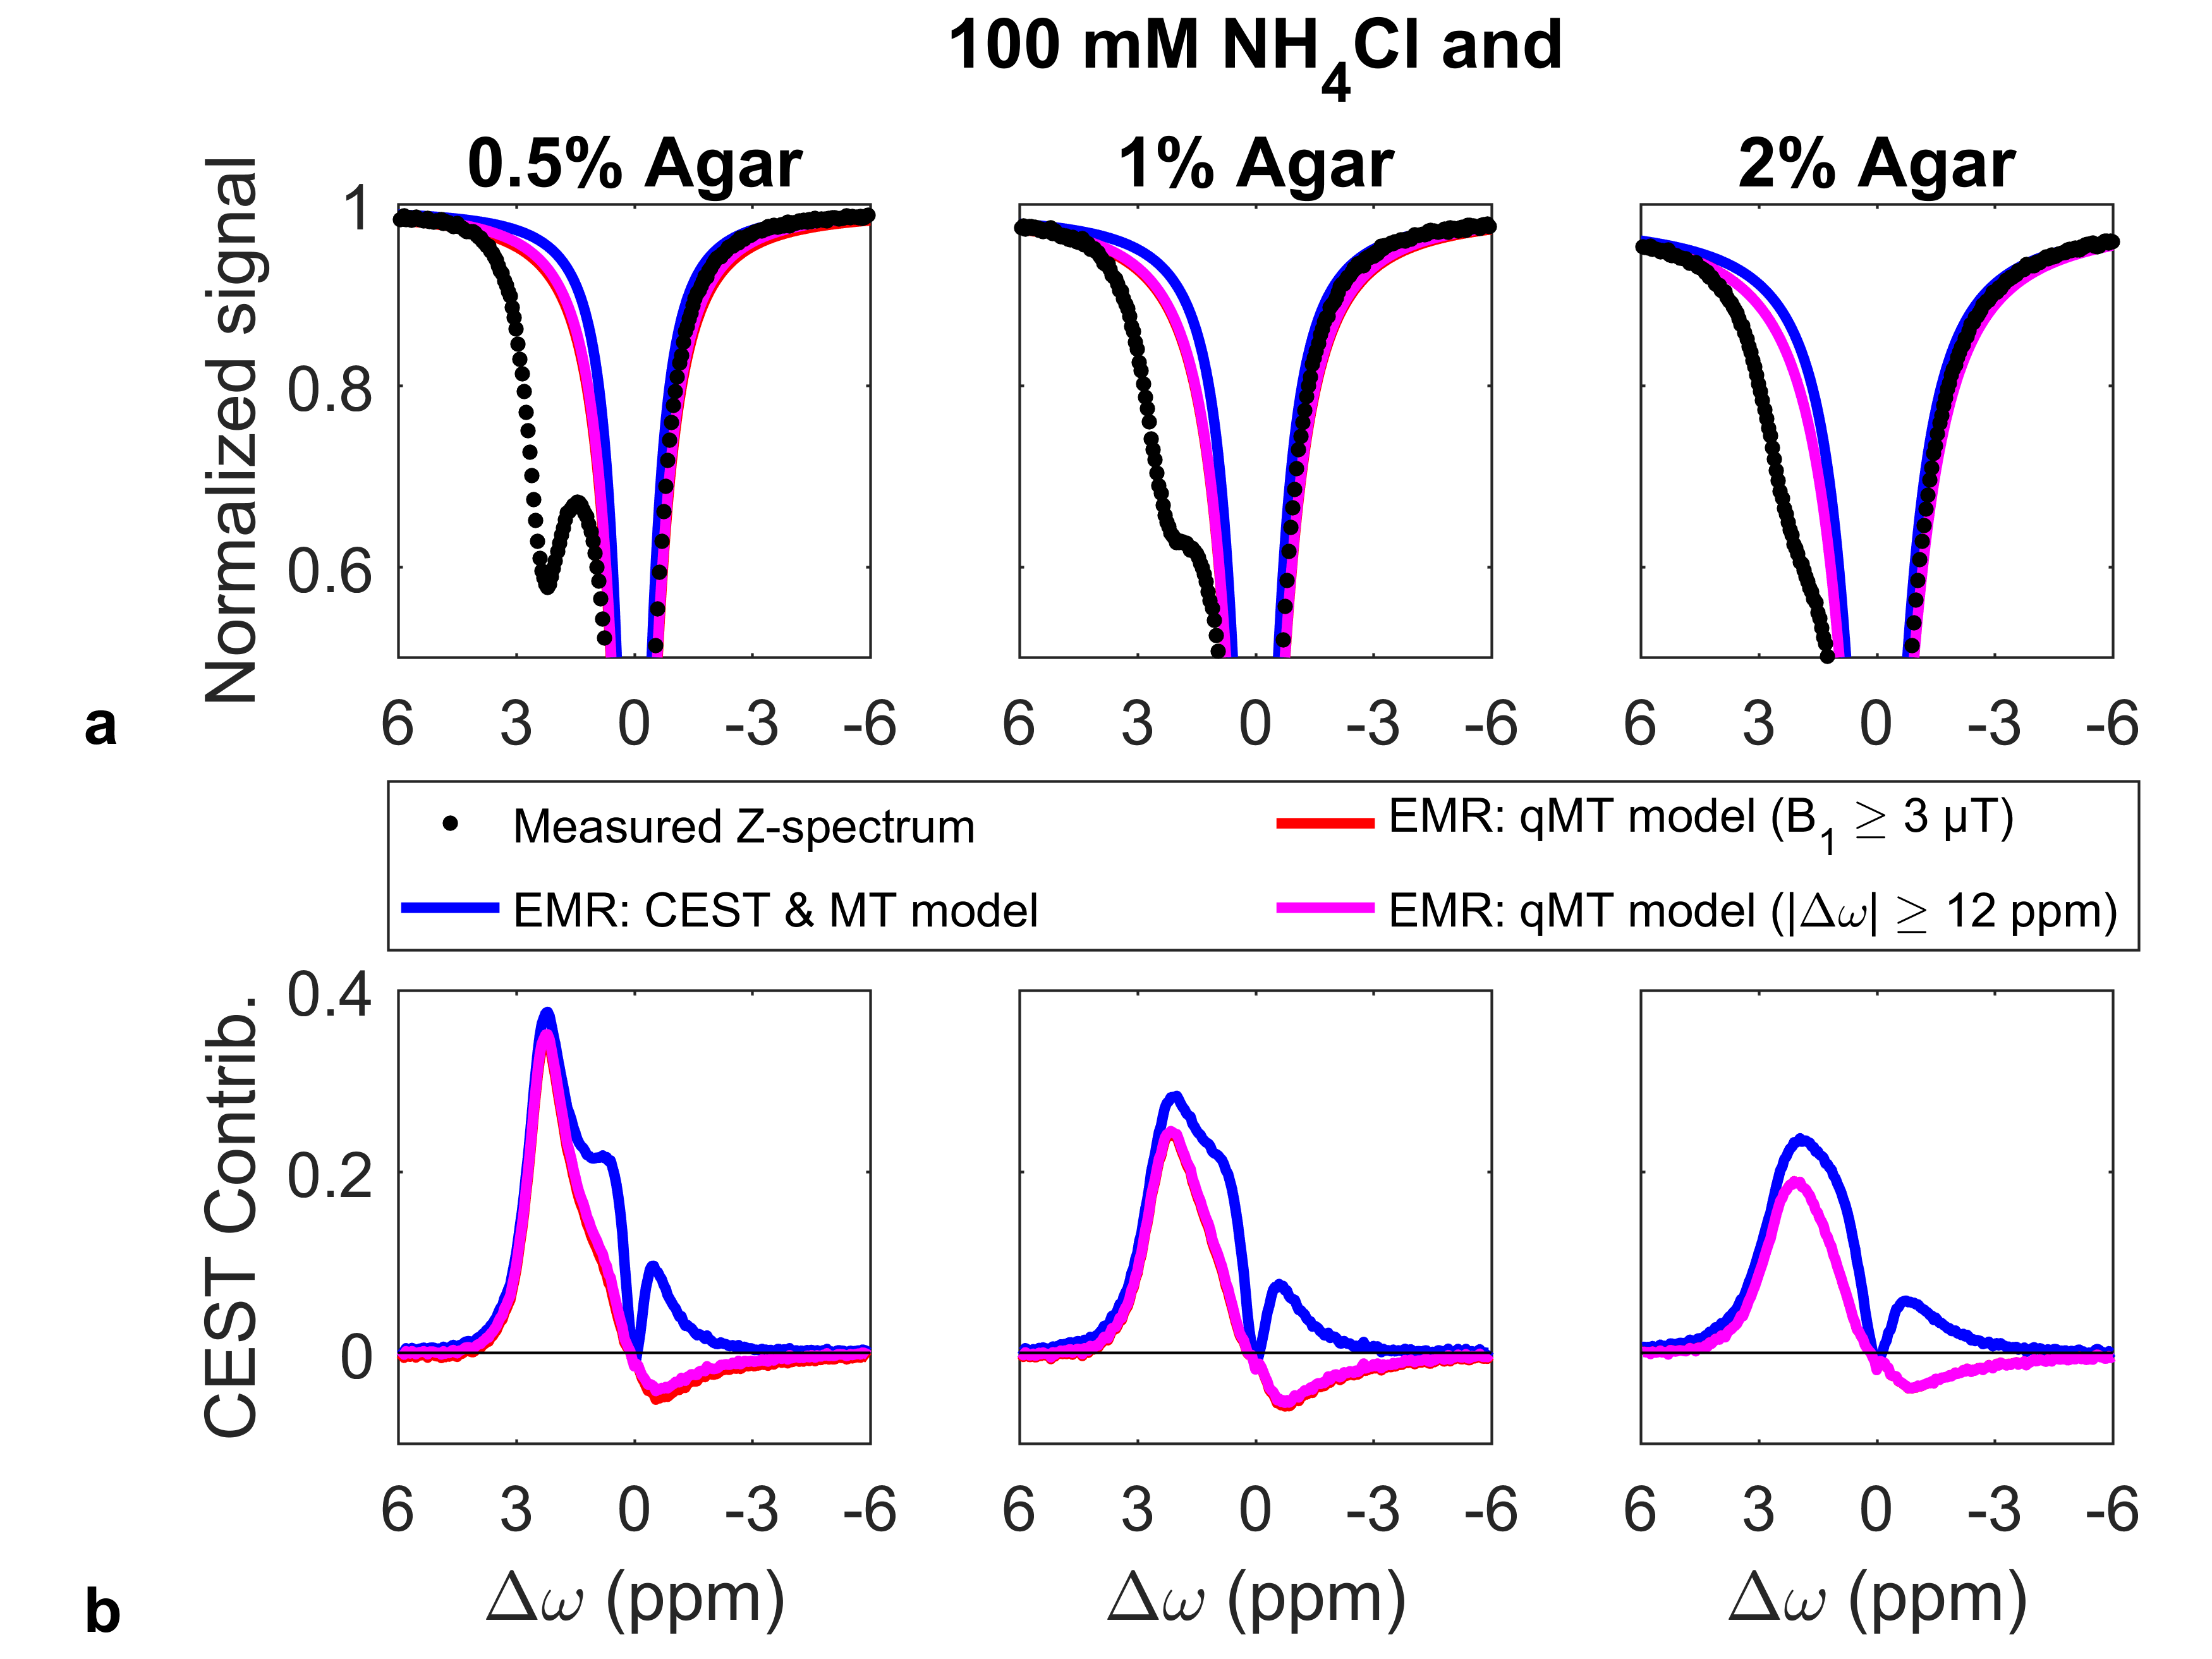
Figure 4a shows the measured Z-spectra (points) and the extrapolated MT reference (EMR) spectra (lines) at a saturation B1 of 1 µT. The contribution from the CEST component is calculated by subtracting the measured Z-spectrum from the EMR. The methods that fitted the qMT model to only the high B1 Z-spectra underestimated the peak CEST contribution (red and magenta lines in Fig. 4b) compared to that from the three-pool model (blue lines in Fig. 4b) by 7, 13, and 20% for 0.5, 1, and 2% agar, respectively. Furthermore, the former (red and magenta lines) show a non-physical negative CEST contribution near the water absorption peak at 0 ppm (discussed in Ref. 2), whereas the latter (blue lines) faithfully describes the coalescence of the CEST line shape with that of water due to exchange.
Discussion and Conclusion
There is bias in the estimation of two qMT model parameters water pool T2 (T2,W)
and exchange rate between water and MT pools (RMT), despite discarding measurements at frequency offsets
between 0 and ±12 ppm at high saturation B1. This
error is propagated in techniques that aim to estimate the MT effect at high B1
while assuming no CEST contamination and then extrapolating an MT-only
Z-spectrum to a lower B1. Robust methods that use simultaneous
fitting of all MT, CEST, and rNOE pools should be used for better accuracy.Acknowledgements
The authors thank the Canadian Institutes for Health Research (PJT148660) for financial support.References
- Heo H, Zhang Y, Jiang S, et al. Quantitative Assessment of Amide Proton Transfer (APT) and Nuclear Overhauser Enhancement (NOE) Imaging with Extrapolated Semisolid Magnetization Transfer Reference (EMR) Signals: II. Comparison of Three EMR Models and Application to Human Brain Glioma at 3 Tesla. Magn Reson Med. 2016;75(4):1603–1639.
- Lam WW, Oakden W, Murray, L, et al. Differentiation of Normal and Radioresistant Prostate Cancer Xenografts Using Magnetization Transfer-Prepared MRI. Sci Rep. 2018;8(1):10447.
- Morrison C, Henkelman RM. A Model for Magnetization Transfer in Tissues. Magn Reson Med. 1995;33(4):475–482.
- Zhou J, Payen J, Wilson D, et al. Using the amide proton signals of intracellular proteins and peptides to detect pH effects in MRI. Nat Med. 2003;9(8):1085–1090.
- Kim M, Gillen J, Landman B, et al. Water saturation shift referencing (WASSR) for chemical exchange saturation transfer (CEST) experiments. Magn Reson Med. 2009;61(6):1441–1450.
- Desmond KL, Stanisz, GJ. Understanding quantitative pulsed CEST in the presence of MT. Magn Reson Med. 2012;67(4):979–990.
Figures