5013
Improved tumor characterization with direct saturation corrected (DISC) amide proton transfer (APT) MRI in glioma patients1Paul C. Lauterbur Research Center for Biomedical Imaging, Shenzhen Institutes of Advanced Technology, Chinese Academy of Sciences, Shenzhen, China, 2Department of Neurosurgery, Cancer Center, Sun Yat-Sen University, Guangzhou, China, 3Department of Medical Imaging, Cancer Center, Sun Yat-Sen University, Guangzhou, China, 4Yerkes Imaging Center, Yerkes National Primate Research Center, Emory University, Atlanta, GA, United States, 5Department of Radiology, Emory University School of Medicine, Atlanta, GA, United States
Synopsis
Recently, a direct saturation correction (DISC) method has proved to improve APT quantification in pulsed-RF CEST imaging. In this study, performance of tumor characterization was compared among routine asymmetry analysis (MTRasym), three-point offset (APT3pts) and the DISC methods in glioma patients at 3T. Although all methods revealed significant APT elevation in tumor region compared to that in the contralateral normal appearing white matter, the DISC method exhibited substantially higher contrast-to-noise ratio (2.16±0.90) between the two regions than that of MTRasym (1.78±1.08) and APT3pts (0.87±0.57), demonstrating its superiority in improved sensitivity for tumor characterization.
Introduction
Amide proton transfer (APT) MRI has been increasingly adopted for glioma imaging [1-3]. However, routine asymmetry analysis (MTRasym) is susceptible to concomitant contributions, including magnetization transfer (MT) or nuclear overhauser enhancement (NOE) effects that hinders accurate APT quantification [4]. A direct saturation correction (DISC) method was proposed to improve APT quantification by correction of the nonlinear direct water saturation (DWS) in continuous-wave CEST imaging [5]. Recently, we extended the method in pulsed-RF CEST imaging, and the concomitant MT and NOE effects could be further decoupled with a one-pool Lorentzian function. Its advantage in identification of tumor from necrosis was demonstrated in a glioma rodent model after chemoradiotherapy [6]. In this study, performance of the DISC method in tumor characterization was evaluated in histologically proven glioma patients, with comparing to that of the routine MTRasym and three-point (APT3pts) methods.Materials and methods
MR study: The study was approved by the local institutional ethics committee. Thirteen histologically proved glioma patients were retrospectively enrolled in the study, among them seven patients were untreated and the remaining had tumor recurrence. Multi-parametric MR imaging was conducted on a 3 T scanner (Discovery MR750, GE), including T1 (TR/TE=8000/8.8 ms, inversion time (TI) =200, 500, 800, 1100 and 1400 ms), T2 (TR/TE1/TE2=3000/41/95 ms), pulsed-RF APT MRI with SE-EPI readout (TR/TE=2500/23.3 ms, average B1=1.0 μT, 3 RF pulses with duration=400 ms, frequency offsets between ±6 ppm), and Gd-enhanced T1w MRI (TR/TE=155/1.9 ms).
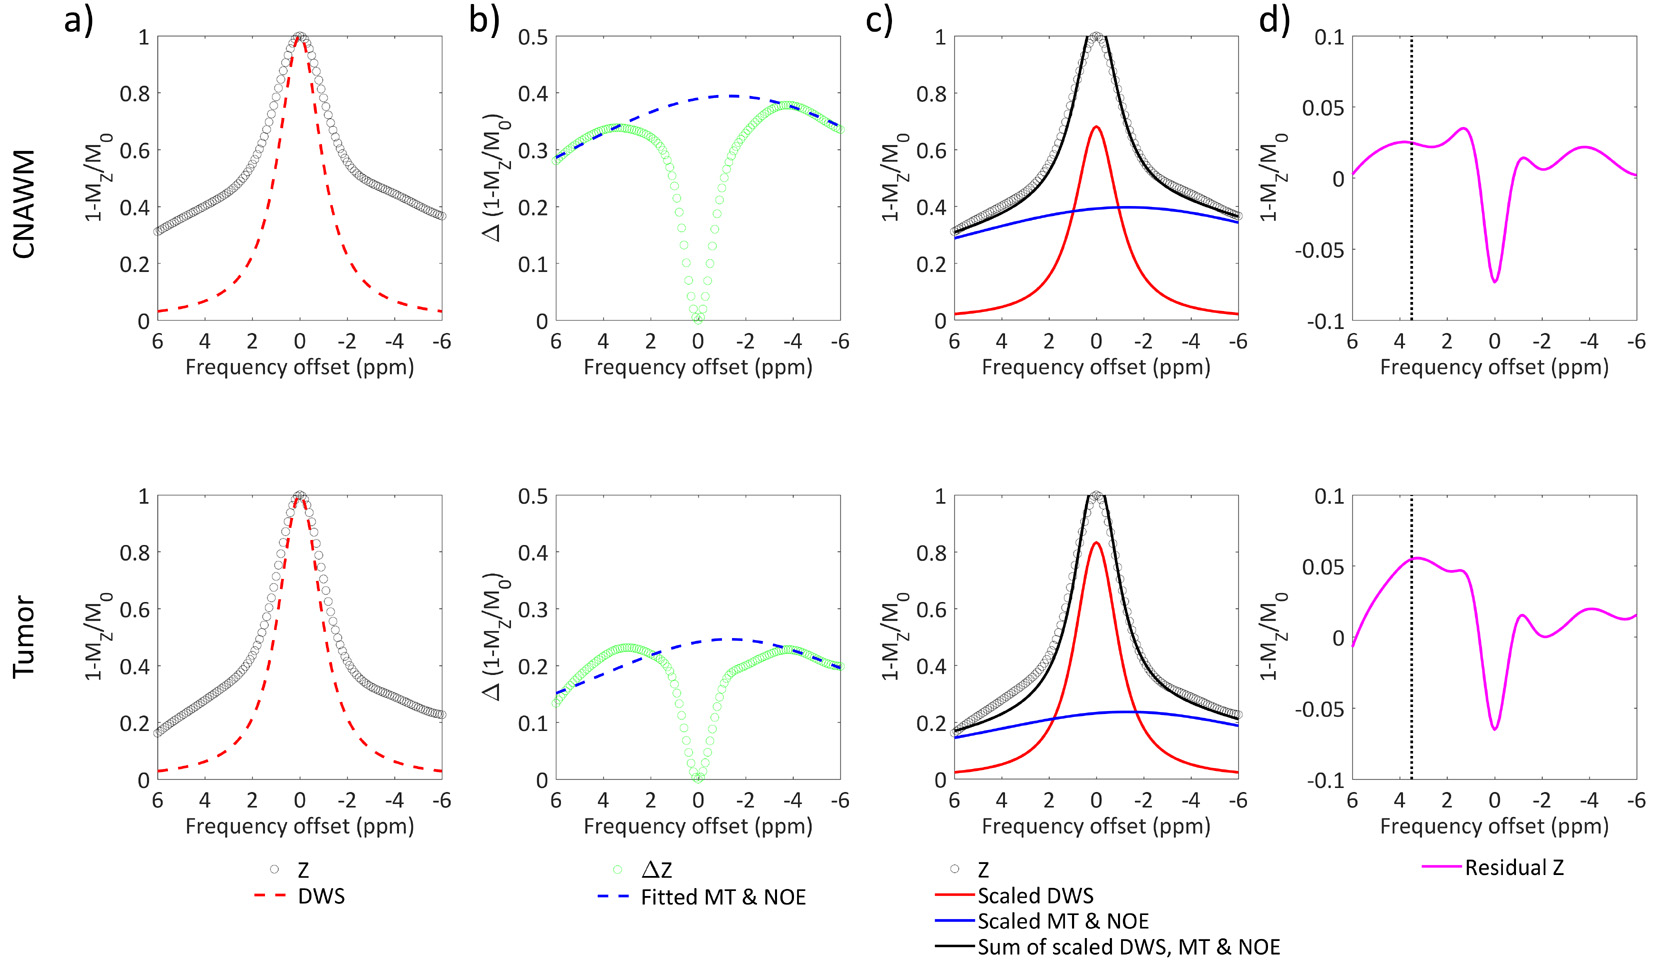
Data analysis: T1 and T2 maps were obtained from equations of I(i) = I0[1-(1-η)-TIi/T1] and I(i) = I0e-TEi/T2, respectively, where η is the inversion efficiency, TIi is the ith inversion time and TEi is the ith echo time. Normalized Z-spectra (Z) was corrected for B0 inhomogeneity. MTRasym were calculated as MTRasym = Z(-3.5 ppm)-Z(3.5 ppm). APT was alternatively measured with the three-point method as, APT3pts = [Z(2 ppm)+Z(5 ppm)]/2-Z(3.5 ppm). For the DISC analysis, DWS was described by Jiang [7]. Mixed MT and NOE was determined by one-pool Lorentzian fitting of the partially residual Z. The obtained DWS and mixed MT and NOE were further scaled by fitting their sum to the acquired Z-spectrum. Then, APT was quantified by subtracting the concomitant DWS, MT and NOE effects from the measured CEST signal at 3.5 ppm [6]. MTRasym, APT3pts and DISC APT were measured in regions of tumor and contralateral normal appearing white matter (CNAWM) determined from Gd-enhanced images. Contrast-to-noise ratio was calculated as CNR = (SCNAWM-Stumor)/sqrt[(σCNAWM2+σtumor2)/2], where S and σ represent the signals and their SDs from the CANWM and tumor regions. Student’s t-test was applied with P<0.05 considered statistically significant.
Results
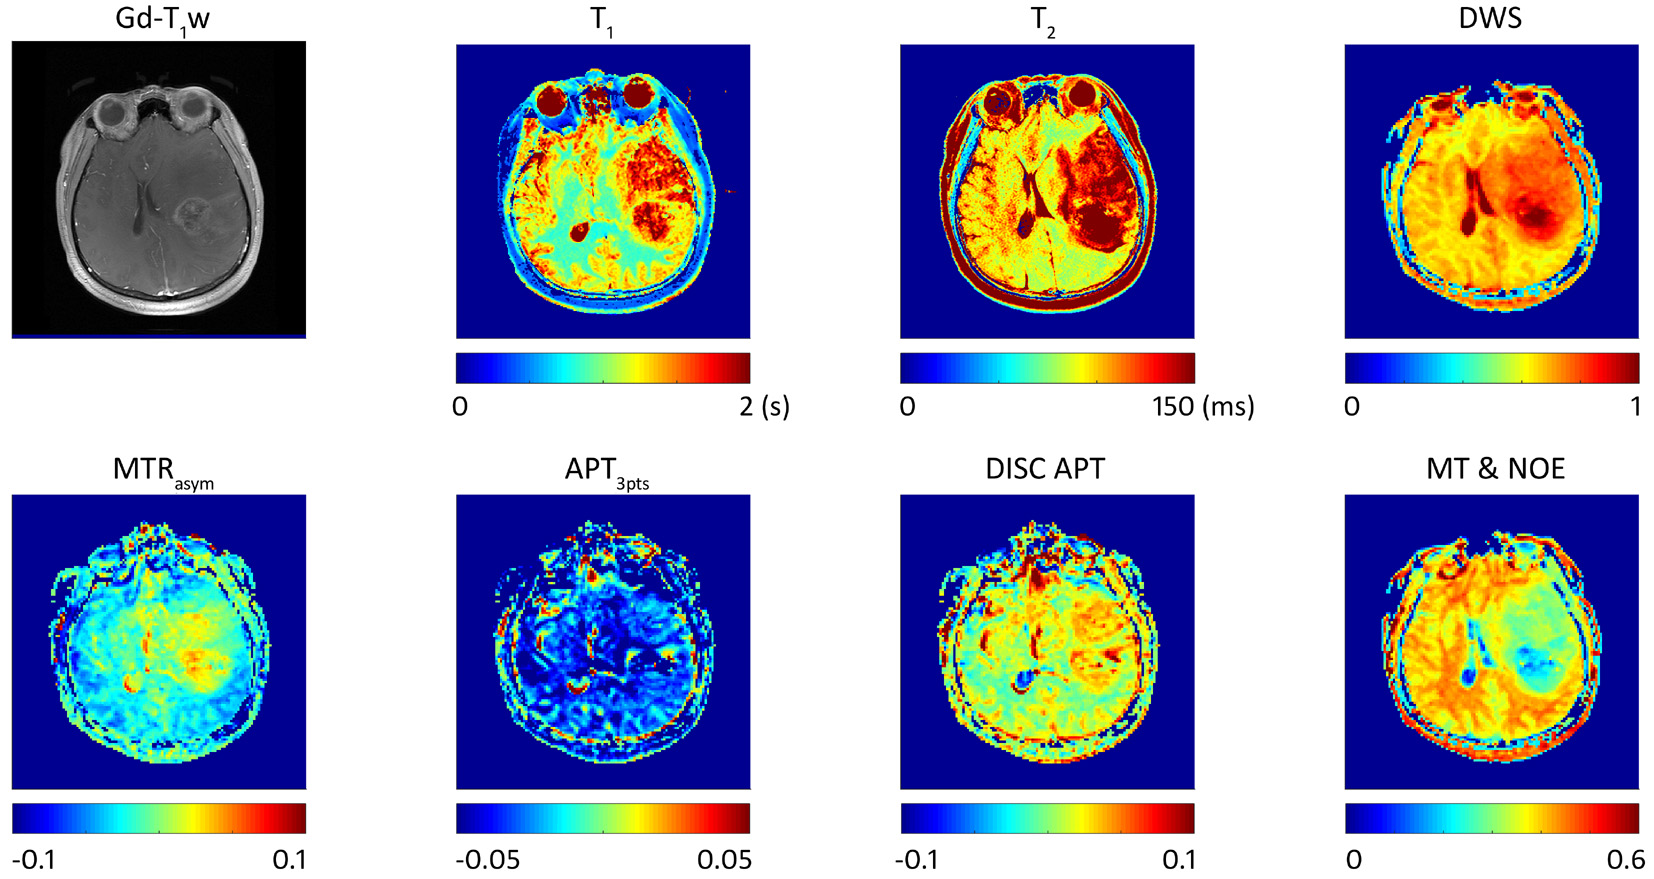
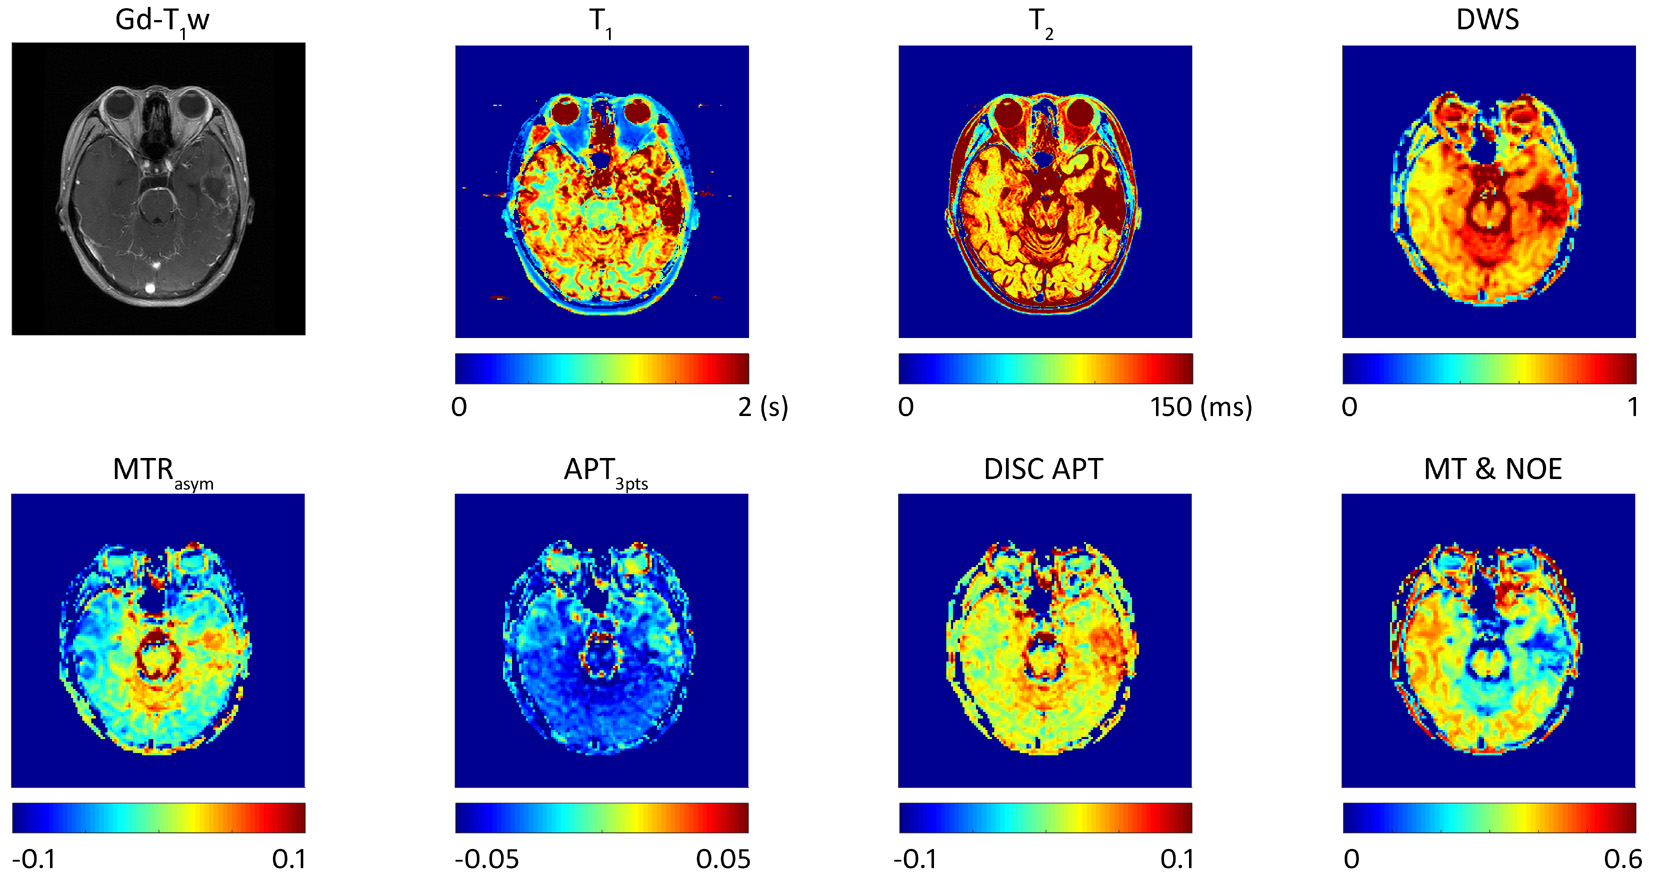
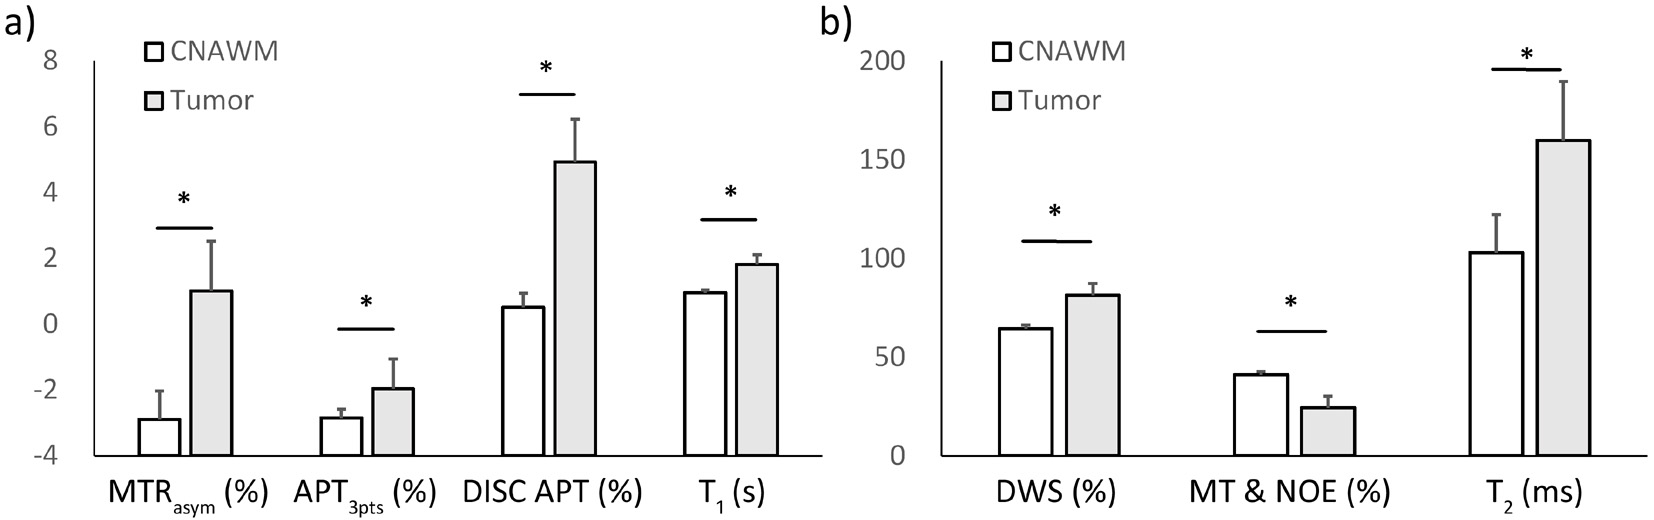
Figure 1 illustrates the determination procedure of DWS, mixed MT and NOE effects, and APT with the DISC method in the CNAWM and tumor regions of a representative patient. The resolved DISC APT effect was found to be substantially higher in tumor than that in CNAWM (Fig. 1d). Figure 2 shows multi-parametric MR images of a representative patient before glioma treatment. Hyperintense of T1, T2, DWS, MTRasym, and DISC APT was apparent in the tumor region. In comparison, the mixed MT and NOE effect decreased in the tumor region with respect to that in the CNAWM. APT3pts exhibited no substantial difference between the two regions. Similar results were observed in a patient with glioma recurrence (Fig. 3). T1, T2, DWS, MTRasym, APT3pts and DISC APT maps exhibited positive contrast in the recurrent tumor peripheral to the residual cavity after surgery, whereas the mixed MT and NOE showed negative contrast. Although the MTRasym, APT3pts and DISC APT in the tumor region were significantly higher than that in the CNAWN (p<0.05) averaged among all patients, the CNR of DISC APT (2.16±0.90) between the two regions was found to be substantially greater than that of MTRasym (1.78±1.08) and APT3pts (0.87±0.57), demonstrating improved sensitivity of tumor characterization with DISC APT.Conclusion
The recently proposed DISC APT was employed in histologically proved glioma patients. Results show the DISC APT improves tumor characterization with substantially higher CNR than that of the routine MTRasym and APT3pts, facilitating cancer identification and treatment evaluation at clinical magnetic field strength with enhanced sensitivity.Acknowledgements
Grant Support: NSFC (81571668 and 81871348), National Basic Research Program of China (2015CB755500), Guangdong Special Support Program (2016TQ03R272), and Shenzhen Science and Technology Program (GJHZ20160229200622417, JCYJ20170307165550864 and JCYJ20170413161350892).References
[1] Zhou J, Lal B, Wilson DA, Laterra J, van Zijl PCM. Amide proton transfer (APT) contrast for imaging of brain tumors. Magn Reson Med. 2003;50:1120-6
[2] Togao O, Yoshiura T, Keupp J, et al. Amide proton transfer imaging of adult diffuse gliomas: correlation with histopathological grades. Neuro Oncol. 2014;16(3):441-8
[3] Sagiyama K, Mashimo T, Togao O, et al. In vivo chemical exchange saturation transfer imaging allows early detection of a therapeutic response in glioblastoma. Proc Natl Acad Sci U S A. 2014;111(12):4542-7
[4] Zhou J, Blakeley JO, Hua J, et al. Practical data acquisition method for human brain tumor amide proton transfer (APT) imaging. Magn Reson Med. 2008;60(4):842-9
[5] Zhou IY, Wang E, Cheung JS, Lu D, Ji Y, Zhang X, Fulci G, Sun PZ. Direct saturation-corrected chemical exchange saturation transfer MRI of glioma: Simplified decoupling of amide proton transfer and nuclear overhauser effect contrasts. Magn Reson Med. 2017 Dec;78(6):2307-2314
[6] Wu Y, Chen Y, Zhao Y, Yang S, Zhao J, Zhou J, Chen Z, Sun PZ, Zheng H. Direct saturation corrected amide proton transfer tumor MRI at 3 Tesla. Magnetic Resonance in Medicine doi:10.1002/MRM.27562
[7] Jiang W, Zhou IY, Wen L, Zhou X, Sun PZ. A theoretical analysis of chemical exchange saturation transfer echo planar imaging (CEST-EPI) steady state solution and the CEST sensitivity efficiency-based optimization approach. Contrast Media Mol Imaging 2016;11(5):415-423.
Figures