5012
Phosphocreatine CEST (PCrCEST) Detects Phosphocreatine and pH Changes in the Muscle at 15.2T1Center for Neuroscience Imaging Research, Institute for Basic Science (IBS), Suwon, Korea, Republic of, 2Samsung Advanced Insitute for Health Sciences and Technology, SKKU, Seoul, Korea, Republic of, 3Radiology, University of Pittsburgh, Pittsburgh, PA, United States, 4Biomedical Engineering, Sungkyunkwan University, Suwon, Korea, Republic of, 5Radiology, Samsung Medical Center, Sungkyunkwan University School of Medicine, Seoul, Korea, Republic of
Synopsis
Phosphocreatine plays a major role in the metabolic upkeep of tissues such as the muscles and the heart. Chemical Exchange-sensitive MRI has been shown to have sensitivity to phosphocreatine. We examine the sensitivity of Phosphocreatine CEST (PCrCEST) to changes in phosphocreatine levels and pH via PCrCEST imaging in the mouse hindlimb while inducing euthanasia and present high resolution PCrCEST maps in the ante- and post-mortem.
Introduction
Creatine dephosphorylation is a vital process involved in the metabolic upkeep of tissues with high energy expenditure such as the brain, muscles, and heart(1). An understanding of how metabolites such as phosphocreatine fluctuate in these tissues is highly beneficial to the understanding of metabolic well-being. Phosphocreatine has been shown to have been shown to exhibit chemical exchange(2) which may be useful to characterize the usage of phosphocreatine and the changes in pH environment of these metabolites that are common to both muscular exertion(3) and death(4). Therefore, our goal was to investigate how PCrCEST tracks dynamic changes in the muscle that occur before and after euthanasia.Methods
A total of 17 male C57BL/6 mice (20-30g) were anesthetized with isoflurane and controlled at 37.2±0.5°C. 31P-MRS was performed on a Bruker Biospec 9.4T/30-cm using a 4.0-cm ID dual tuned coil [1H and 31P] while CEST experiments were performed on a Bruker Biospec 15.2T/11-cm instrument using a 3.5-cm ID volume coil. CEST was measured before and 30 minutes after euthanasia with a RF-spoiled TurboFLASH readout with a center-out phase encoding scheme: flip angle=20.0º, GRE readout TR=10.0ms, TE=1.90ms, image TR=8.0s.
1) 31P-MRS (n=2) was performed via an Image-Selected In vivo Spectroscopy (ISIS) volume localization sequence with a voxel that measured 171 μL.
2) CEST Z-spectra (n=6) were obtained at low resolution (matrix size=64x64, FOV=32mmx32mm and slice thickness=2.0 mm) with B1=0.47μT and TSL=4.0sec at 151 offsets unevenly between Ω=±6.0ppm with reference (S0) images at Ω=300ppm .
High resolution CEST maps (matrix size=96x96, FOV=25mmx25mm and slice thickness=1.5mm) were acquired via three-point approaches using B1=0.47μT and TSL=4.0sec with PCr*=[(S2.3ppm+S2.9ppm)/2 -S2.6ppm]/S0 and Cr*=[(S1.6ppm+S2.2ppm)/2 ̶ S1.9ppm]/S0(5).
3) Dynamic PCr* and Cr* curves (n=3) were acquired starting 30 minutes before euthanasia until about 30 minutes after euthanasia (NA=10, temporal resolution = 5min20s).
4) Static PCr* and Cr* maps (n=6) were acquired before euthanasia and 30 minutes after euthanasia (NA=40).
Results
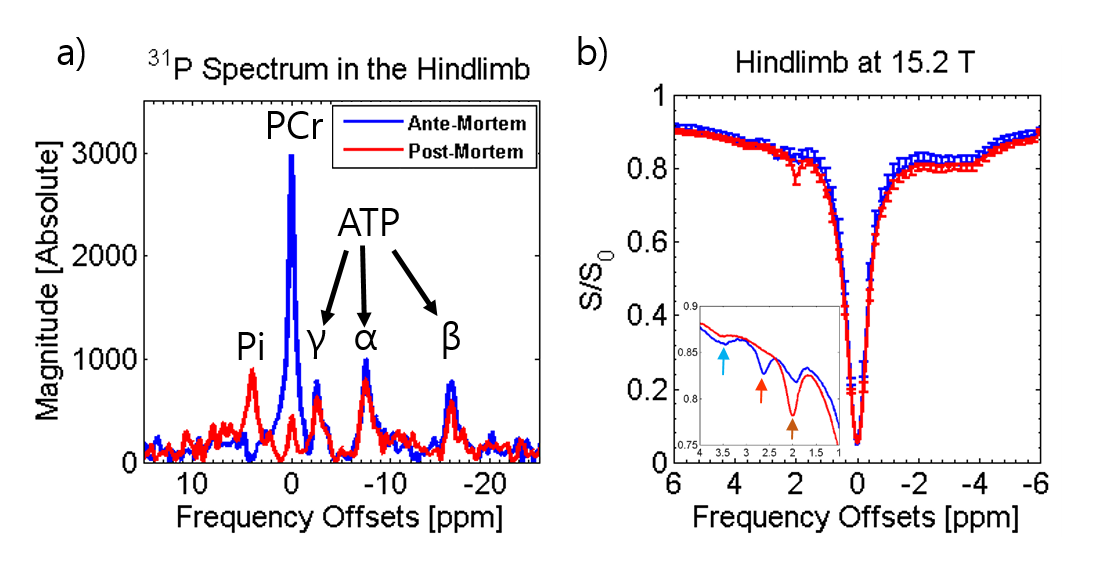
Fig. 1a shows the overlay of the 31P-MRS spectrum acquired in the hindlimb at 9.4T before and after euthanasia. The post-mortem 31P-MRS spectrum shows a dramatic decrease in the PCr peak losing 85% of detected phosphorus and a drop in pH from 7.05 to 6.41. Fig. 1b shows the Z-spectra and the inset shows the enlarged view of the amide, Cr, and PCr peaks before and after euthanasia using 0.47 μT saturation. The PCr peak decreased nearly entirely and the Cr peak increased significantly.
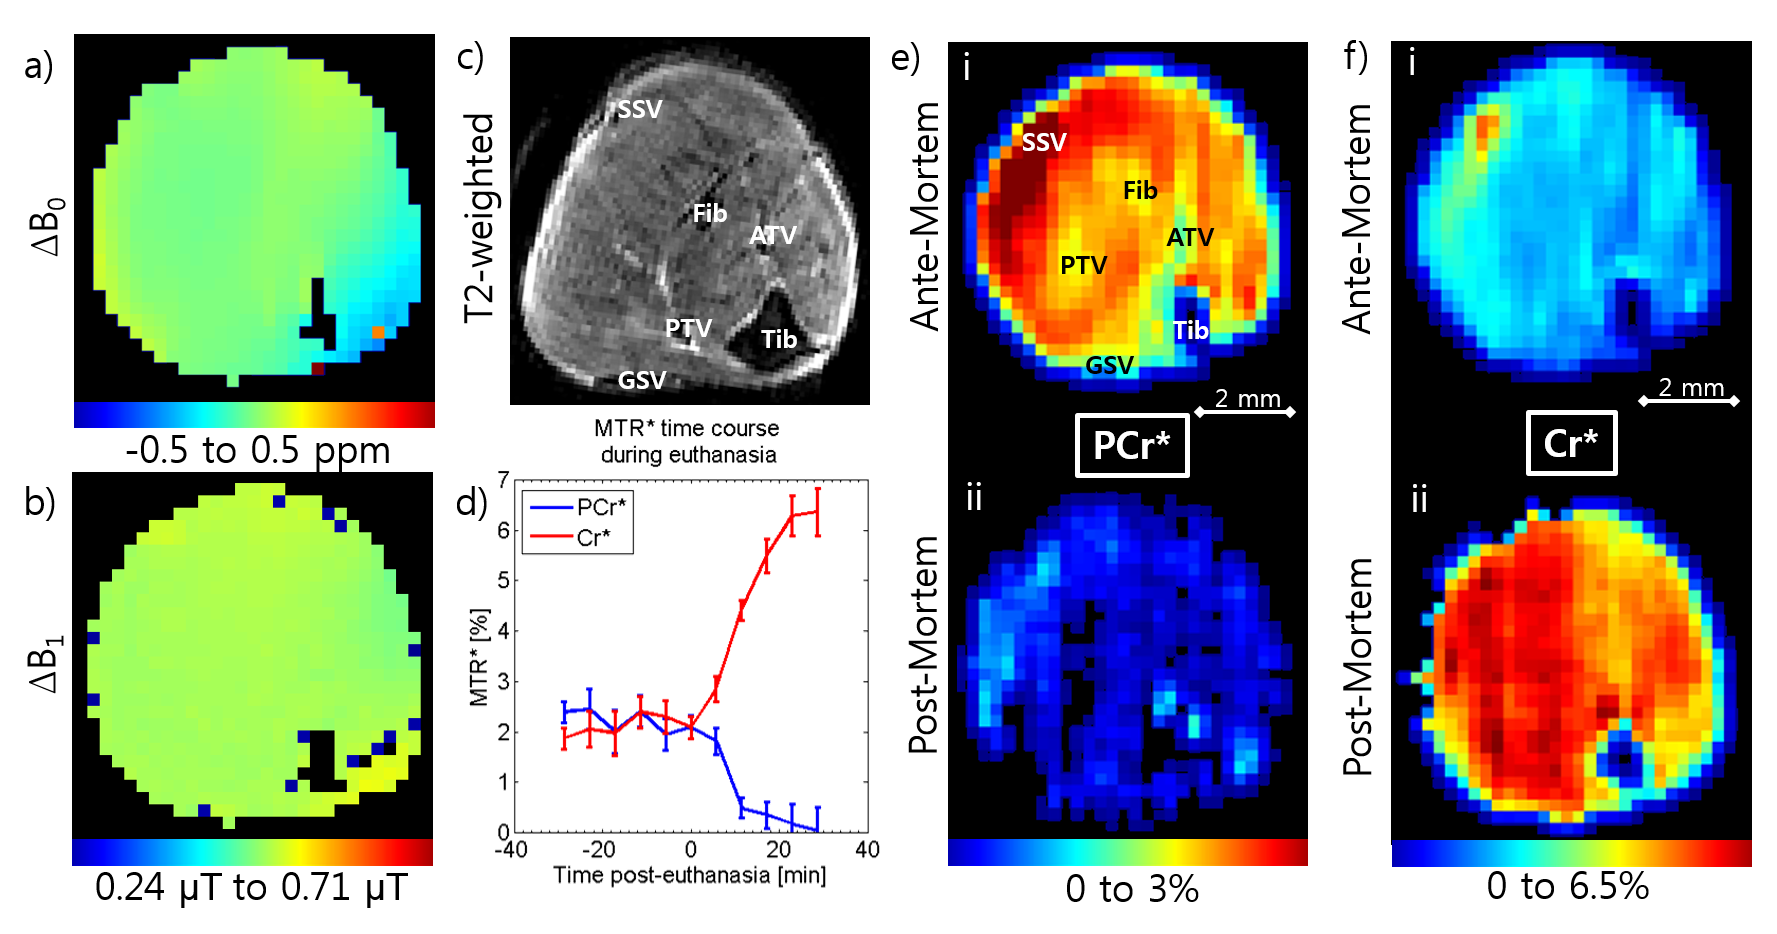
Fig.2a shows exemplary T2 weighted anatomical image acquired in the mouse hindlimb and Fig.2b shows a dynamic time-course of the PCr* and Cr* signal from 30 minutes pre-euthanasia to 30 minutes post-euthanasia (n=3). Before euthanasia, the average signal of PCr* and Cr* fluctuate around the 2% level comparable to the more highly averaged CEST maps (n=6), examples of which are shown in Fig.2c[i] for PCr* and Fig.2d[i] for Cr* (2.34±0.49% PCr* and 1.75±0.25% Cr*). After the induction of cardiac arrest, PCr* signal starts to drop rapidly while Cr* signal begins to increase (Fig.2b). The decrease rate in PCr* begins to reduce as it gets closer to 0% at around 30 minutes post-euthanasia while Cr* increase tapers off to ~6.5%. The static post-mortem images were acquired at this point and PCr* maps show a drastic drop in signal of 109% to a PCr* to -0.21±0.05% (Fig. 6c[ii]), while Cr* maps (Fig. 6d[ii]) show a dramatic increase of 196% to Cr* of 5.18±1.70%.
Discussion
The 85% decrease in PCr consumed to replenish ATP as well as the drop in pH that we saw in our 31P-MRS data (pH 7.05 to pH 6.41) resulted in a drop in PCrCEST of 109%. Though pH can account for part of the decrease in PCrCEST signal, the comparatively smaller drop in APT seen in the Z-spectra necessitates that the drop is at least in part due to phosphorylative changes. The 196% increase in the Cr* is similarly due to the shift toward slower exchange from the drop in pH as well as the conversion of PCr to Cr from dephosphorylation. The relatively similar NOE and direct saturation means the changes in PCr* and Cr* are not likely attributed to T1 and T2. While PCrCEST was able to track the changes in PCr and its pH environment over time, improving temporal resolution with sufficient contrast will be an important challenge to undertake in the future.Conclusion
PCrCEST is a technique that tracks PCr changes and its pH environment in the muscle at high fields and shows promise for the study of metabolic dysfunction and cardiac systems.Acknowledgements
This work was supported by the Institute for Basic Science (IBS-R015-D1) and a National Research Foundation of Korea (NRF) grant funded by the Korean government (MSIP) (2016R1A2A1A05004952).References
1. Chance B, Williams GR. Respiratory enzymes in oxidative phosphorylation. III. The steady state. The Journal of biological chemistry 1955;217(1):409-427.
2. Zu Z, Lin EC, Louie EA, Jiang X, Lankford CL, Damon BM, Does MD, Gore JC, Gochberg DF. Chemical Exchange Rotation Transfer imaging of Phosphocreatine in Muscle. Proceedings of International Society for Magnetic Resonance in Medicine; 2018; Paris, France.
3. Liu M, Walter GA, Pathare NC, Forster RE, Vandenborne K. A quantitative study of bioenergetics in skeletal muscle lacking carbonic anhydrase III using 31P magnetic resonance spectroscopy. Proceedings of the National Academy of Sciences of the United States of America 2007;104(1):371-376.
4. Bertram HC, Donstrup S, Karlsson AH, Andersen HJ, Stodkilde-Jorgensen H. Post mortem energy metabolism and pH development in porcine M. longissimus dorsi as affected by two different cooling regimes. A (31)P-NMR spectroscopic study. Magnetic resonance imaging 2001;19(7):993-1000.
5. Jin T, Wang P, Zong X, Kim SG. MR imaging of the amide-proton transfer effect and the pH-insensitive nuclear overhauser effect at 9.4 T. Magnetic resonance in medicine 2013;69(3):760-770.
Figures