5011
Accelerating CEST MRI by Exploiting Sparsity in the Z-Spectrum Domain1Institute for Biomedical Engineering, ETH & University of Zurich, Zurich, Switzerland
Synopsis
Chemical Exchange Saturation Transfer (CEST) is an emerging modality offering an enhanced sensitivity for the detection of dilute metabolites with exchangeable protons. To provide quantitative analysis, an acquisition of multiple images per Z-spectrum is required, leading to long acquisition times in practice. In this report we present a novel approach for rapid acquisition of CEST MRI that exploits sparsity in the Z-spectrum domain. Based on ex-vivo and in-vivo data, an acceleration factor of up to R=5 is shown, without significant loss in data accuracy.
Introduction
CEST MRI measures the loss of water polarization as a function of saturation frequency (so-called Z-spectrum)1. To differentiate between contrast arising from different effects (magnetization transfer/nuclear Overhauser effect, T2 leakage), a broad range of saturation frequencies has to be covered, leading to acquisition times of up to few tens of minutes. Compressed sensing in combination with parallel imaging2,3, algebraic modelling4 or fingerprinting5 have been proposed to accelerate CEST acquisitions. Beyond these methods, further acceleration may be obtained by exploring the sparsity of the Z- domain (domain of saturation frequency offsets), a concept similar to sparsity in time or pseudo-time domains used for accelerating cardiac MRI (e.g.6) or intravoxel incoherent motion encoded MRI7. Accordingly, the objective of the present work was to exploit sparsity in the Z-spectrum domain for accelerating CEST MRI.Methods
All MR data were recorded with a 9.4 T small animal MRI scanner (Bruker BioSpec, Ettlingen, Germany), equipped with a quadrature 80 mm T/R volume resonator (phantom data) and a cryogenically cooled 2x2 phase array (in-vivo mouse brain data). The CEST acquisition was based on the Rapid Acquisition with Refocused Echoes (RARE) sequence. The saturation module consisted of a train of 10-lobe-sinc pulses interleaved with 2 ms spoiler gradients. The following acquisition parameters were used: field of view 25x25 mm2, matrix size: 96x96, RARE factor: 20, partial Fourier: 83%, echo/repetition time: 4/10000ms.
B0 mapping: WASSR CEST8 was used to obtained B0 maps with the same sequence as used for the CEST measurements. Acquisition parameters were: 40 frequency offsets between +/- 2 ppm, saturation pulse duration: 500 ms, number of saturation pulses: 2, B1 = 0.2 μT.
Phantom data: An Eppendorf 1.5 ml vial was filled with a solution of 100 mM Creatine+200 mM Nicotinamide in a saline adjusted to pH = 7 (Sigma Aldrich, Buchs, Switzerland). CEST acquisition parameters were: 120 frequency offsets between +/- 6 ppm, saturation pulse duration: 500 ms, number of saturation pulses: 10, B1 =1.5 μT.
In vivo brain data: All animal experiments were performed with adherence to the Swiss Federal Act on Animal Protection and were approved by the Cantonal Veterinary Office Zurich. A female C57/BL6 mice were used. CEST acquisition parameters were: 40 frequency offsets between +/- 4 ppm, saturation pulse duration: 250 ms, number of saturation pulses: 20, B1 = 2 μT, total scan time: 26 min.
Data reconstruction: The fully sampled data were reconstructed in ParaVision 6.0.1 (Bruker). Retrospective undersampling (acceleration factor R=2,3,5) was performed using either Poisson-like random undersampling (kZ-SPARSE) with the Fourier transform along the Z dimension or using sheared-grid undersampling with subsequent principal component analysis along Z (kZ-PCA)6. Reconstruction using kZ-SPARSE without the Fourier transform along Z was used to study the effect of sparsity in the Z-domain and corresponds to standard Compressed Sensing reconstruction.
Results
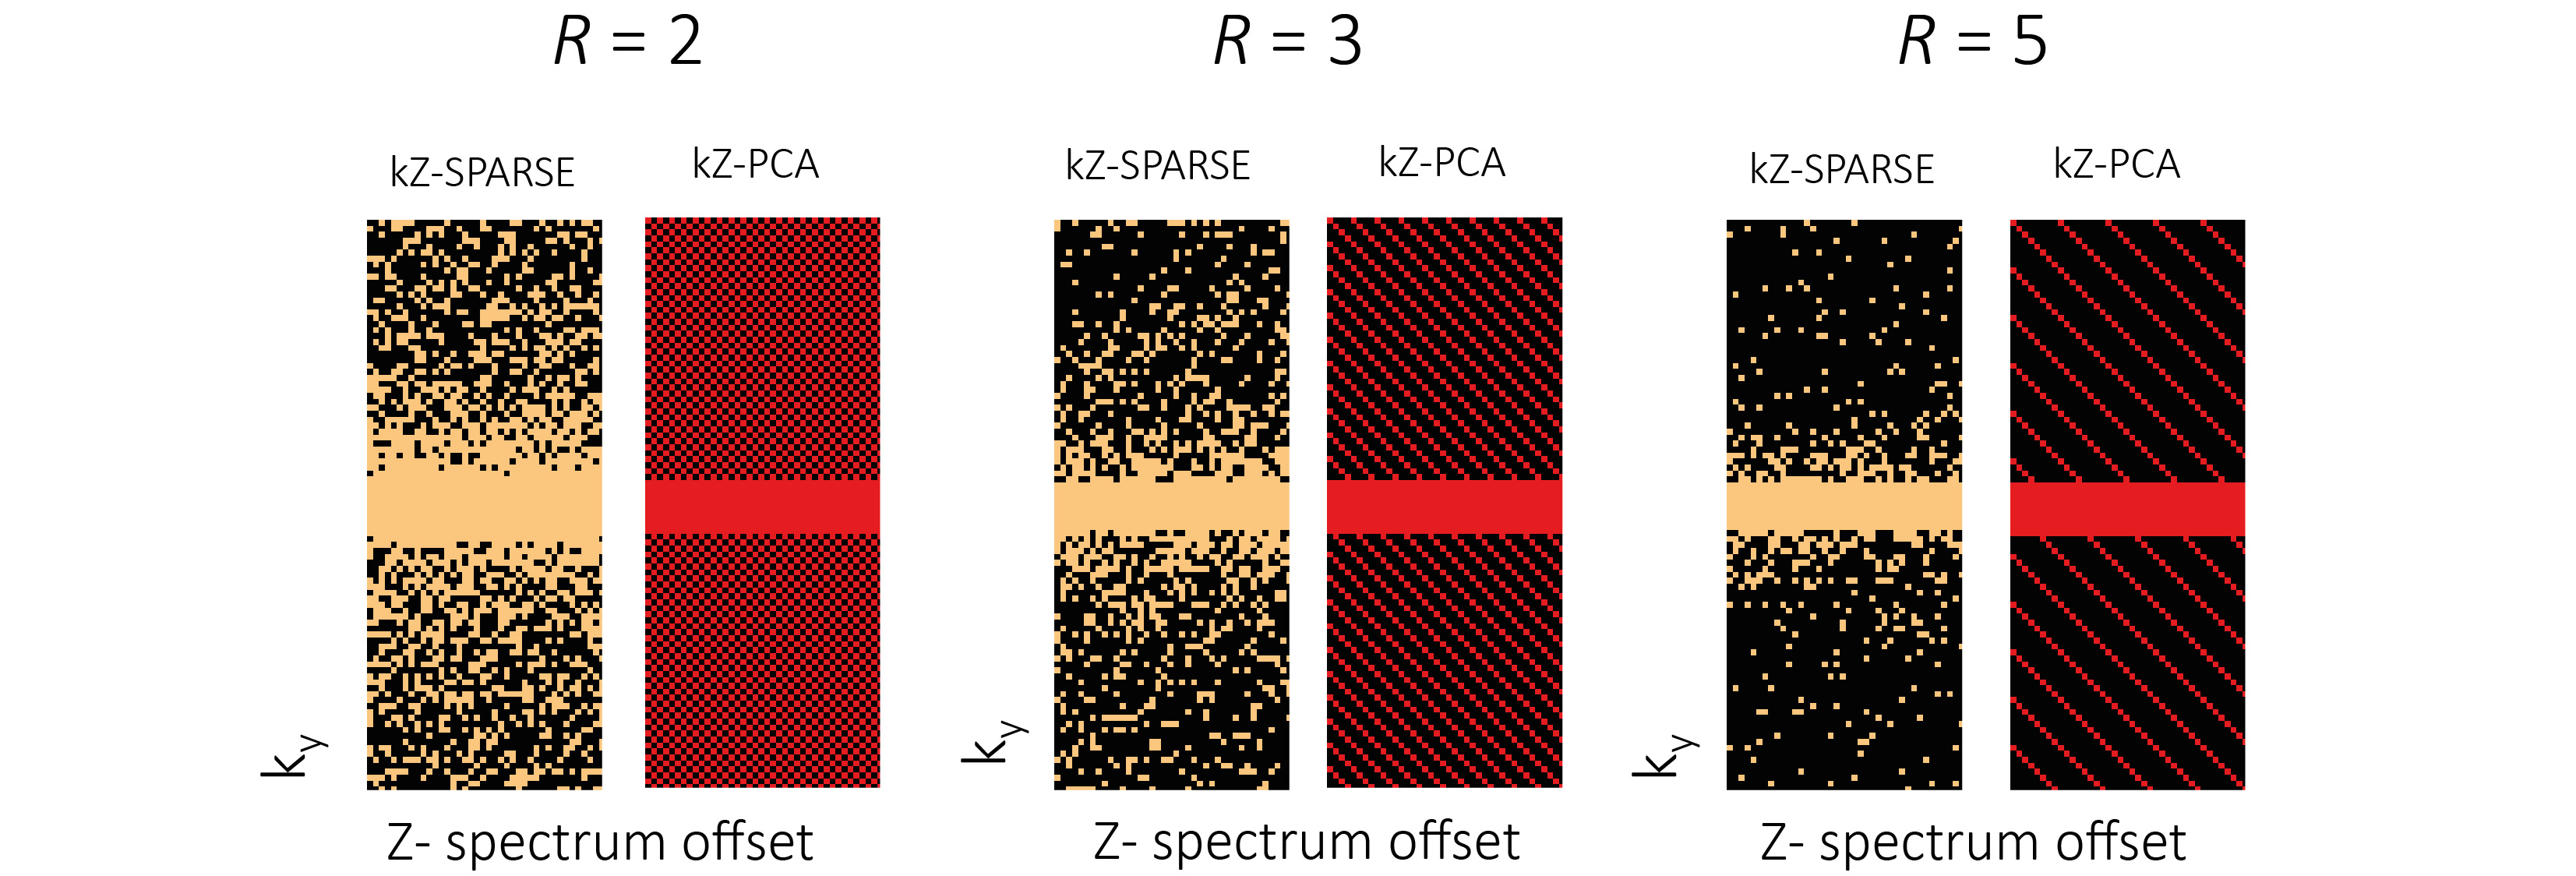
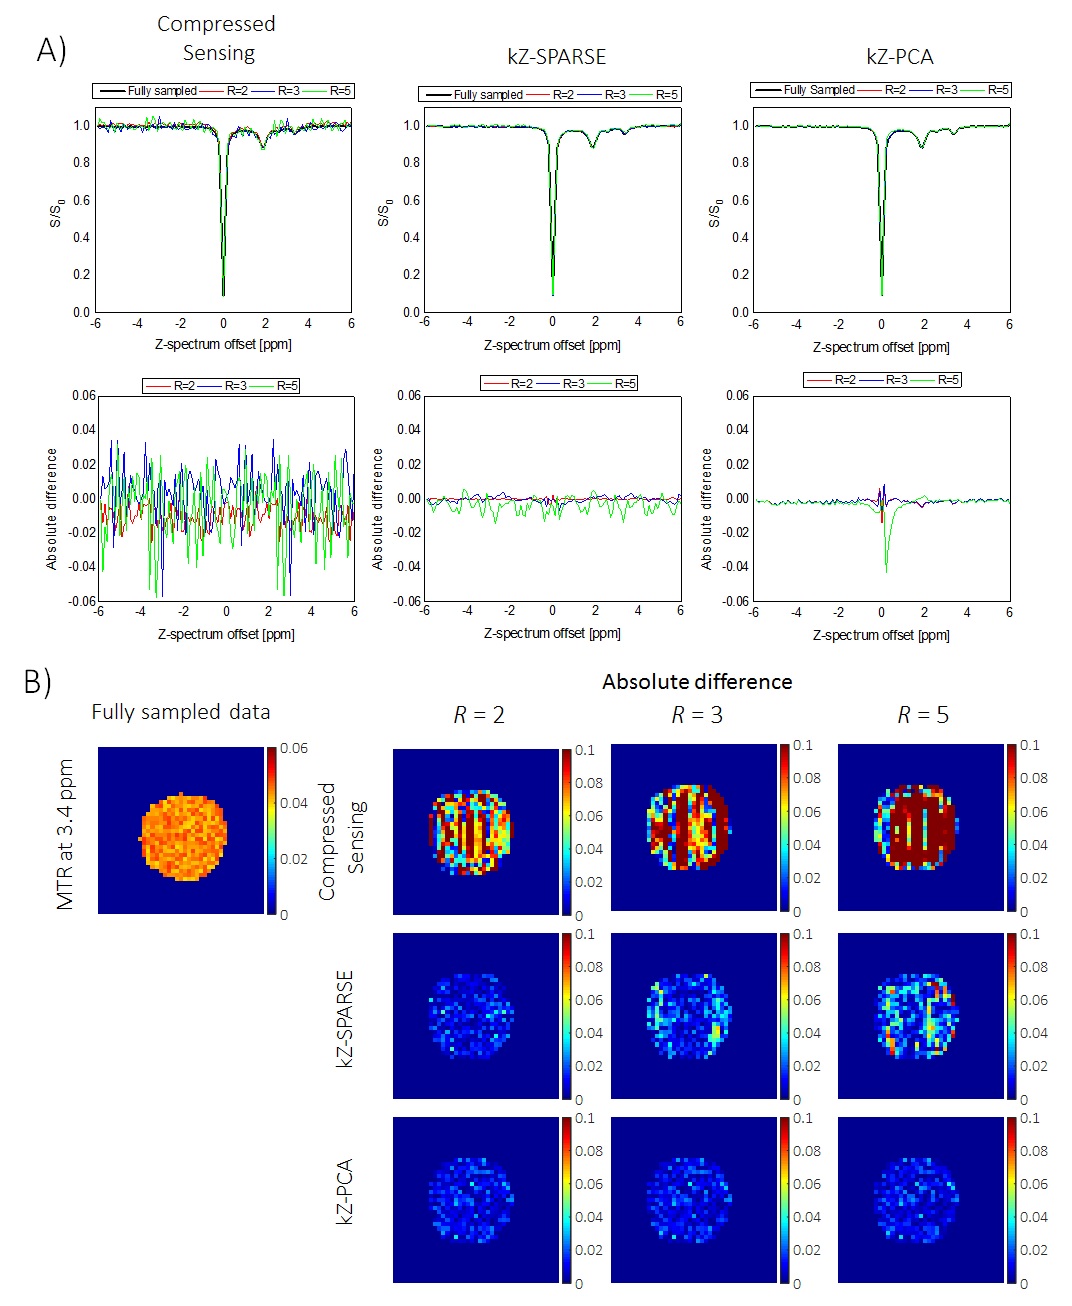
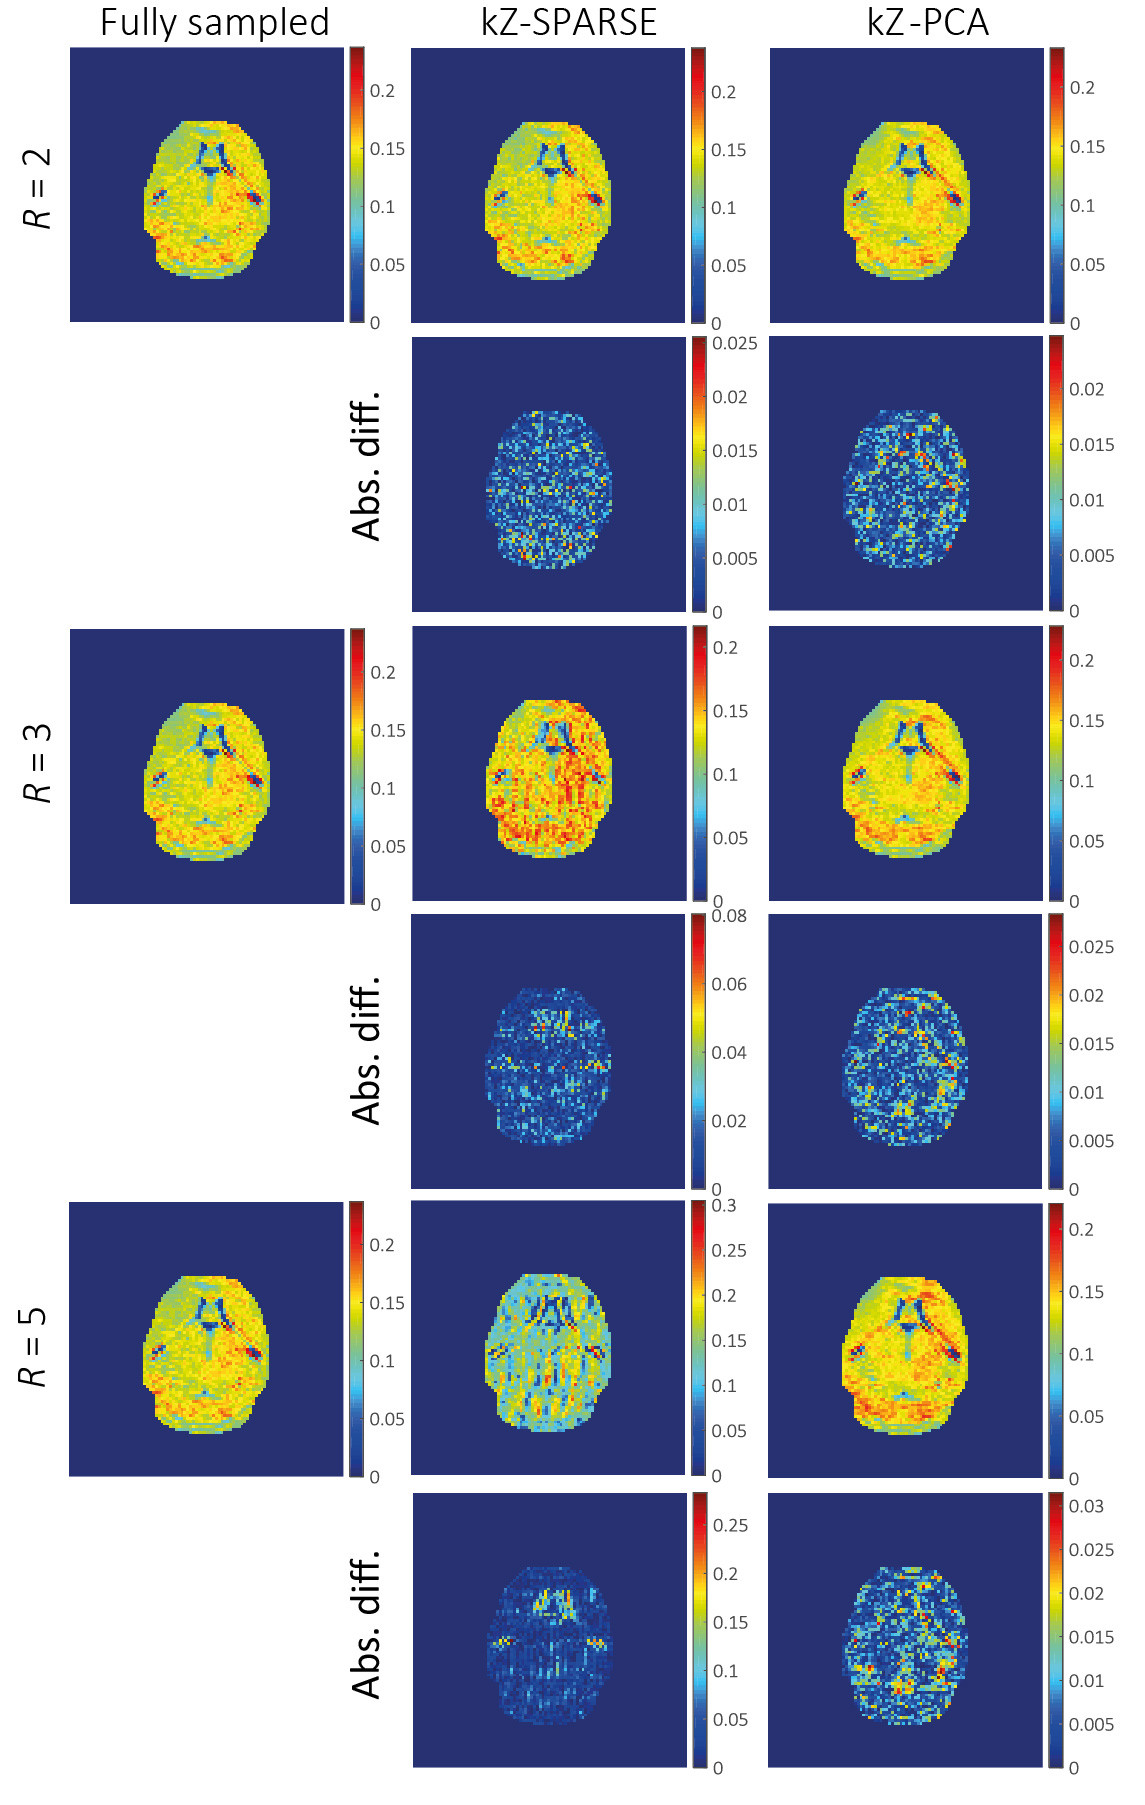
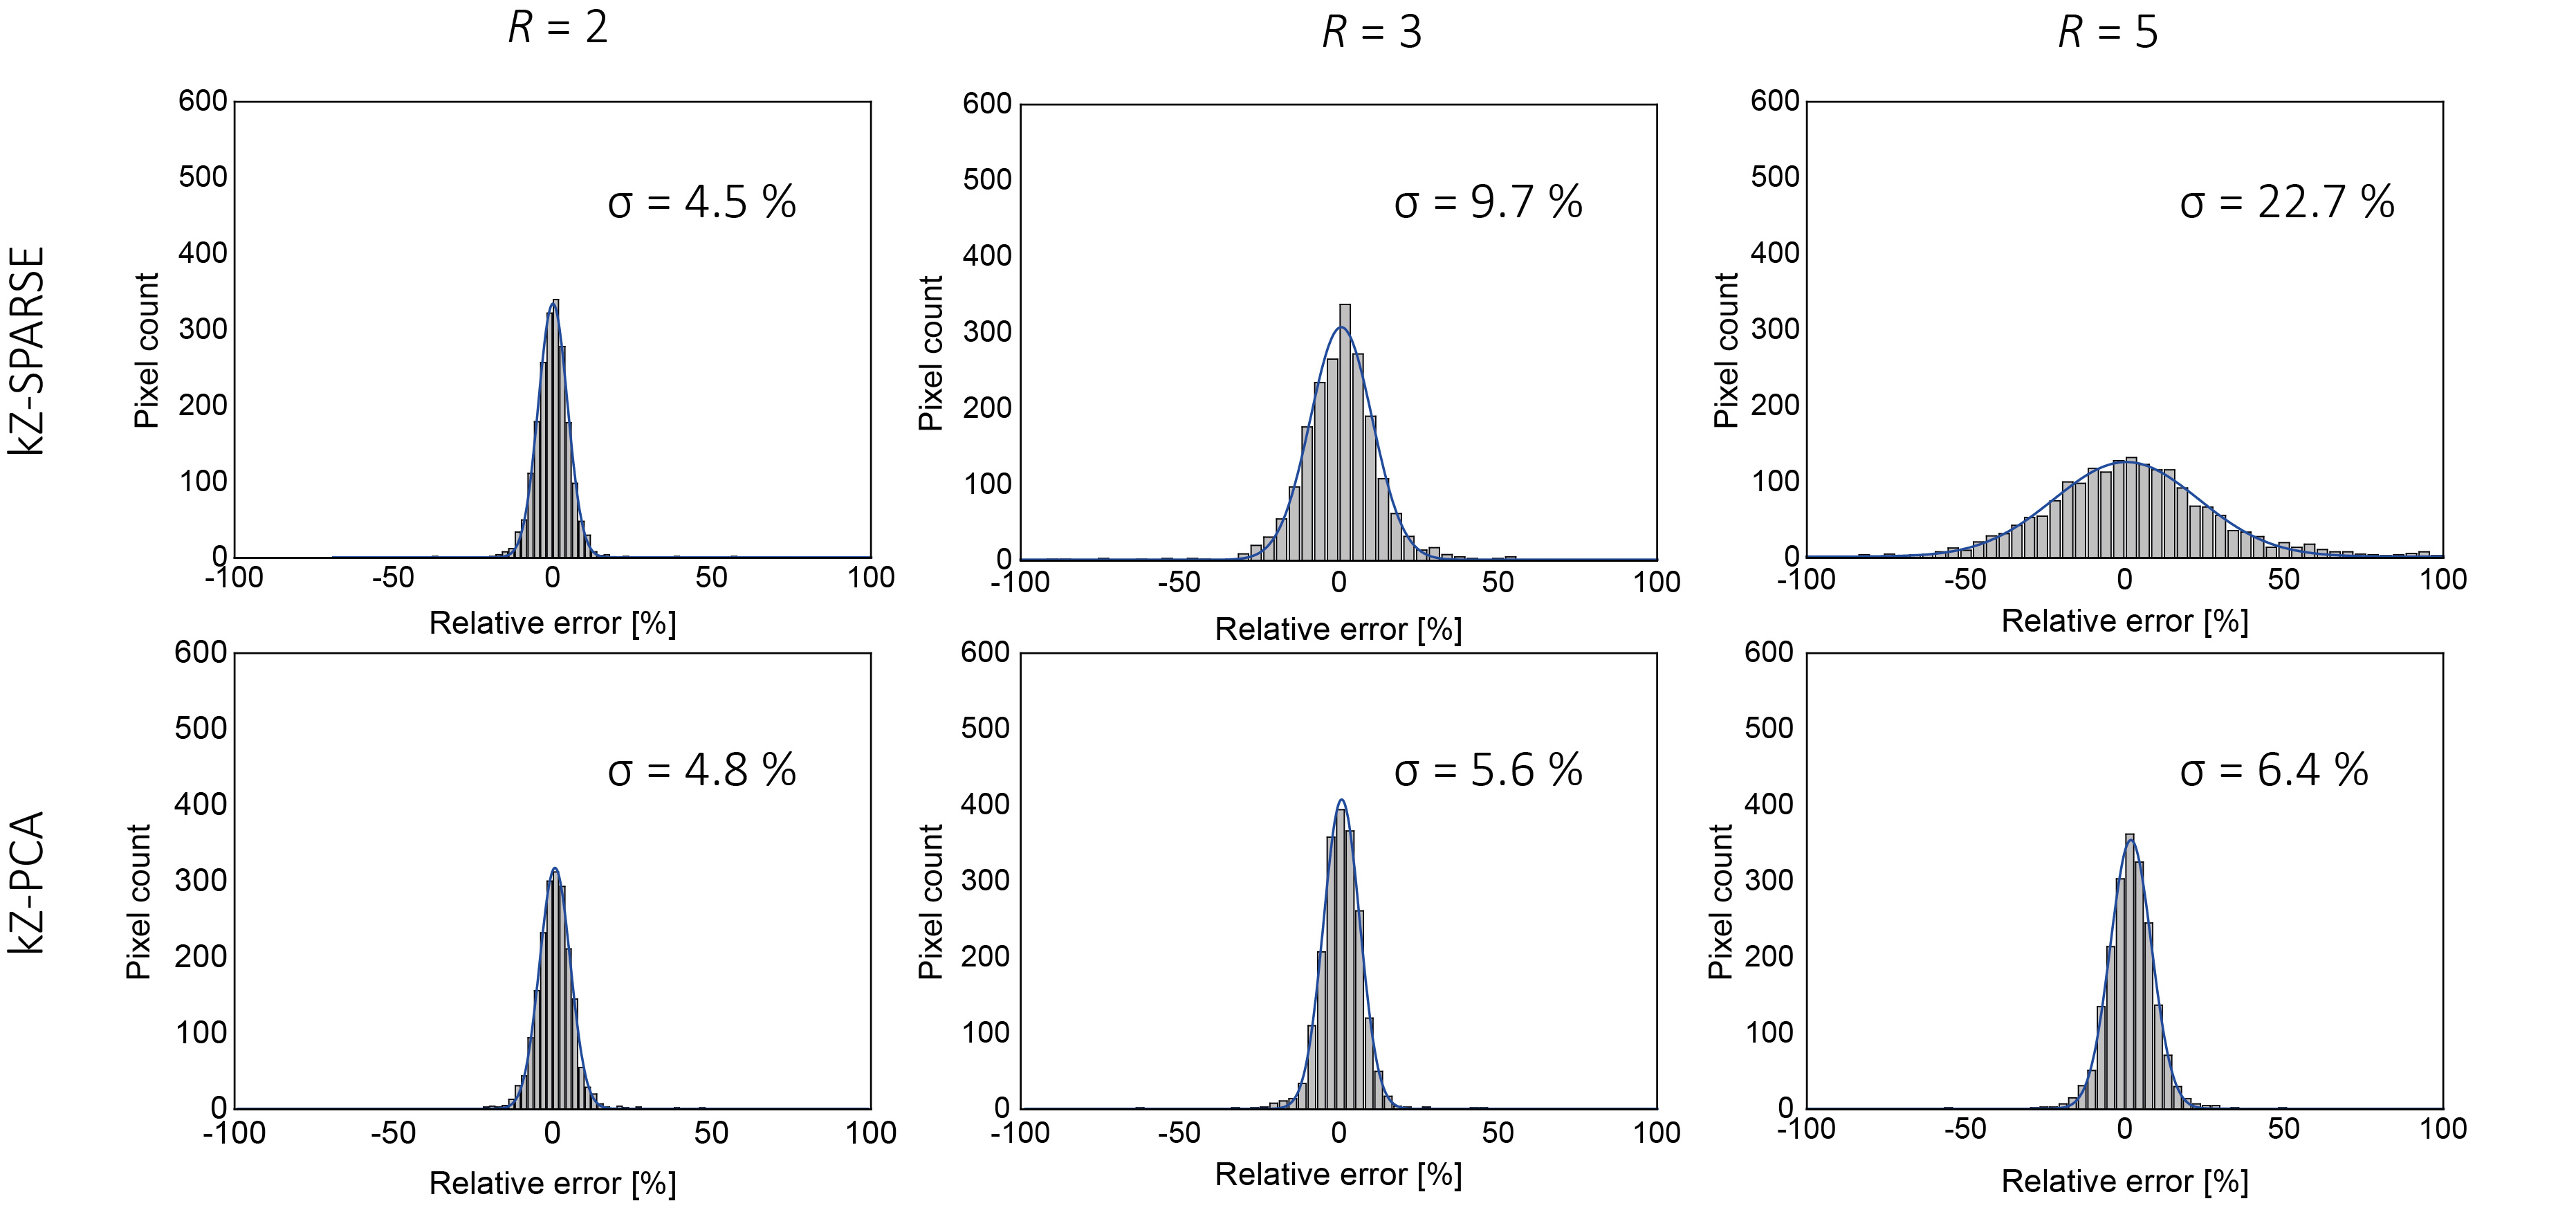
The corresponding undersampling patterns for retrospective analysis are shown in Fig.1,Fig.2A shows the phantom analysis using a complete Z-spectrum, taken as an average over pixels in the whole phantom. Significant improvement is seen for reconstruction employing Z-domain sparsity (kZ-SPARSE and kZ-PCA) compared to Compressed Sensing. Pixel-wise quantification of absolute differences in amide MTR at 3.4 ppm was used to investigate subtle changes in in-vivo (Fig.2B). Significant artefacts are seen with Compressed Sensing, already for R=2. Substantial improvement in MTR accuracy was found using kZ-SPRASE and kZ-PCA, with the latter providing enhanced accuracy at R=3 and 5. In line with these findings, in-vivo data (Fig.3) present similar quality for kZ-SPARSE and kZ-PCA for R=2. For R=3, kZ-SPARSE results in an overestimation in MTR which becomes unacceptably large for R=5. In contrast, reconstruction with kZ-PCA provides superior accuracy for all acceleration factors. These results are further confirmed by an analysis of the relative error distribution shown in Fig.4.Discussion
The present study has demonstrated potential benefits of accelerating CEST MRI by exploiting sparsity in the Z-domain. Both, kZ-SPARSE and kZ-PCA provided significant improvements in the accuracy of MTR quantification, compared to Compressed Sensing. Some mismatch in the linewidth of the water line was found for reconstruction with kZ-PCA at R=5 (Fig.2A) which is associated with spatiotemporal fidelity issues described previously9. This has, however, no effect on MTR quantification as shown in Fig.3 due to the broad linewidths of Z-spectra recorded in-vivo. kZ-SPARSE outperformed kZ-PCA for R=2, while kZ-PCA showed superior accuracy for R=3 and 5. In conclusion, undersampled CEST MRI with kZ-SPARSE and kZ-PCA allows for fast, robust and accurate acquisition of Z-spectra and hence holds potential to either improve temporal and/or spatial resolution or reduce overall scan times of of CEST MRI.
Acknowledgements
References
1. van Zijl PCM, Lam WW, Xu J, Knutsson L, Stanisz GJ. Magnetization Transfer Contrast and Chemical Exchange Saturation Transfer MRI. Features and analysis of the field-dependent saturation spectrum. Neuroimage. 2018;168;222-241.
2. Zhang Y, Heo HY, Lee DH, et al. Chemical exchange saturation transfer (CEST) imaging with fast variably-accelerated sensitivity encoding (vSENSE). Magn Reson Med. 2017;77(6):2225-2238.
3. Heo HY, Zhang Y, Lee DH, Jiang S, Zhao X, Zhou J. Accelerating chemical exchange saturation transfer (CEST) MRI by combining compressed sensing and sensitivity encoding techniques. Magn Reson Med. 2017;77(2):779-786.
4. Zhang Y, Heo HY, Jiang S, Lee DH, Bottomley PA, Zhou J. Highly accelerated chemical exchange saturation transfer (CEST) measurements with linear algebraic modeling. Magn Reson Med. 2016;76(1):136-144.
5. Cohen O, Huang S, Mcmahon MT, Rosen MS, Farrar CT. Rapid and quantitative chemical exchange saturation transfer (CEST) imaging with magnetic resonance fingerprinting (MRF). Magn Reson Med. 2018:1-15.
6. Wespi P, Steinhauser J, Kwiatkowski G, Kozerke S. High-resolution hyperpolarized metabolic imaging of the rat heart using k–t PCA and k–t SPARSE. NMR Biomed. 2018;31:3876.
7. Spinner GR, Schmidt JFM, von Deuster C, Federau C, Stoeck CT, Kozerke S. Enhancing intravoxel incoherent motion parameter mapping in the brain using k-b PCA. NMR Biomed. 2018:1-11
8. Kim M, Gillen J, Landman BA, Zhou J, Van Zijl PCM. Water saturation shift referencing (WASSR) for chemical exchange saturation transfer (CEST) experiments. Magn Reson Med. 2009;61(6):1441-1450.
9. Vitanis V, Manka R, Giese D, et al. High resolution three-dimensional cardiac perfusion imaging using compartment-based k-t principal component analysis. Magn Reson Med. 2011;65(2):575-587
Figures