5010
Investigating Gadolinium Depositions in Glycosaminoglycans using CEST MRI - Why T1 Corrections are Important1Leibniz-Institut für Molekulare Pharmakologie (FMP), Berlin, Germany, 2Department of Radiology, Charité - Universitätsmedizin Berlin, Berlin, Germany
Synopsis
In this study, we investigated the CEST effect of model solutions composed of gadolinium-based contrast agents (GdCA), heparin as model substance for glycosaminoglycans (GAGs) and ZnCl2 with the aim to provide direct evidence of Gd3+-GAG complex formations. We performed time resolved CEST and T1 relaxation time measurements and quantified the CEST effects using different CEST metrics, including MTRasym and AREX. Our results demonstrate the necessity of T1 correction in CEST MRI in such a case where T1 conditions are affected, too.
Introduction
The stability of gadolinium-based contrast agents (GdCA) has been subject to investigation in several experimental and clinical studies. It was shown that Gd3+ ions could be released from the chelator in the presence of certain endogenously occurring ions such as Zn2+. The subsequent retention of released Gd3+ ions in the human brain - especially in the dentate nucleus and globus pallidus - could be observed as hyperintensities on T1-weighted images1,2. Further, the complexation of released Gd3+ ions in competing chelators like glycosaminoglycans (GAGs) was hypothesized and shown indirectly by means of T1 measurements3. The aim of this study was to investigate the formation of macromolecular Gd-GAG complexes directly by means of Chemical Exchange Saturation Transfer (CEST) MRI measurements and various evaluation metrics.Methods
As model substance for GAGs we used heparin (Heparin-Natrium-250000-ratiopharm, ratiopharm GmbH, Ulm,
Germany) and as representative linear GdCA we used Magnevist® (Bayer AG, Leverkusen, Germany). The final model solution consisted
of 22500 IU/ml heparin, 0.15 mM GdCA and 0.96 mM ZnCl2.
All MR measurements were performed at room temperature (~297 K)
on a 9.4 T NMR spectrometer (Bruker Biospin, Ettlingen, Germany) equipped with
gradient coils for imaging. For CEST preparation, a continuous wave saturation
pulse of amplitude B1 = 0.8 µT and 10 s duration was applied. Each CEST
series consisted of 301 equally distributed offsets between ±4 ppm. T1 relaxation time measurements were performed using a saturation/dephasing recovery preparation consisting of 50 π/2 excitation pulses with subsequent gradient spoiling. For CEST and T1 measurements, a centric-reordered GRE read-out (matrix: 64x64, FoV: 12.8x12.8 mm², slice thickness: 20 mm, TE/TR: 1.86/4.31 ms) was used. All post-processing was performed using self-developed Python software (Python v3.6, Python Software Foundation, https://www.python.org/).
Results
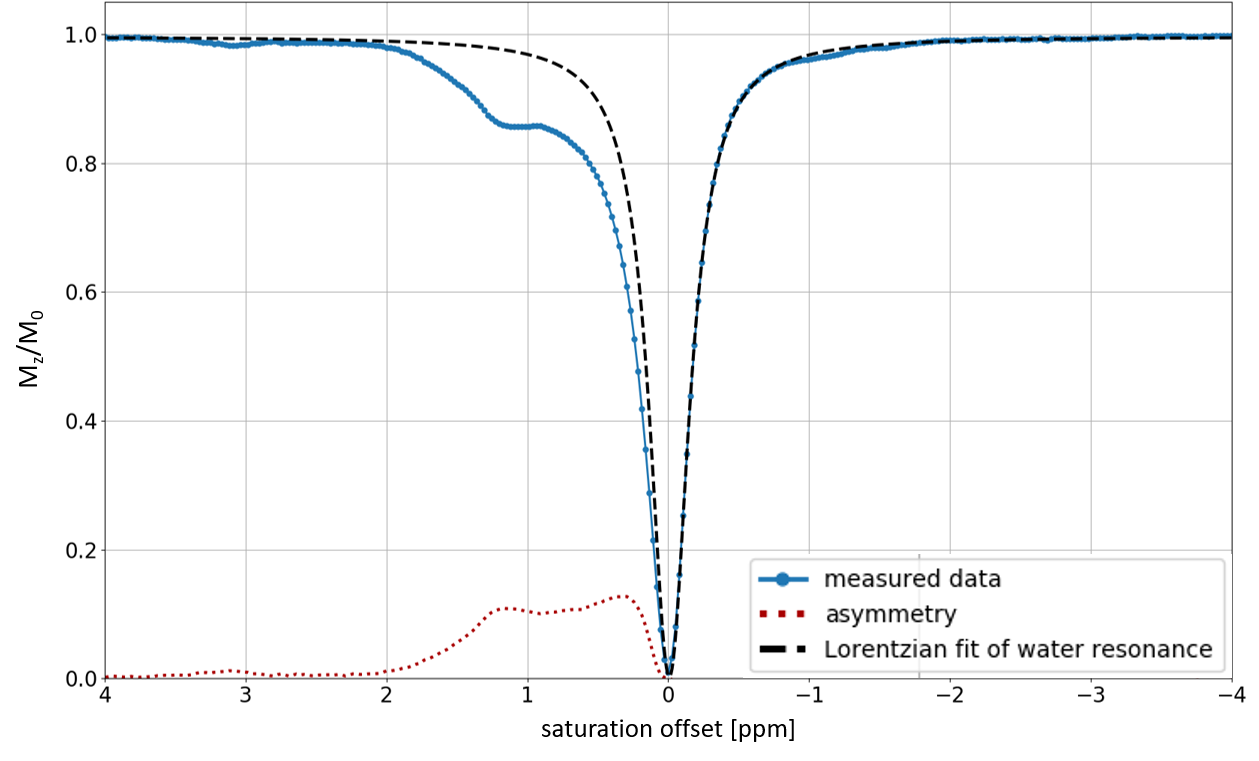
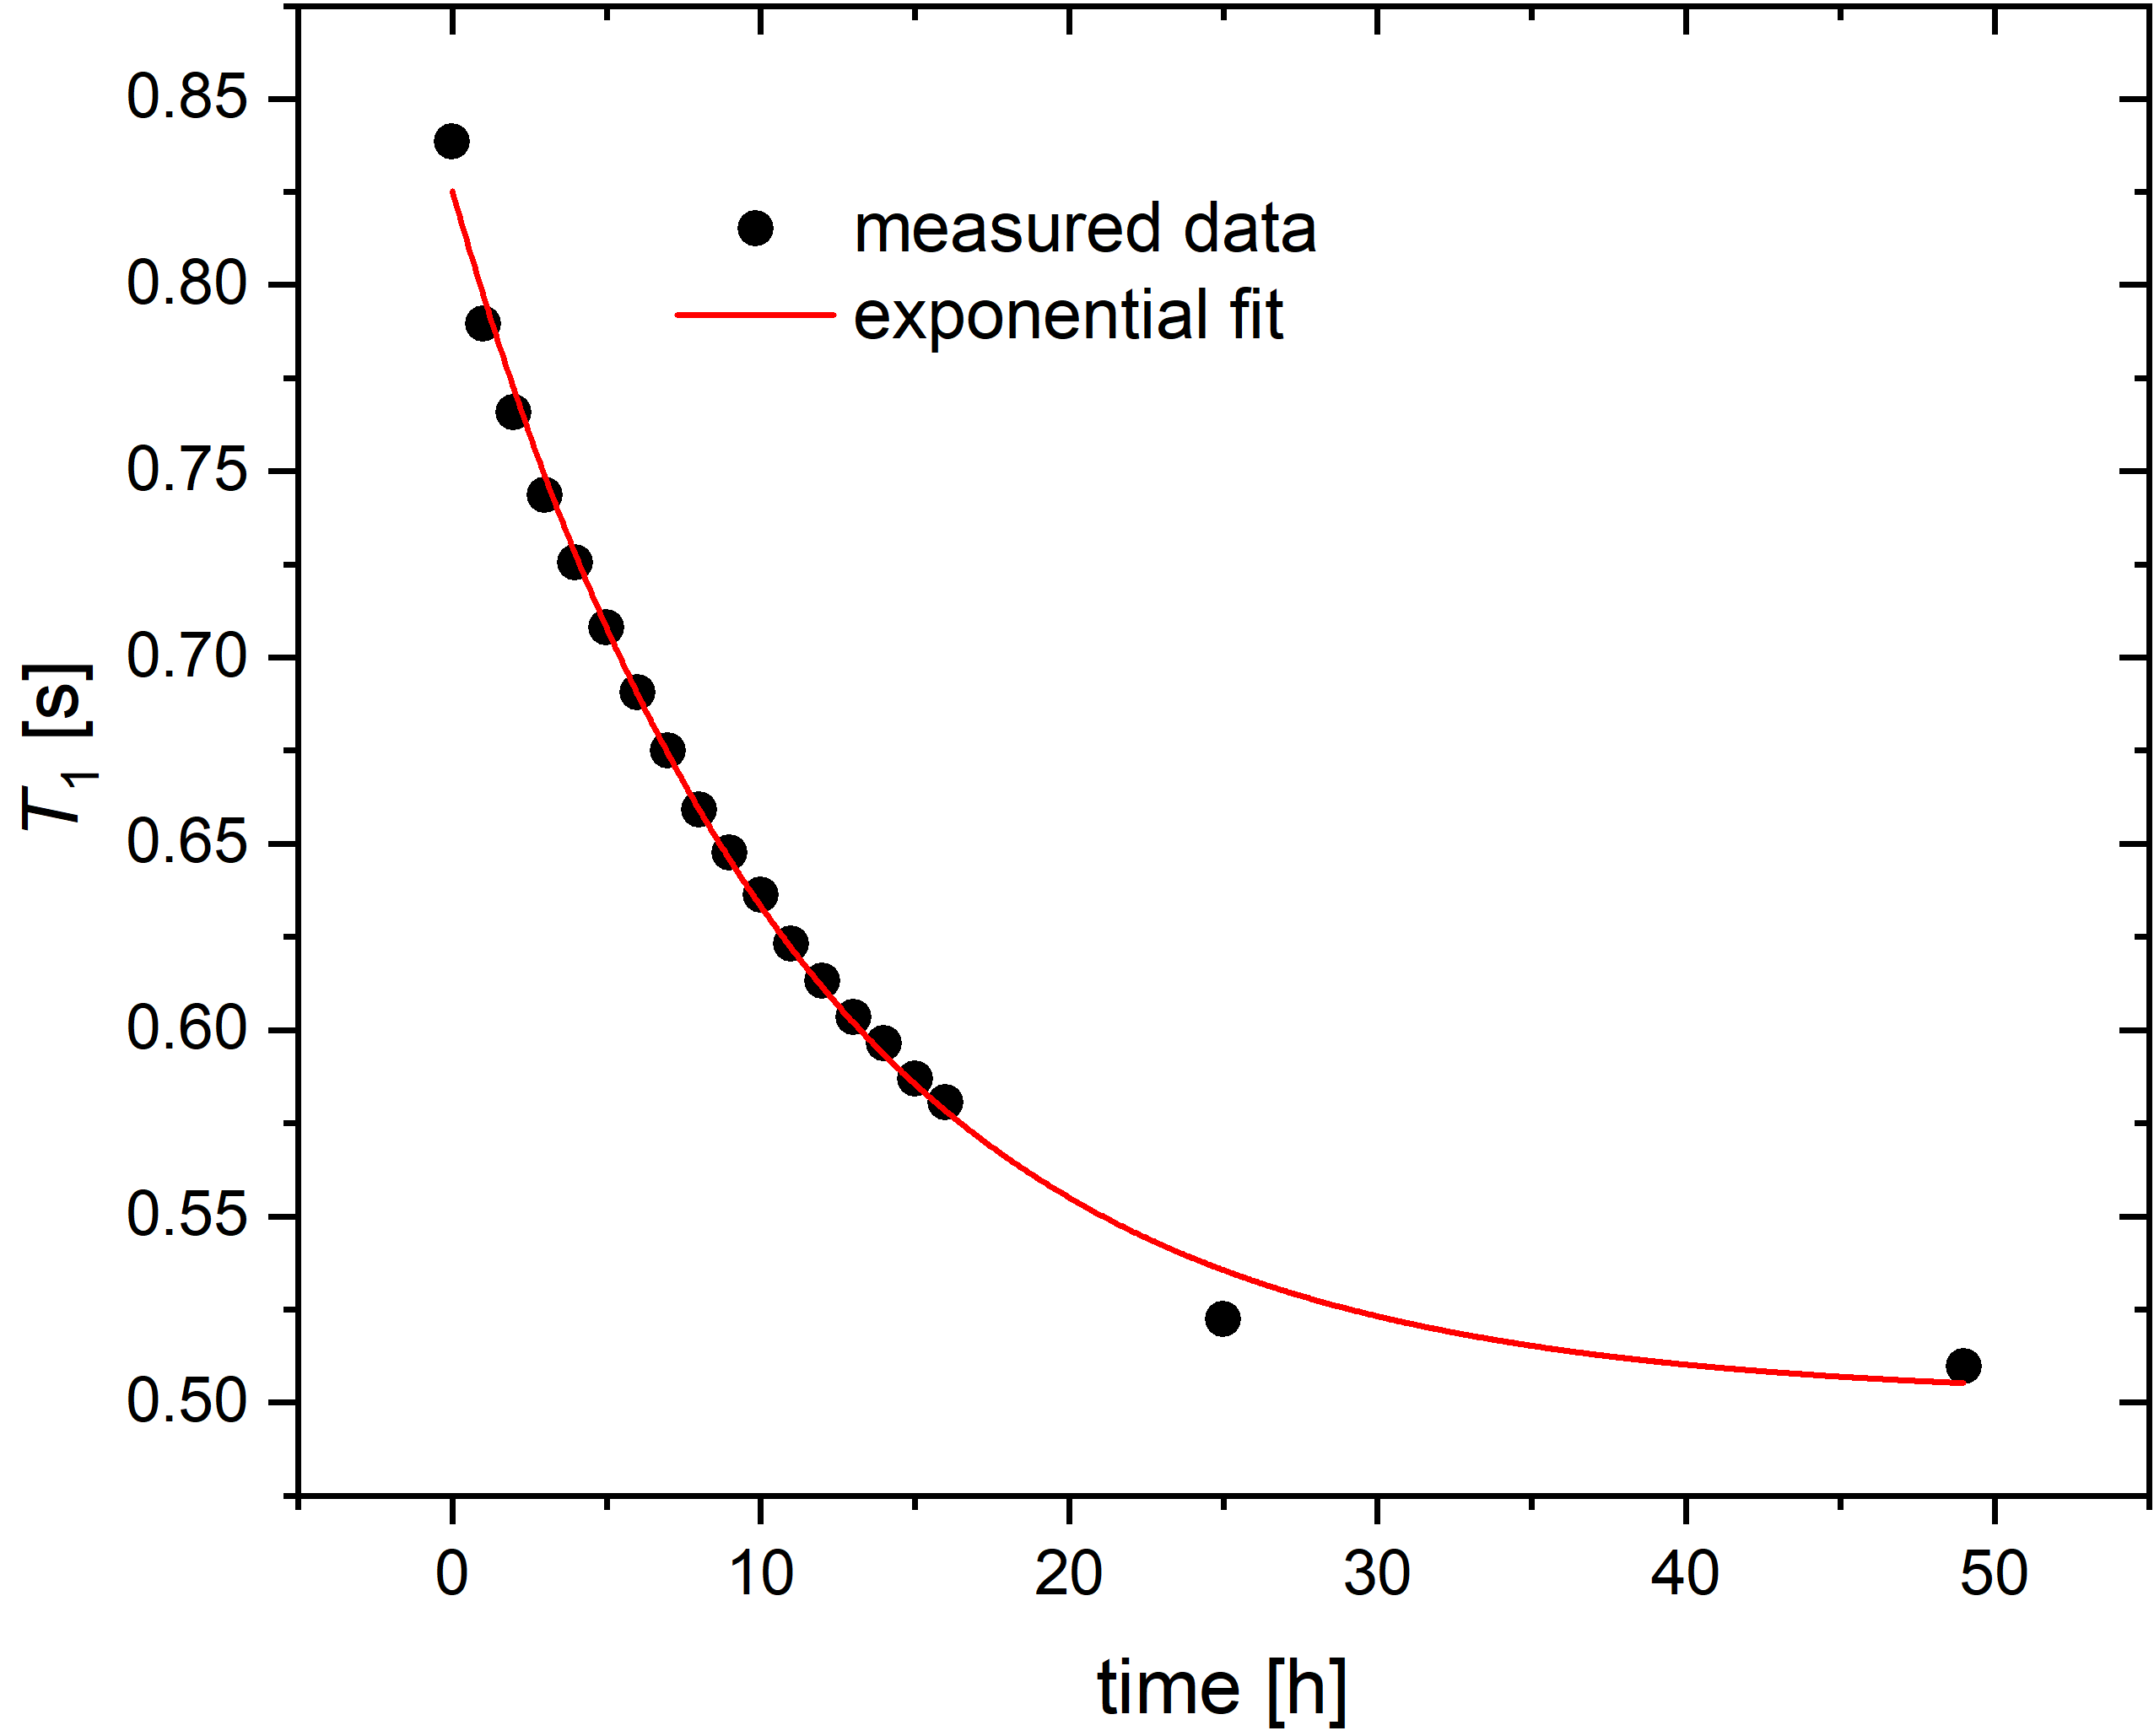
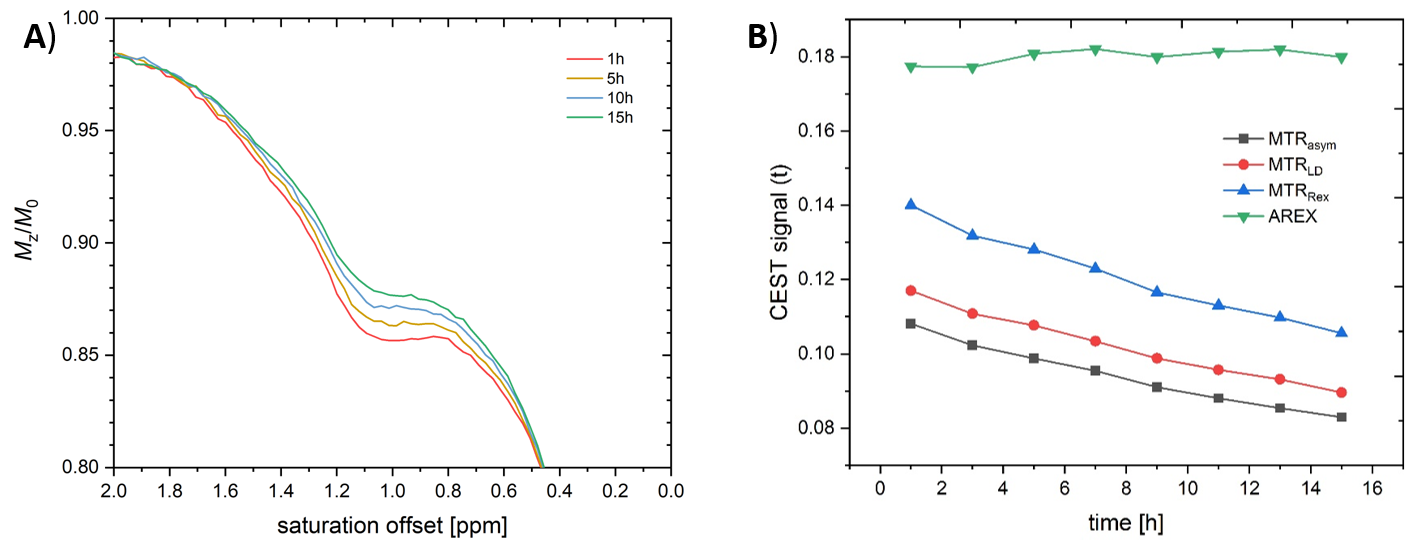
Figure 1 shows the measured Z-spectrum (solid blue line) of GdCA+heparin in solution, the asymmetric magnetization transfer ratio (MTRasym, dotted red line) and a representative Lorentzian fit of the water resonance (dashed black line). For the quantification of CEST effects, the dominant hydroxyl resonance at 1.1 ppm was used4. After adding 0.96 mM ZnCl2, the T1 relaxation time of the GdCA-heparin solution changed from T1 = 840 ms to T1 = 510 ms in an exponential process with a time constant of 11.1 ± 0.5 hours (Fig. 2). This slow process did not occur in the absence of heparin, but T1 dropped to another value instantaneously. The Z-spectra at time points t = 1h, 5h, 10h and 15h shown in Fig. 3a reveal a clear decrease of Z-values around 1.1 ppm over time. This change of the CEST effect was quantified using MTRasym, the linear difference between the measured data and the fit of the water resonance (MTRLD), the inverse metric (MTRRex)5 and the apparent exchange-dependent relaxation (AREX)5. All metrics except AREX show a decrease of the CEST effect over time (Fig. 3b).
Discussion
The observed continuous
reduction of the CEST
effects quantified using MTRasym, MTRLD and MTRRex would be in agreement with the hypothesized Gd-GAG complex formation, which could lead to a quench of the CEST effect due to the paramagnetic effect of the deposited Gd-ions on neighboring exchanging protons. However, after compensating for the varying T1 relaxation times at the different time points (cf. Fig. 2) by means of AREX, the observed CEST effect remains constant over time (Fig. 3b). Thus, assuming AREX is the most accurate metric, we could not provide a CEST-based verification of Gd-GAG complex formations. However, from the results we cannot conclude that the expected Gd-GAG complexation does not happen, but only that it is not detectable by the CEST measurements used in this study. T1 relaxometry still supports the previous reports of transchelation with heparin.
Conclusion
We could not provide a CEST-based verification of Gd-GAG complex formation, but our results emphasize the problem of the complex composition of CEST effects and demonstrate the necessity of choosing an appropriate metric. Especially in experiments with varying relaxation times - for example after the application of contrast agents - a T1 correction of CEST effects is mandatory.Acknowledgements
This research was supported by the German Research Foundation (DFG) within the Research Training Group
"BIOphysical Quantitative Imaging Towards Clinical Diagnosis" (BIOQIC; GRK2260), the special research area "In vivo Visualization of Extracellular Matrix Pathology" (SFB1340) and the Koselleck grant SCHR 995/5-1.
References
1. Kanda T, Ishii K, Kawaguchi H, Kitajima K, Takenaka D. High signal intensity in the dentate nucleus and globus pallidus on unenhanced T1-weighted MR images: relationship with increasing cumulative dose of a gadolinium-based contrast material. Radiology 2014;270:834–41.
2. Radbruch A, Weberling LD, Kieslich PJ, et al. Gadolinium retention in the dentate nucleus and globus pallidus is dependent on the class of contrast agent. Radiology 2015;275:783–91.
3. Taupitz M, Stolzenburg N, Ebert M, et al. Gadolinium-containing magnetic resonance contrast media: investigation on the possible transchelation of Gd3+ to the glycosaminoglycan heparin. Contrast Media Mol. Imaging 2013;8:108–16.
4. Ling W, Regatte RR, Navon G, Jerschow A. Assessment of glycosaminoglycan concentration in vivo by chemical exchange-dependent saturation transfer (gagCEST). Proc. Natl. Acad. Sci. U. S. A. 2008;105:2266–70.
5. Zaiss M, Xu J, Goerke S, et al. Inverse Z-spectrum analysis for spillover-, MT-, and T1 -corrected steady-state pulsed CEST-MRI--application to pH-weighted MRI of acute stroke. NMR Biomed. 2014;27:240–52.
Figures