5009
Acquisition protocol for glucoCESL MRI in the human brain at 7T with reduced motion-induced artifacts1Division of Medical Physics in Radiology, German Cancer Research Center (DKFZ), Heidelberg, Germany, 2High‐field Magnetic Resonance Center, Max Planck Institute for Biological Cybernetics, Tübingen, Germany, Tübingen, Germany, 3Department of Radiology, German Cancer Research Center (DKFZ), Heidelberg, Germany
Synopsis
In this study, an acquisition protocol for glucoCESL MRI examinations in the human brain is presented, that was optimized for suppression of motion-induced artifacts. This was achieved by using a combination of (i) a 3D imaging readout, which enabled co-registration of the acquired images over the course of time, and (ii) a ΔR1ρ contrast based on quantitative R1ρ maps instead of R1ρ-weighted images. The presented acquisition protocol improves the applicability of glucose-weighted MRI for examinations in humans where motion is present. Feasibility was verified by examination in a first patient with glioblastoma.
Introduction
Chemical exchange-sensitive MRI
after administration of glucose (glucoCEST/CESL) has been shown to provide insights
into glucose perfusion/uptake, which is of particular interest for the
identification of active tumor regions1. Also its applicability
for examinations in humans was already verified by two independent pilot
studies2,3. However, contrast maps are prone to motion-induced
artifacts, as the final glucoCEST/CESL contrast relies on the difference of
images which were acquired with a time gap of several tens of minutes. In this
study, identification of different types of motion-induced artifacts (spatial
displacement, spatially varying sensitivity of the coil, slab selection profile) led to the development
of a 3D acquisition protocol for glucoCESL examinations in the human brain at
7T with improved robustness against motion.
Methods
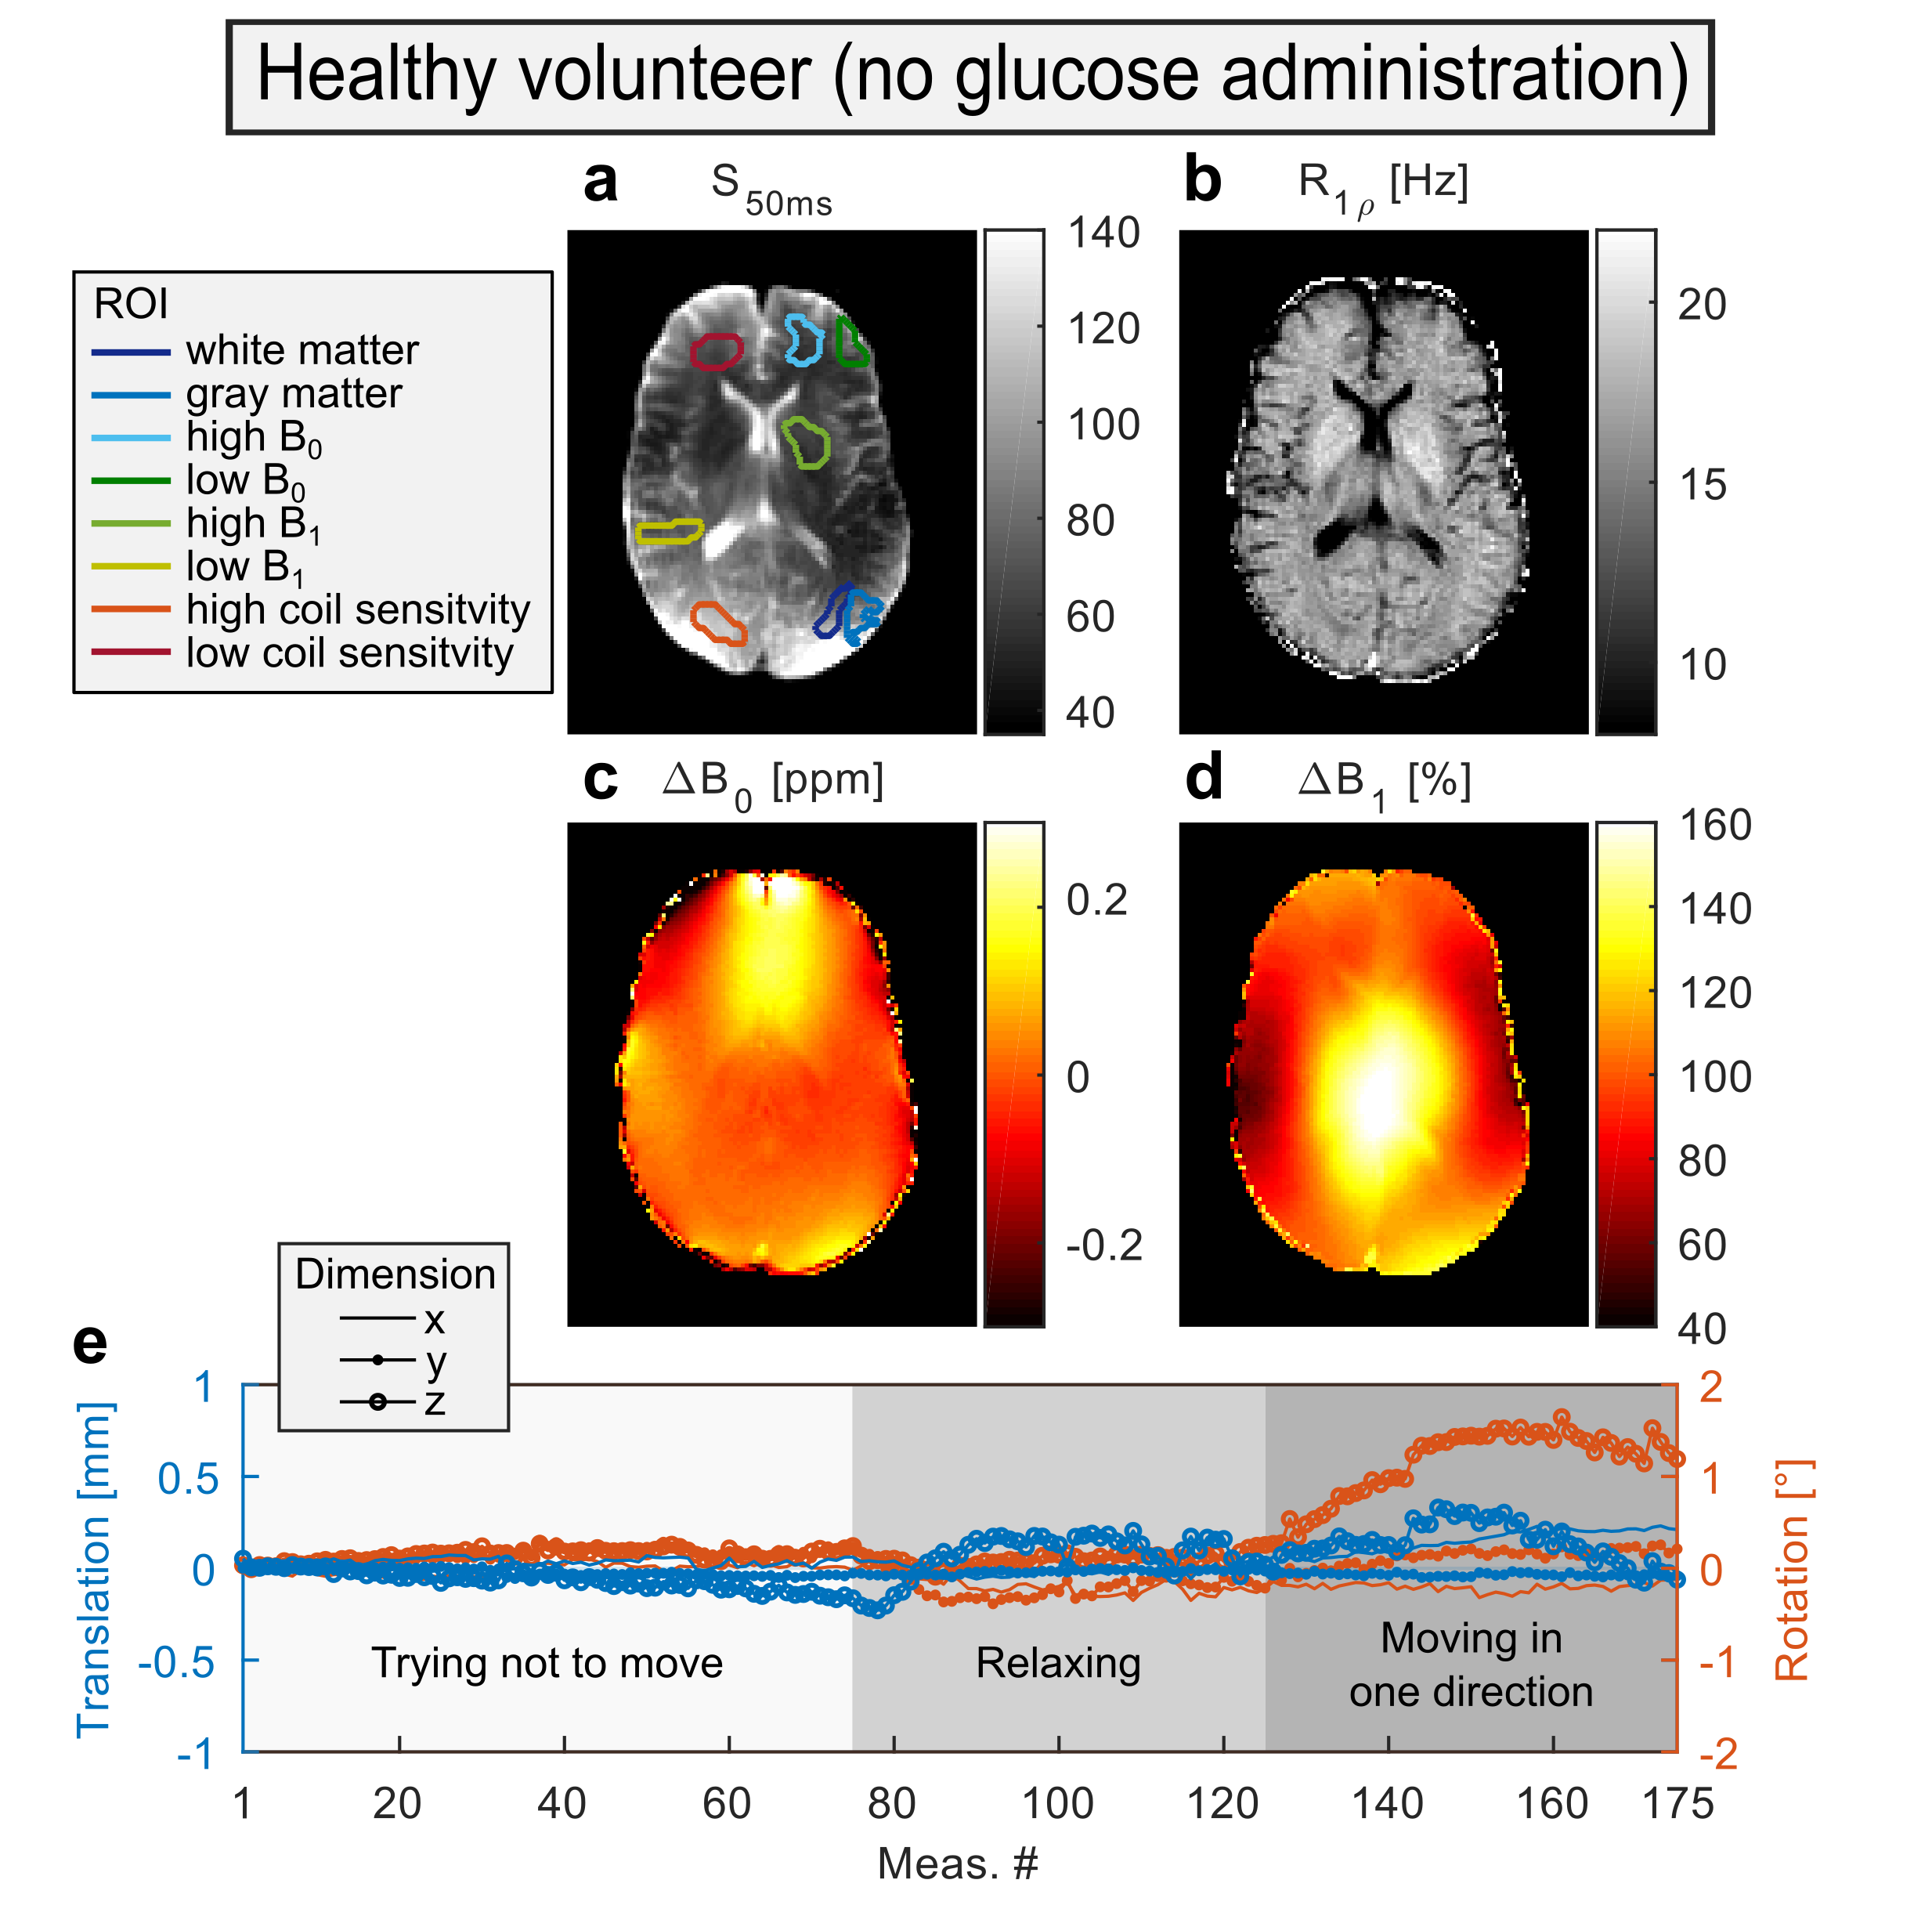
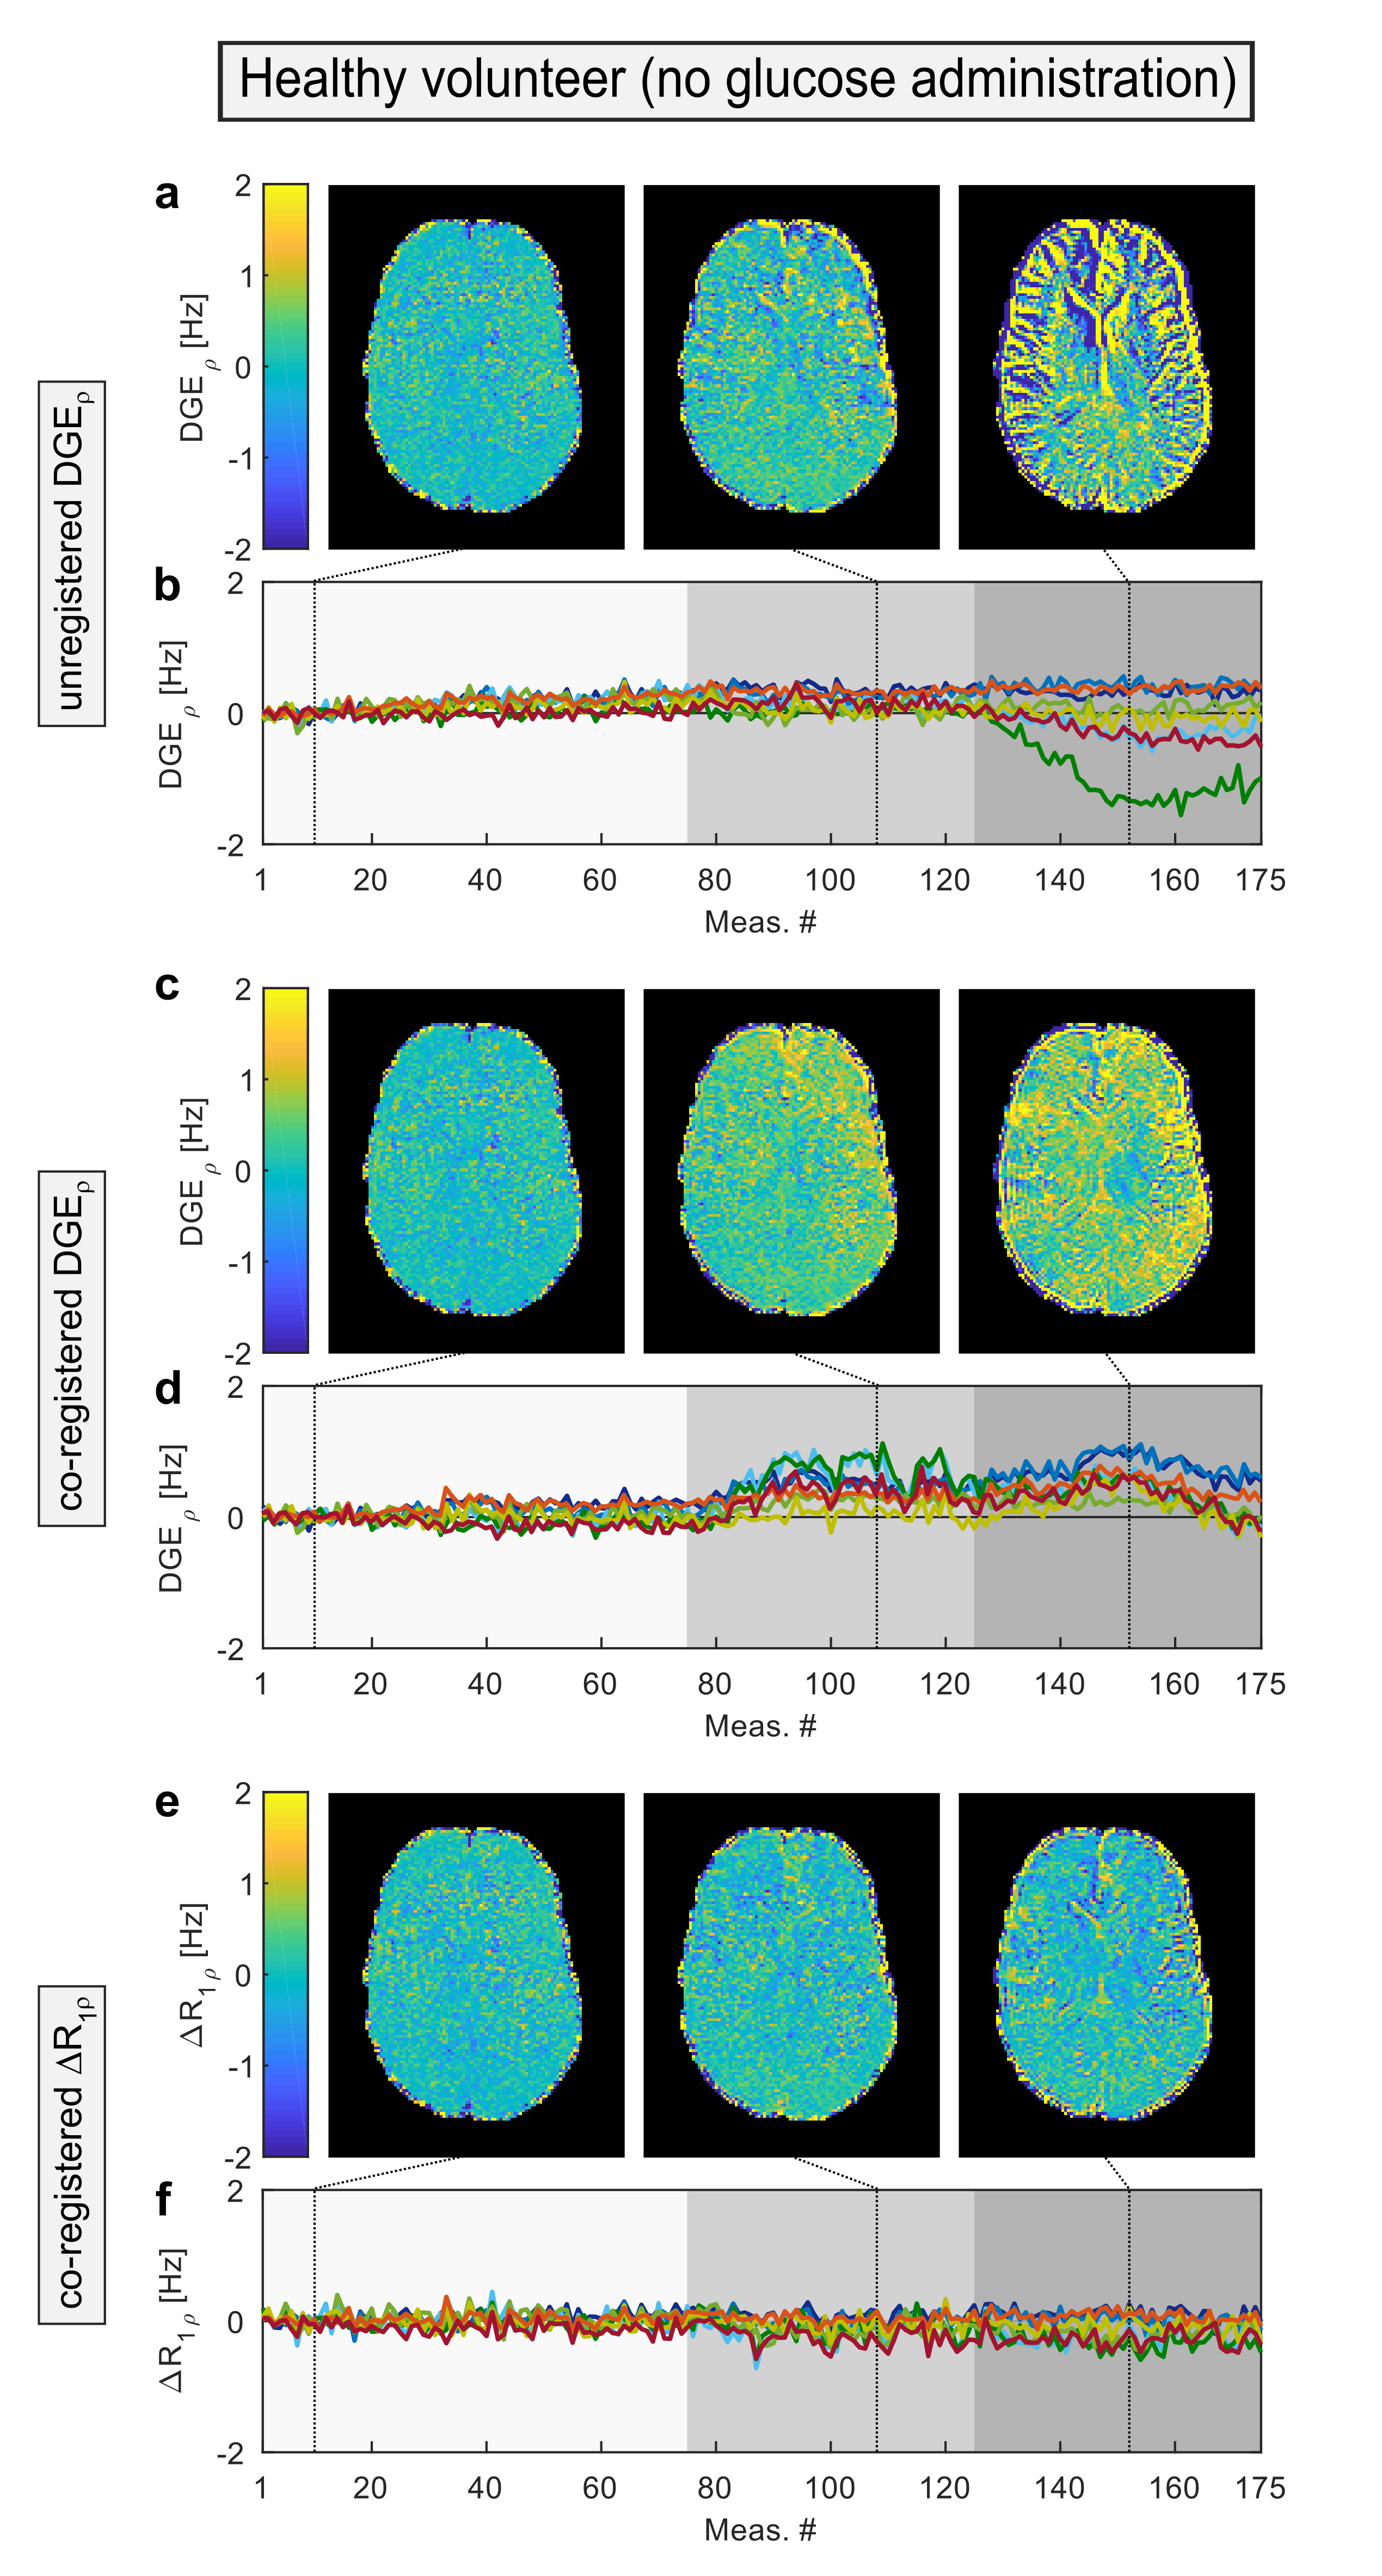
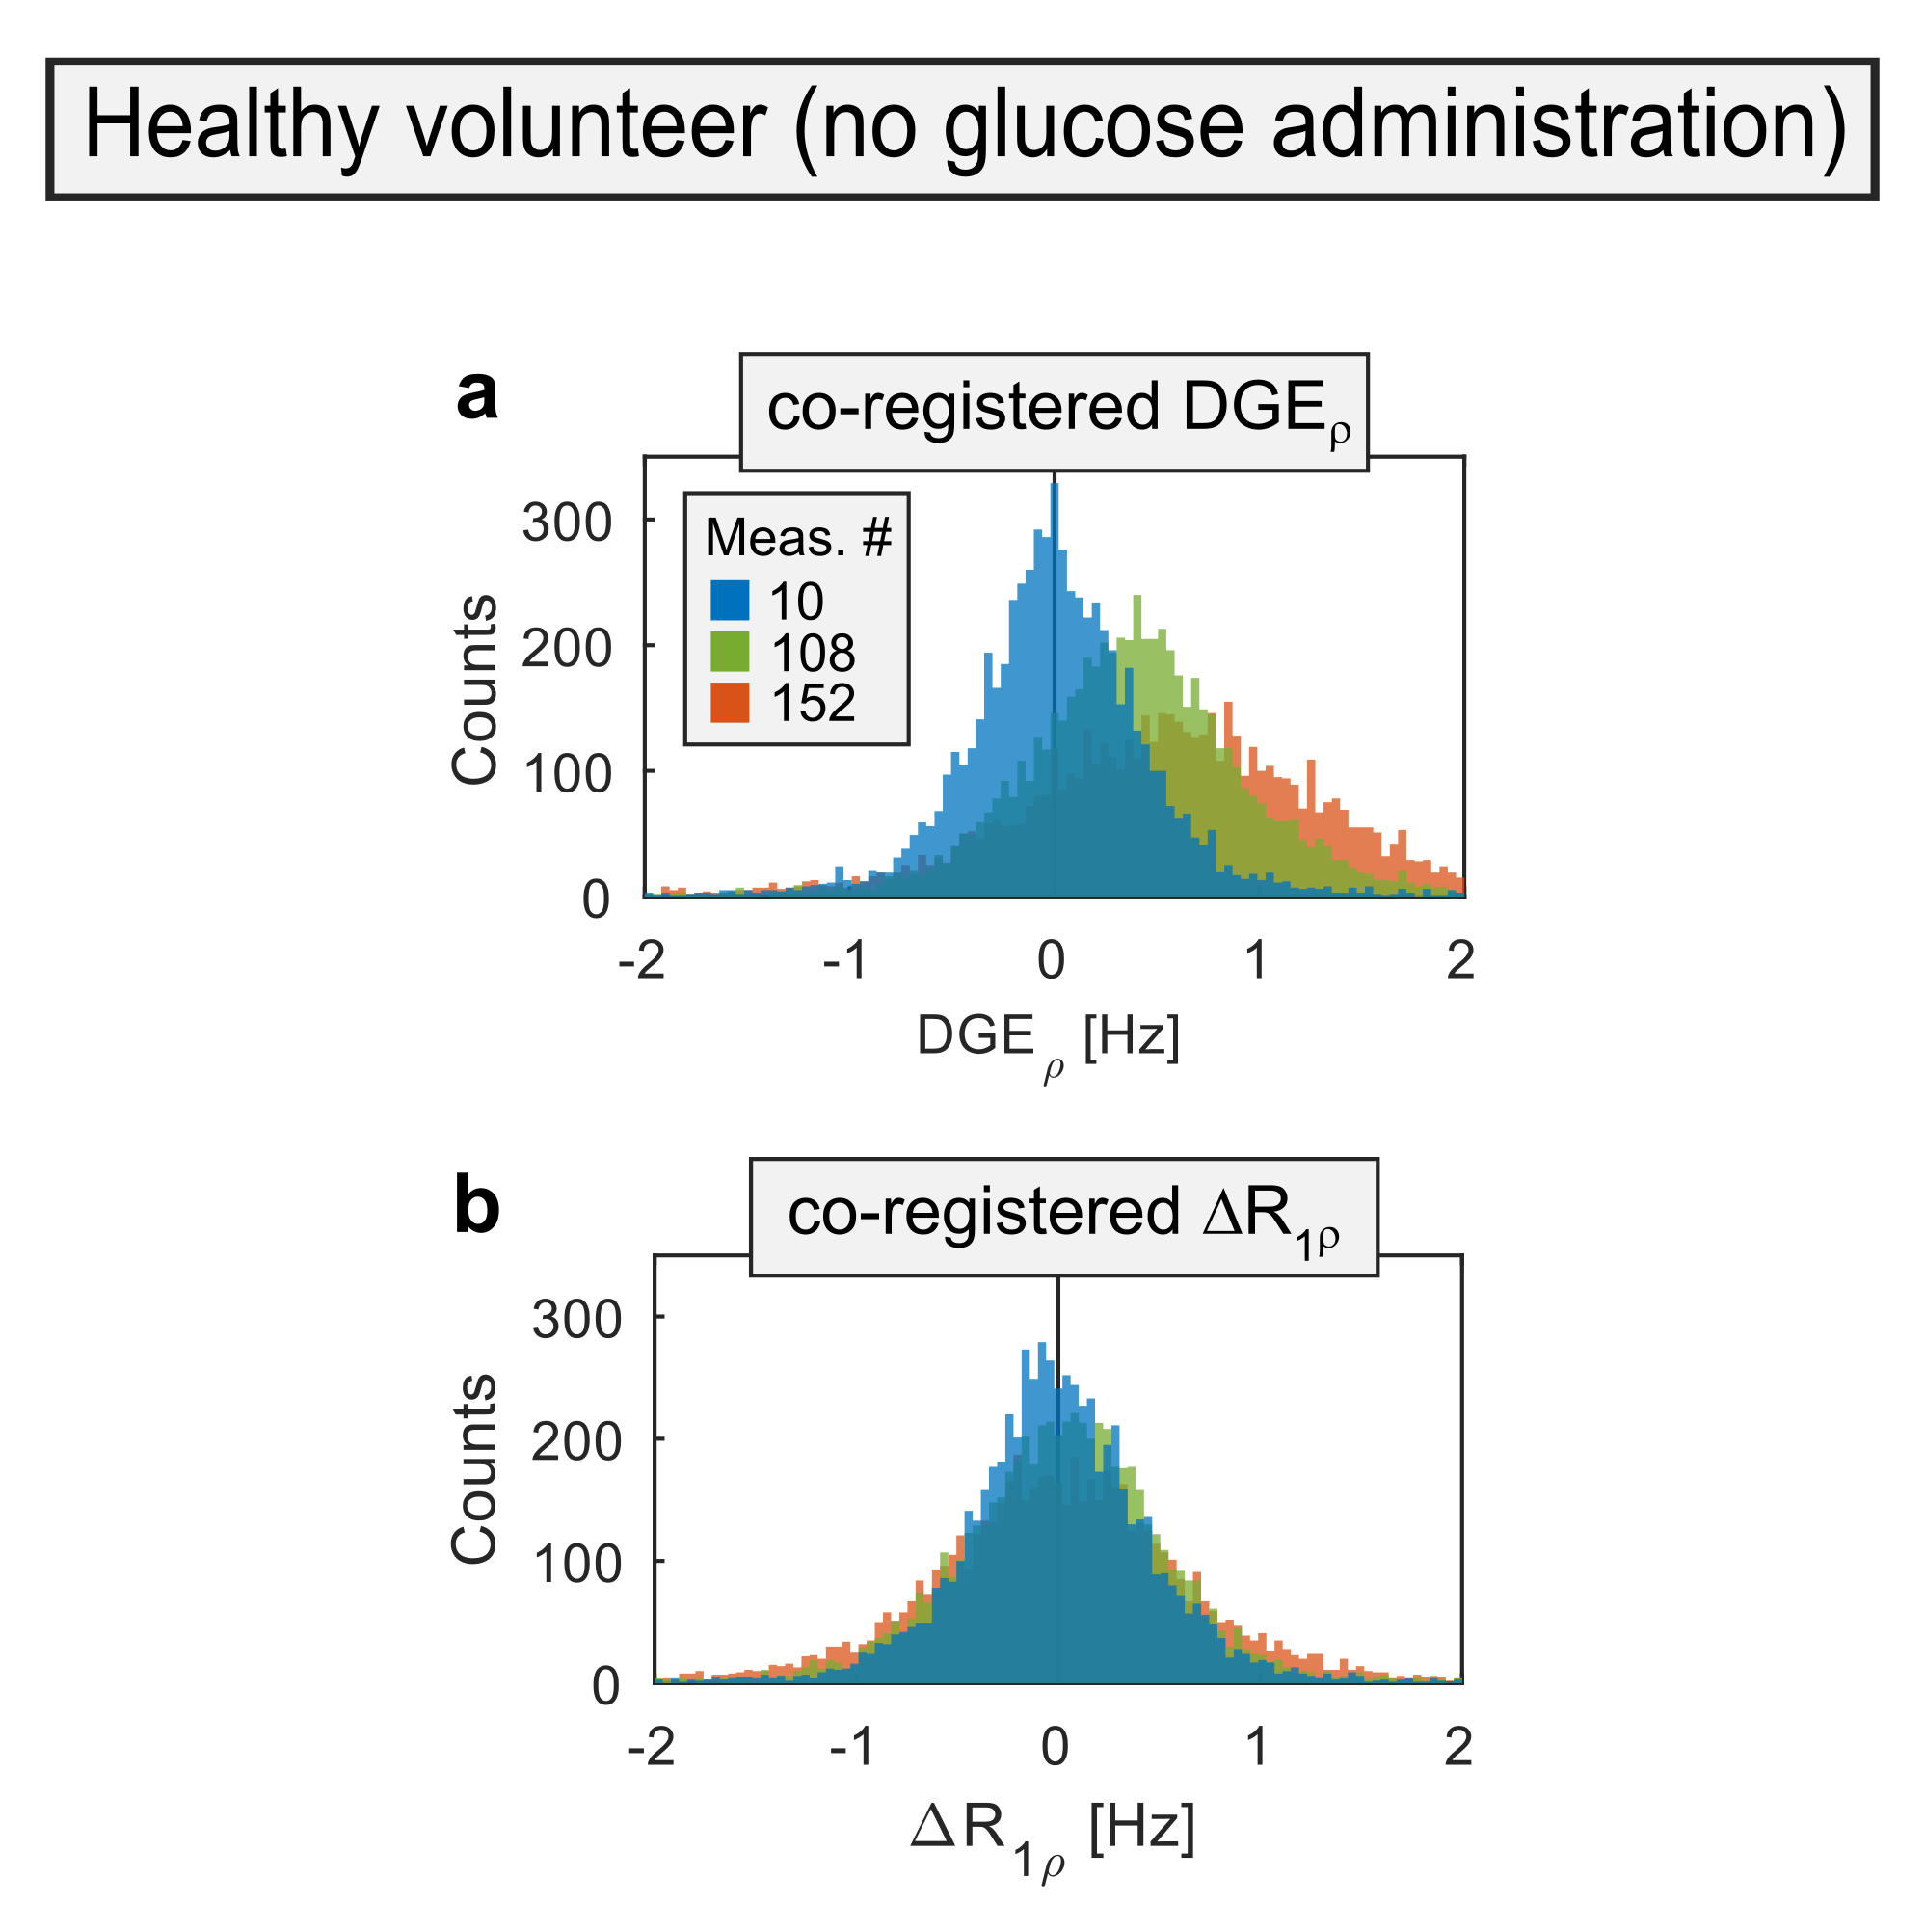
To allow a clear identification of motion-induced artifacts one healthy volunteer was examined without administration of glucose. In addition, a first patient (glioblastoma, WHO grade IV) was examined with administration of D-glucose (2min,100ml,20%). The examinations were approved by the local ethics committee. In vivo 3D CESL MRI (1.7×1.7×3mm3,14 slices) was performed on a 7T-MR scanner (Siemens) using the snapshot-CEST4 approach. Image readout parameters were adapted from ref.4: 560 Hz/pix BW, Grappa 3, 6° FA. Pre-saturation was achieved by an adiabatically prepared spin-lock pulse that was optimized in previous studies5,6(i.e. B$$$_1$$$=5µT, t$$$_{rec}$$$=5s). Images with and without R$$$_{1ρ}$$$ weighting (i.e. spin-lock time TSL=50 and 0.2ms) were acquired in an interleaved manner. Co-registration was performed separately for the two series of images with different TSL using a rigid registration algorithm in MITK7. The transformation information of the co-registration was used to quantify the presence of motion. B1- and B0-maps were calculated using the WASABI-method8. The dynamic glucose-enhanced (DGE$$$_\rho$$$)3,6 contrast was calculated by$$$~DGE_\rho(t)=\frac{S_{50ms}(ref)\,-\,S_{50ms}(t)}{S_{50ms}(ref)\;\cdot\;50ms}~$$$[Eq.1], where S$$$_{50ms}$$$(t) are the acquired R$$$_{1ρ}$$$-weighted images, and S$$$_{50ms}$$$(ref) is the average of the first twenty S$$$_{50ms}$$$(t) images. The ΔR$$$_{1ρ}$$$ contrast based on quantitative R$$$_{1ρ}$$$ maps was calculated according to Jin et al.1: $$$\Delta R_{1\rho}(t)=R_{1\rho}(t)-R_{1\rho}(ref)~$$$[Eq.2], with $$$R_{1\rho}(t)=\frac{\ln[S_{0.2ms}(t)/S_{50ms}(t)]}{50ms\;-\;0.2ms}~$$$[Eq.3], and R$$$_{1ρ}$$$(ref) being the average of the first ten R$$$_{1ρ}$$$(t) maps.Results
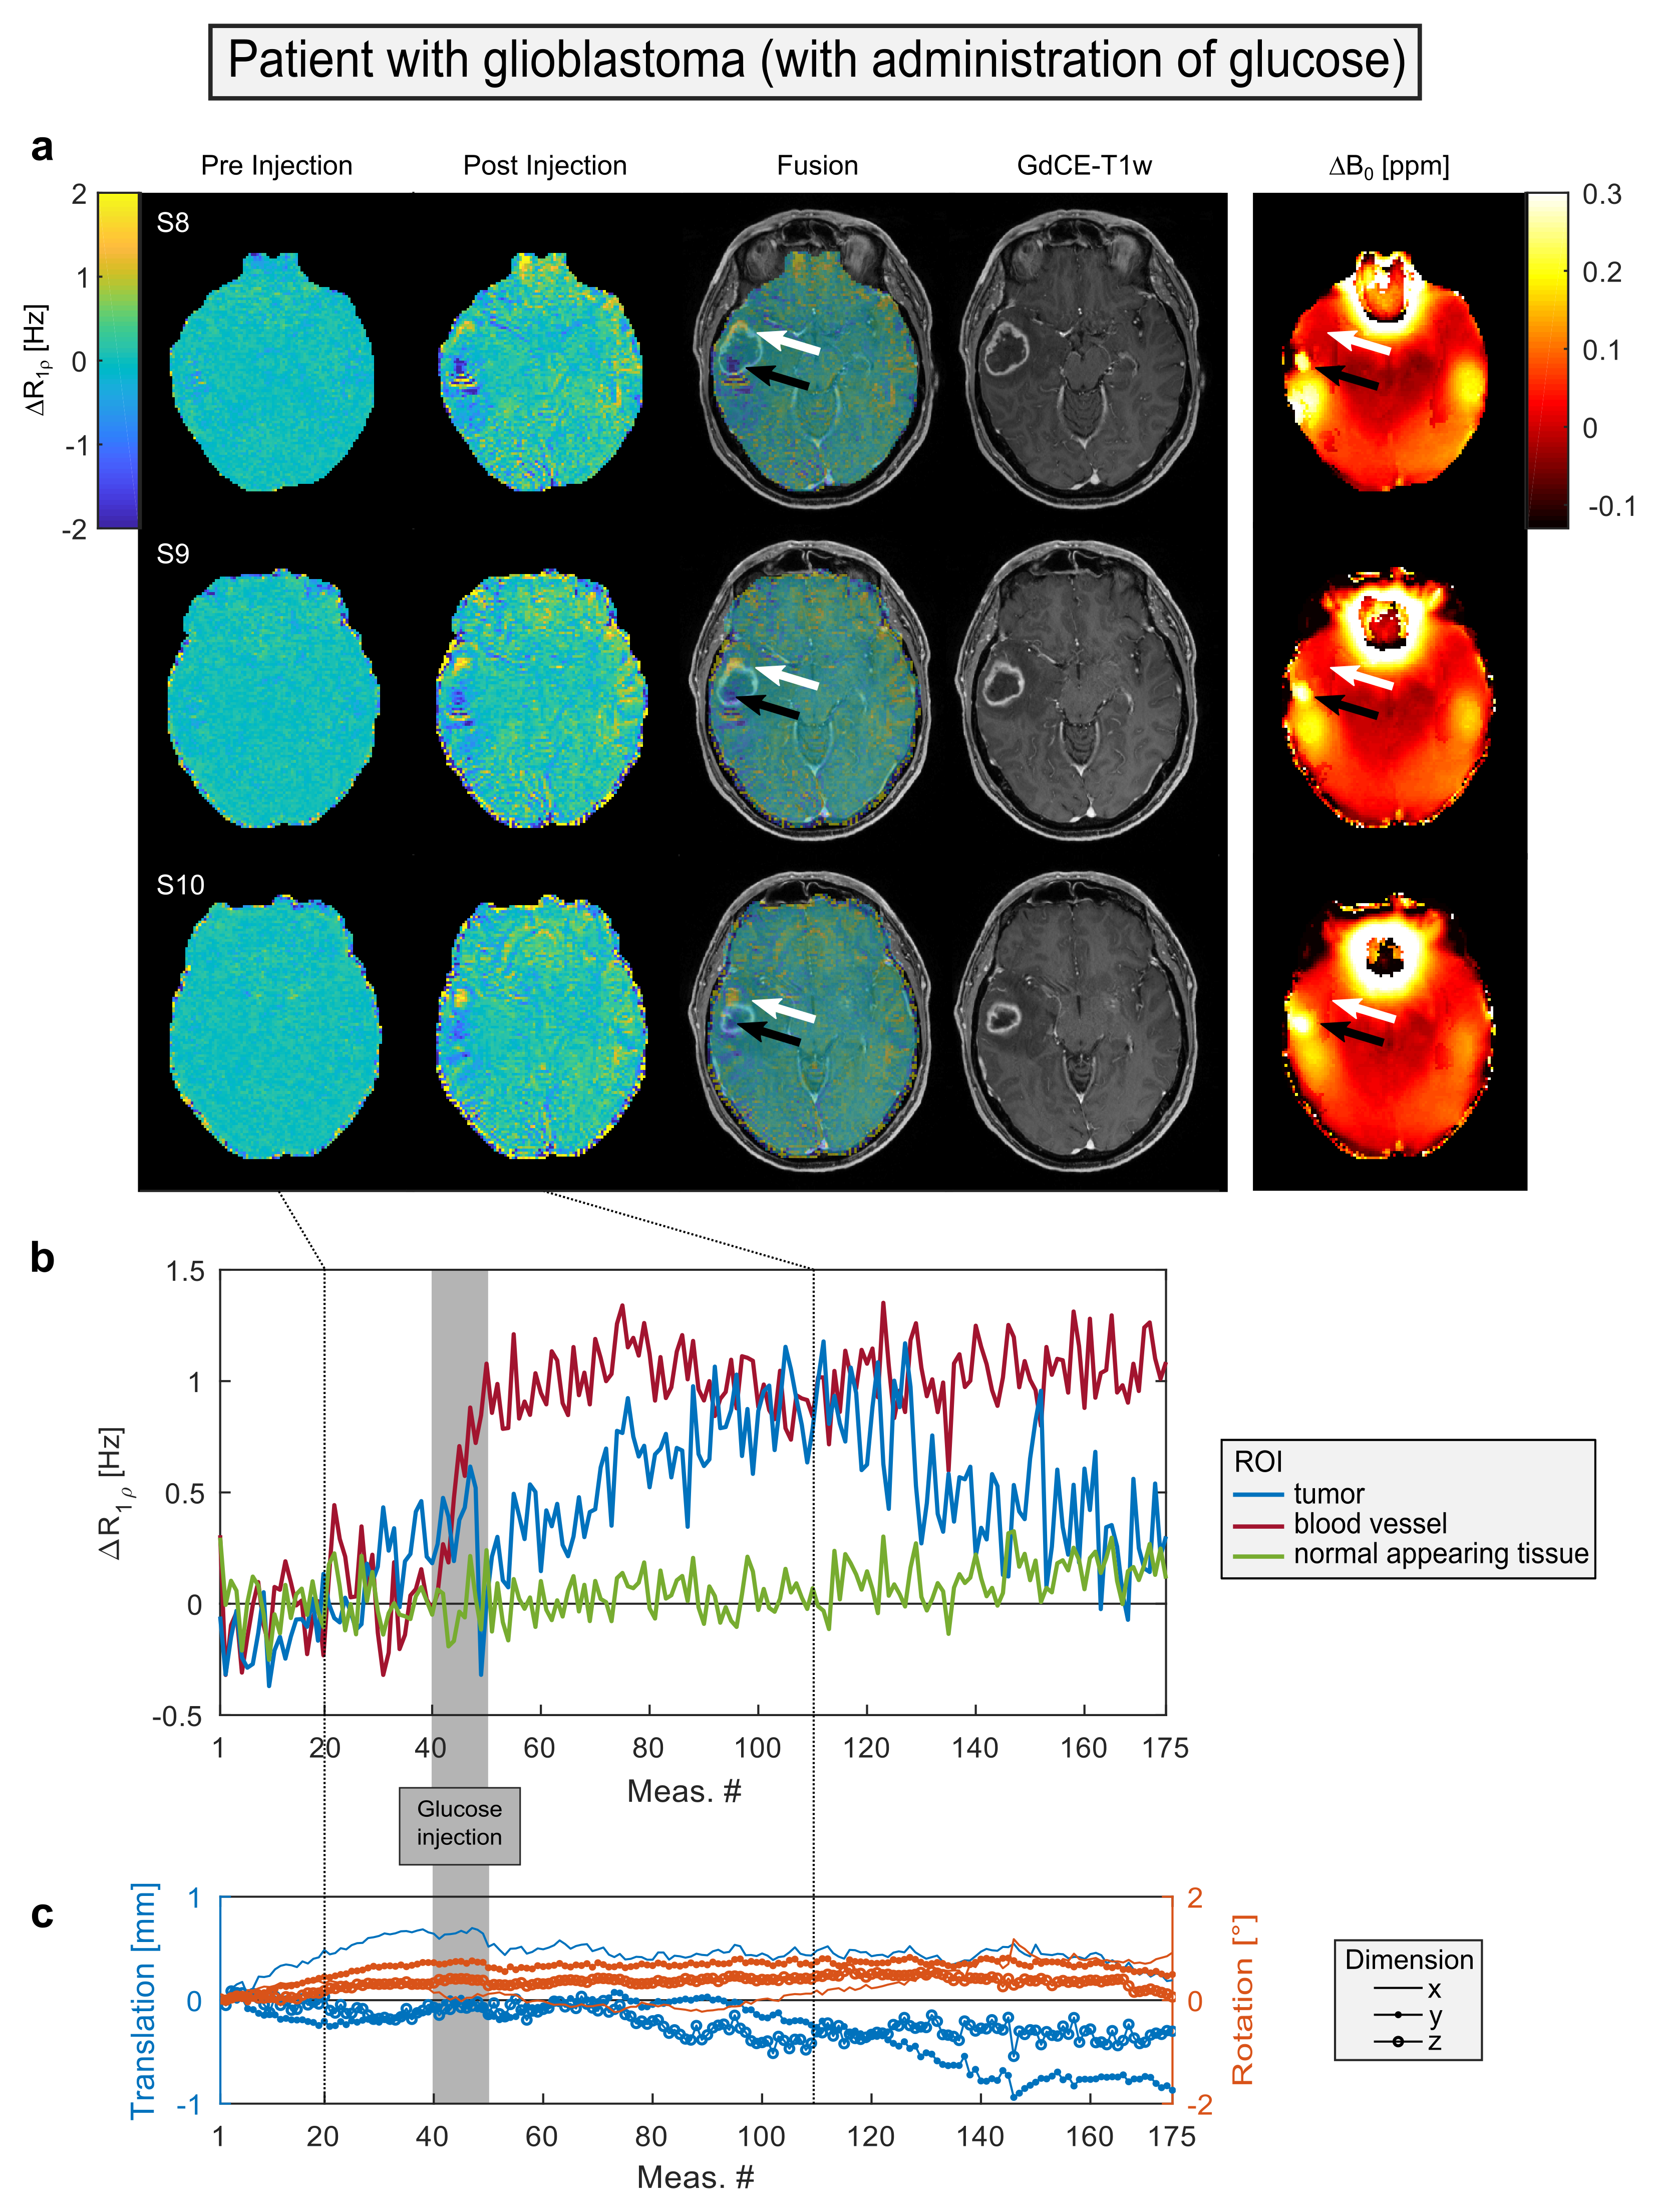
The observed motion of the healthy volunteer during the approximately 40-minute-long examination was in the range of about ±0.5mm and ±1° in each spatial dimension (Fig.1e). Already, such subtle spatial displacements led to strong artifacts in the time course of the unregistered R$$$_{1ρ}$$$-weighted DGE$$$_\rho$$$ contrast (Fig.2a,b). A significant reduction of the motion-induced artifacts was observed after co-registration (Fig.2c,d). However, a global increase in the DGE$$$_{\rho}$$$ contrast was still present throughout almost the entire brain, originating mainly from the spatially varying sensitivity of the coil (Fig.1a). We found that an adequate suppression of this global artifact can be achieved by acquisition of a series of quantitative R$$$_{1ρ}$$$ maps (Fig.2e,f) instead of R$$$_{1ρ}$$$-weighted images. The variation of the resulting ΔR$$$_{1ρ}$$$ time course was in the approximate range of the noise level (i.e.±0.25Hz) and the center of the contrast histogram remained sufficiently constant over time (Fig.3). The final acquisition protocol, including co-registration and quantitative R$$$_{1ρ}$$$ mapping, was then utilized to investigate signal changes after administration of glucose in a patient with glioblastoma. A clear signal increase after glucose injection was observed on one side of the Gd-contrast ring-enhancement (Fig.4, white arrows), which did not correlate with observed B$$$_0$$$-inhomogeneities (Fig.4, black arrows).Discussion
The advantage of quantitative ΔR$$$_{1ρ}$$$ imaging is due to the ratio of two consecutively acquired R$$$_{1ρ}$$$-weighted images (Eq.3). Assuming negligible motion during two consecutive images (Δt$$$~$$$≈$$$~$$$7s), this division normalizes the spatially varying sensitivity of the coil (compare Fig.1a,b) and slab selection profile, which are both dependent on the position of the head. In contrast, glucoCEST- and DGE$$$_\rho$$$-imaging is prone to changes in the spatially varying sensitivity of the coil or altered slab selection, as for normalization a reference image at the beginning of the examination is always used (Eq.1,$$$~$$$Δt$$$~$$$≈$$$~$$$up to several minutes). However, partial volume effects can still not be compensated completely by the quantitative ΔR$$$_{1ρ}$$$ approach which is why the interpretation of the ΔR$$$_{1ρ}$$$ contrast at sharp edges (e.g.tissue borders) has to be performed with caution. Nevertheless, in the examination of a tumor patient in this study, no negative signals were observed around the glucose-induced signal increase in the tumor region (Fig.4, white arrows), providing a preliminary verification of the applicability of the presented acquisition protocol to tumor imaging.Conclusion
The presented 3D acquisition protocol allows glucoCESL examinations in the human brain with improved robustness against motion-induced artifacts. Removing artifacts for glucose-weighted MRI in humans is of high importance for future clinical trials in which an unequivocal assignment of contrast changes to an actual glucose perfusion/uptake is a prerequisite. A sufficient reduction of motion-induced artifacts may also allow transfer of glucose-weighted MRI to clinical magnetic field strengths (i.e.3T), where the contrast-to-noise ratio is even lower.Acknowledgements
The financial support for MZ and KH of the Max Planck Society, German Research Foundation (DFG, grant ZA 814/2-1), and European Union’s Horizon 2020 research and innovation program (Grant Agreement No. 667510) is gratefully acknowledged.
References
1. Jin T, Iordanova B, Hitchens TK, et al. Chemical exchange–sensitive spin-lock (CESL) MRI of glucose and analogs in brain tumors. Magn Reson Med 2018; 80:488-495.
2. Xu X, Yadav NN, Knutsson L, et al. Dynamic Glucose-Enhanced (DGE) MRI: Translation to Human Scanning and First Results in Glioma Patients. Tomography 2015; 1(2):105-114.
3. Paech D, Schuenke P, Koehler C, et al. T1ρ-weighted Dynamic Glucose-enhanced MR Imaging in the Human Brain. Radiology 2017; 285(3):914-922.
4. Zaiss M, Ehses P, and Scheffler K. Snapshot-CEST: Optimizing spiral-centric-reordered gradient echo acquisition for fast and robust 3D CEST MRI at 9.4 T. NMR Biomed 2018; 31:e3879.
5. Schuenke P, Koehler C, Korzowski A, et al. Adiabatically Prepared Spin-Lock Approach for T1ρ-Based Dynamic Glucose Enhanced MRI at Ultrahigh Fields. Magn Reson Med 2017; 78:215-225.
6. Schuenke P, Paech D, Koehler C, et al. Fast and Quantitative T1ρ-weighted Dynamic Glucose Enhanced MRI. Scientific Reports 2017; 7: 2045-2322.
7. Nolden M, Zelzer S, Seitel A, et al. The Medical Imaging Interaction Toolkit: challenges and advances. Int J CARS 2013; 8(4):607-620.
8. Schuenke P, Windschuh J, Roeloffs V, et al. Simultaneous mapping of water shift and B1(WASABI)-Application to field‐Inhomogeneity correction of CEST MRI data. Magn Reson Med 2017, 77: 571-580.
Figures