5007
A comparison of dynamic and static B0 mapping approaches for correction of CEST MRI at 7T1High Field MR Centre, Department of Biomedical Imaging and Image-guided Therapy, Medical University of Vienna, Vienna, Austria, 2Medical Physics and Bioengineering, University College London, London, United Kingdom, 3Siemens Healthineers, Sydney, Australia, 4Athinoula A. Martinos Center for Biomedical Imaging, Department of Radiology, Massachusetts General Hospital, Harvard Medical School, Boston, MA, United States, 5Christian Doppler Laboratory for Clinical Molecular MR Imaging, Vienna, Austria
Synopsis
In contrast to established static B0 correction approaches which assume an invariant static field during a CEST MRI acquisition, we propose three methods which can track and compensate temporal B0 fluctuations by shifting each Z-spectral point separately before MTRasym analysis. We show the benefit of the proposed dynamic methods in comparison to three established static approaches by assessing their performance in the absence/presence of an induced frequency drift. In addition, we investigate the reliability and reproducibility of CEST MRI at ultra-high field (7T) by evaluating the drift’s impact on the B0-corrected MTRasym maps in the brains of five healthy volunteers.
Introduction
Chemical Exchange Saturation Transfer (CEST) MRI benefits from ultra-high field due to increased spectral resolution. Local magnetic field inhomogeneities, δB0, are more severe, however, complicating CEST quantification1. Static B0-correction techniques are prone to errors since they assume negligible temporal B0-fluctuations arising from system instabilities (such as frequency drifts) or involuntary subject movement. We propose and compare the in vivo performance of three different dynamic B0-correction methods for CEST MRI which should lead to more reliable MTRasym maps than three established static B0-correction approaches in the presence of B0-instabilities.Methods
The three δB0 mapping approaches for static CEST correction were:
(A) CEST-minZ: δB0 from the minimum of the interpolated Z-spectra (intrinsic)2
(B) WASSR: δB0 from high spectrally resolved Z-spectra without fat suppression (pre-scan)1
(C) GRE-2TE: δB0 from a dual-echo gradient echo (GRE) readout reference scan (pre-scan)3
The three proposed B0 tracking approaches for dynamic CEST correction were:
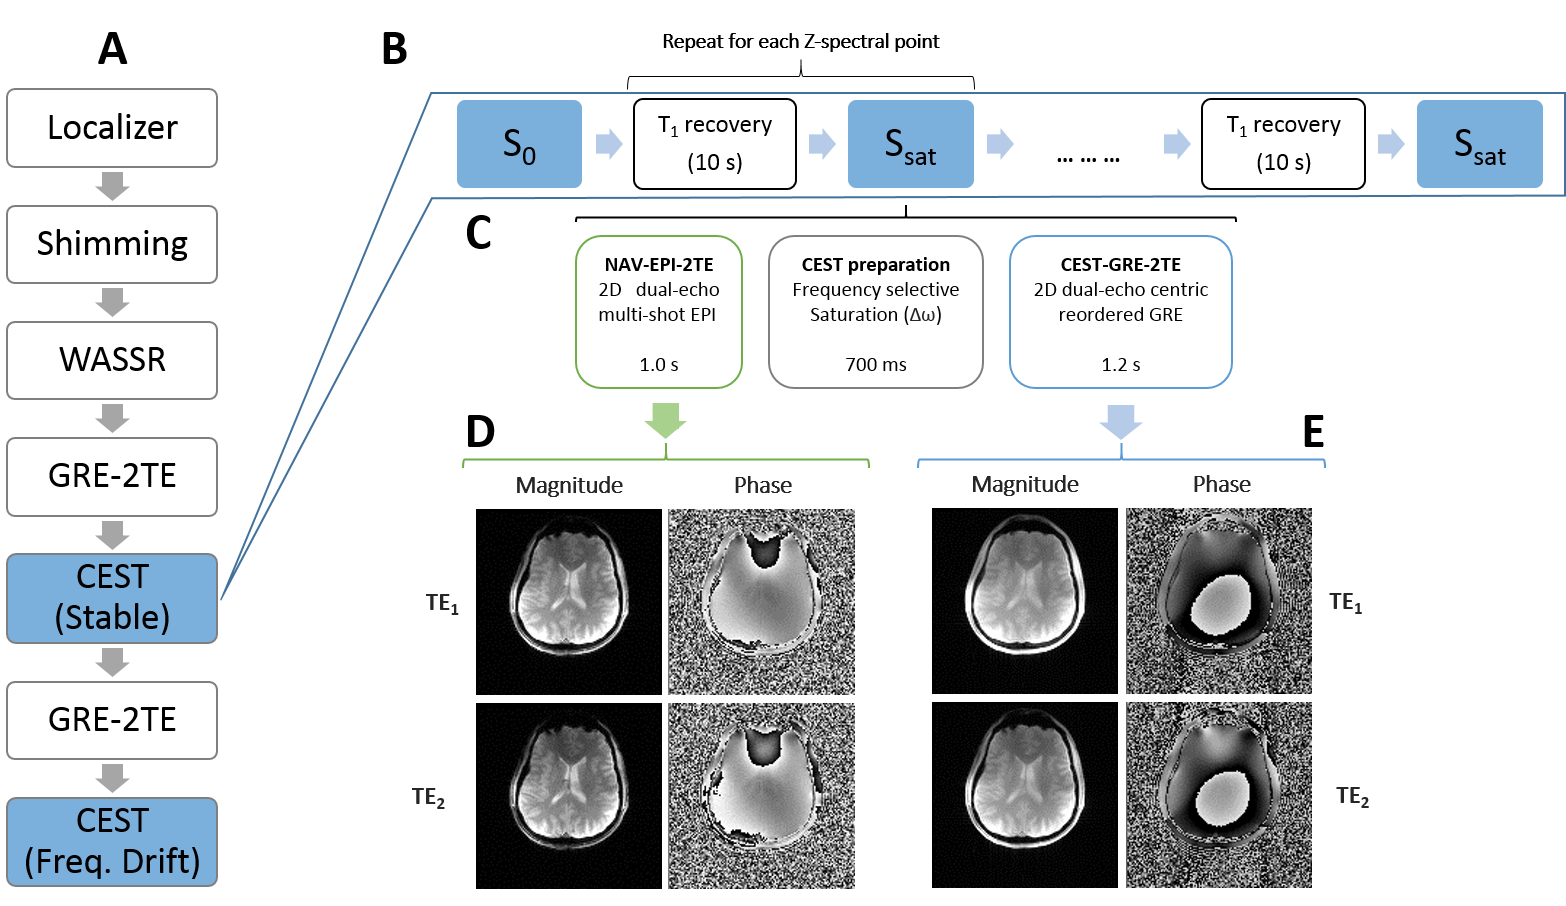
(D) CEST-GRE-2TE: δB0(t) from a dual-echo GRE readout which replaces the single-echo GRE readout after the CEST-labeling module (intrinsic)4
(E) CEST-GRE-1TE: δB0(t) from a single-echo GRE readout after the CEST-labeling module. Additionally, coil phase offset maps need to be determined (intrinsic/pre-scan)5;6
(F) NAV-EPI-2TE: δB0(t) from a dual-echo multi-shot EPI readout that is interleaved with the CEST sequence (interleaved navigator)7;8
The study was performed on a whole-body 7T MR system (Magnetom, Siemens) with a 1H 32-channel head coil (Nova Medical). The 2D sequences had a resolution of 2.1x2.1x6.0mm³ for which image acquisition/analysis parameters were matched (details in Table 1). Image processing, coil combination, B0 map calculation and ROIs statistics were conducted in MATLAB (MathWorks). B0-correction and asymmetric magnetic transfer ratio (MTRasym) analysis were performed voxel wise.
Initial phantom tests were performed to evaluate the consistency of the B0 mapping among the different methods and to stablish their dependency on the CEST-labeling module.
The impact of the method of B0 determination on the MTRasym was assessed in five healthy volunteers. To show the performance of the dynamic compensation methods versus the static methods in the presence of scanner instabilities, a ~4Hz/min frequency drift was induced during the CEST re-scan (protocol flow in FIG.1). This is consistent with previous reported drifts at 3T9-11.
Results
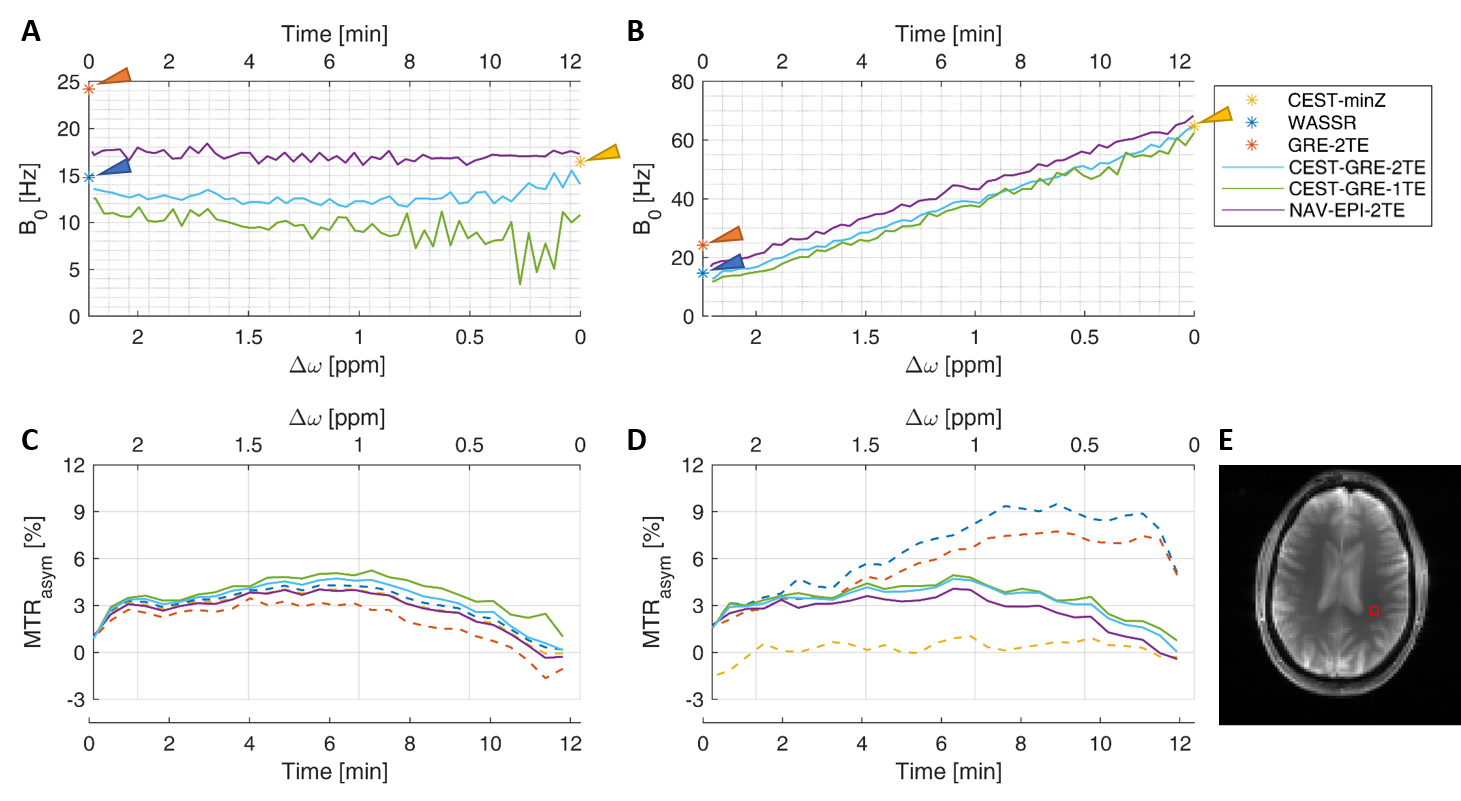
The dynamic correction methods successfully tracked the B0 evolution to independently correct each Z-spectral point before MTRasym analysis. The intrinsic dynamic methods CEST-GRE-2TE and CEST-GRE-1TE were not corrupted by the RF saturation prior to the CEST readout for ∆ω≈>|0.24|ppm. FIG.2 shows the effect of the B0 determination on the corrected MTRasym curves among the different correction methods. In the presence of an induced ~4Hz/min drift, the established static methods resulted in severely underestimated (~1/3 for CEST-minZ) or overestimated (~3 times for WASSR and GRE-2TE) ratios compared to the stable case. CEST-minZ estimated B0 approximately at the end of the CEST scan (δB0(12min)≈48Hz) in contrast to the pre-scans WASSR and GRE-2TE (δB0(0min)≈0Hz).
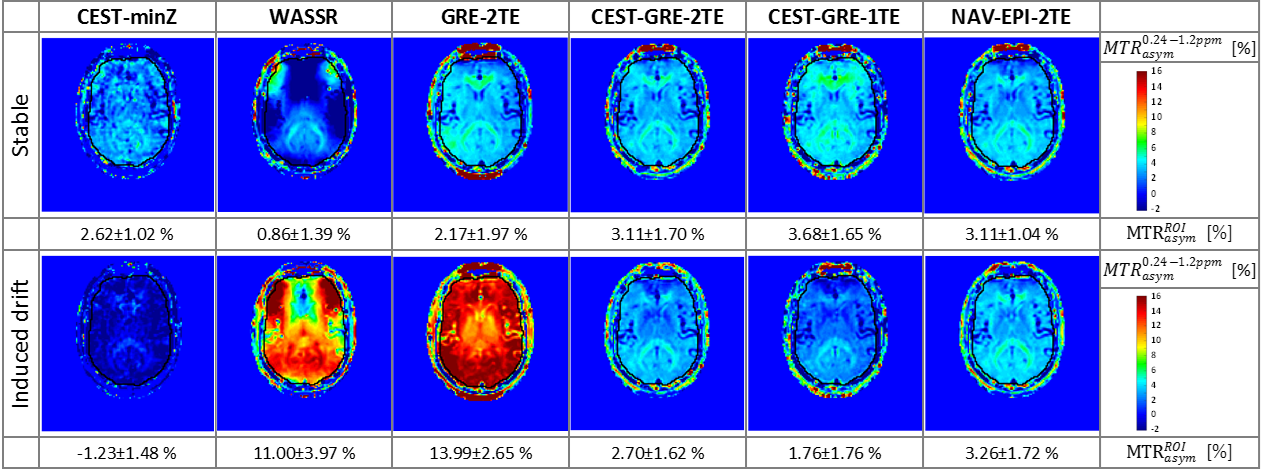
The resulted color-coded MTRasym maps are presented in FIG.3. Among the dynamic correction methods, NAV-EPI-2TE and CEST-GRE-2TE provided closest B0-corrected contrasts between the two CEST acquisitions (stable conditions VS induced drift). CEST-GRE-1TE showed some deviations, but was still better than all static methods.
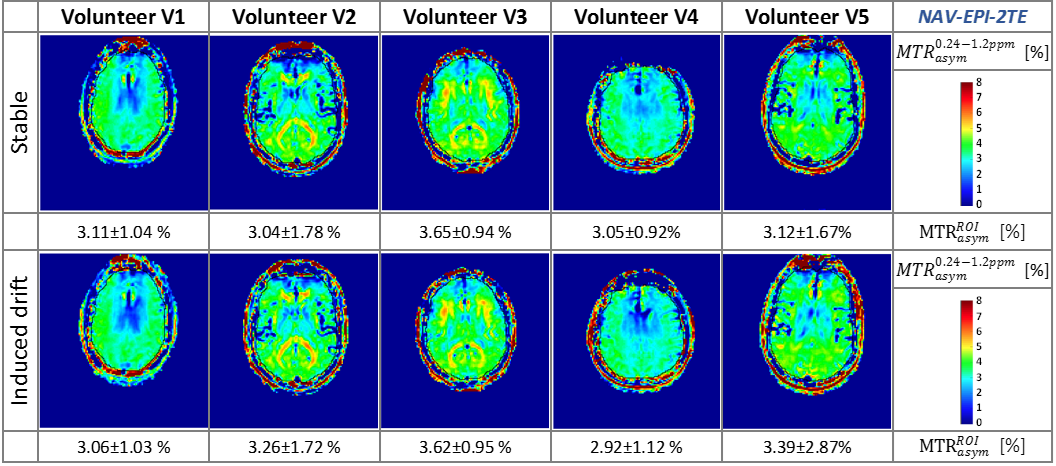
To investigate the CEST scan-rescan reproducibility, a comparison among five healthy volunteers was performed. The results provided by NAV-EPI-2TE, presented in FIG.4, show highly consistent MTRasym maps. CEST-GRE-2TE achieved similar uniform results among volunteers with the exception of frontal and periventricular discrepancies in volunteer V2.
Discussion and Conclusion
The current study focused on the MTRasym integration range ∆ω=±[0.24-1.18]ppm, to test the performance of the proposed correction methods for the most challenging frequencies due to the high slope of the Z-spectrum1.
The proposed dynamic method CEST-GRE-2TE tracks the B0 field intrinsically from a dual-echo CEST scan requiring no additional measurements, making it widely applicable. CEST-GRE-1TE shortens the measurement time by allowing a single-echo CEST scan, at the expense of a negligible ~1s long pre-scan. The implementation of NAV-EPI-2TE is more complex since it requires interleaved B0 maps via a navigator, but it is completely insensitive to the RF saturation applied for CEST-labeling.
The proposed dynamic methods could be additionally combined with real-time motion correction by extending the navigator to 3D as previously shown for MRI and MRSI 7;8;12;13. Such techniques will be assessed in further work to, on top of B0-instabilities, readily correct for motion-induced δB0.
This study provides an excellent basis for reliable clinical CEST MRI in presence of temporarily fluctuating B0-inhomogeneities, offering more accurate water resonance determination, avoiding the need of lengthy pre-scans (required for WASSR) and shortening the measurement time by allowing the use of fewer Z-spectral points (as required for CEST-minZ).
Acknowledgements
This material is based upon work supported by Christian Doppler Laboratory for Clinical Molecular MRI and the Austrian Science Fund (FWF) under Grant KLI-718.
Special gratitude to Vladimir Mlynarik for his guidance and assistance.
References
1. Kim M, Gillen J, Landman BA, Zhou J, van Zijl PC. 2009. Water saturation shift referencing (wassr) for chemical exchange saturation transfer (cest) experiments. Magn Reson Med. 61(6):1441-1450.
2. Zaiss M, Schmitt B, Bachert P. 2011. Quantitative separation of cest effect from magnetization transfer and spillover effects by lorentzian-line-fit analysis of z-spectra. J Magn Reson. 211(2):149-155.
3. Kawanaka A, Takagi M. 1986. Estimation of static magnetic field and gradient fields from nmr image. Journal of Physics E: Scientific Instruments. 19(10):871.
4. Visser E, Poser BA, Barth M, Zwiers MP. 2012. Reference-free unwarping of epi data using dynamic off-resonance correction with multiecho acquisition (docma). Magn Reson Med. 68(4):1247-1254.
5. Robinson S, Grabner G, Witoszynskyj S, Trattnig S. 2011. Combining phase images from multi-channel rf coils using 3d phase offset maps derived from a dual-echo scan. Magn Reson Med. 65(6):1638-1648.
6. Dymerska B, Poser BA, Barth M, Trattnig S, Robinson SD. 2018. A method for the dynamic correction of b0-related distortions in single-echo epi at 7t. NeuroImage. 168:321-331.
7. Hess AT, Tisdall MD, Andronesi OC, Meintjes EM, van der Kouwe AJ. 2011. Real-time motion and b0 corrected single voxel spectroscopy using volumetric navigators. Magn Reson Med. 66(2):314-323.
8. Bogner W, Hess AT, Gagoski B, Tisdall MD, van der Kouwe AJ, Trattnig S, Rosen B, Andronesi OC. 2014. Real-time motion- and b0-correction for laser-localized spiral-accelerated 3d-mrsi of the brain at 3t. NeuroImage. 88:22-31.
9. Harris AD, Glaubitz B, Near J, John Evans C, Puts NA, Schmidt-Wilcke T, Tegenthoff M, Barker PB, Edden RA. 2014. Impact of frequency drift on gamma-aminobutyric acid-edited mr spectroscopy. Magn Reson Med. 72(4):941-948.
10. Rowland BC, Liao H, Adan F, Mariano L, Irvine J, Lin AP. 2017. Correcting for frequency drift in clinical brain mr spectroscopy. Journal of neuroimaging : official journal of the American Society of Neuroimaging. 27(1):23-28.
11. Lee CY, Choi IY, Lee P. 2018. Prospective frequency correction using outer volume suppression-localized navigator for mr spectroscopy and spectroscopic imaging. Magn Reson Med.
12. Hess AT, Andronesi OC, Tisdall MD, Sorensen AG, van der Kouwe AJ, Meintjes EM. 2012. Real-time motion and b0 correction for localized adiabatic selective refocusing (laser) mrsi using echo planar imaging volumetric navigators. NMR in biomedicine. 25(2):347-358.
13. Alhamud A, Taylor PA, van der Kouwe AJ, Meintjes EM. 2016. Real-time measurement and correction of both b0 changes and subject motion in diffusion tensor imaging using a double volumetric navigated (dvnav) sequence. NeuroImage. 126:60-71.
Figures