5006
The 7T z-spectrum from the human liver in-vivo: observing the effects of a meal1University of Nottingham, Nottingham, United Kingdom, 2University Medical Center Utrecht, Utrecht, Netherlands
Synopsis
In this work we acquired the first z-spectrum from the human liver in vivo at 7T. Glycogen and NOE peaks were observed, and their evolution over time was monitored after fasting and after a meal. Both the glycogen peak and the NOE peak at -1.7ppm were observed to increase 2-4 hours after a high carbohydrate meal.
Purpose
Glycogen is the primary short term energy store found
predominantly in liver and muscle and plays a key role in glucose metabolism in
health and disease (e.g. diabetes)1. It can be studied with
non-localised natural abundance 13C MRS2 but experiments
are time consuming and difficult particularly in patients with significant adipose
tissue. Z-spectrum CEST imaging offers an alternative approach to map glycogen3 and has the potential to improve signal strength and
reduce scan time compared to 13C MRS, without multi-nuclear
equipment.
Previous studies have shown that glycoCEST is sensitive to in vivo changes in glycogen stores in
humans at 3T when using MTRasym analysis4, however a full
z-spectrum will give additional information, and aid in identifying respiratory
artefacts which greatly impact the signal in the z-spectrum in abdominal
imaging. Furthermore imaging at 7T provides considerably enhanced sensitivity
to CEST and NOE effects.
Aim
To observe changes to the z-spectrum in the liver at 7T in
response to feeding.
Methods
4 subjects (age=24,26,36,55,2F) were fasted for +16 hours
before being scanned on a 7T Philips Achieva system using a multi-transmit
system using a 8TX/32RX fractionated dipole body array (MRCoils, Zaltbommel,
Netherlands). Z-spectra were acquired at 64 off-resonance frequencies between
±100,000Hz using Semi-CW acquisition5,6 (TFEPI readout, 3s
saturation, B1,max=1μT, single slice, acquisition time=10mins/spectrum). Each dynamic was acquired
during a breath hold of 4.7s, with 4.3s spacing for the subject to breathe.
Volume B0 shimming
was performed over the liver and RF shimming (phase nulling) was performed on a
small target ROI using in-house software to maximise the B1+ in the ROI.
After the initial fasted scan, subjects were offered ad-libitum
food, high in carbohydrates. They were then scanned at two hour
intervals. One subject was then scanned 3 times over 30mins to assess
repeatability.
The target ROI in the liver was masked, and spectra were
averaged and B0 corrected pixel-wise using in-house MATLAB
scripts. After initial analysis, two peaks were quantified by measuring the
area under a region in the spectrum: the expected glycogen peak between +0.8ppm
and +1.8ppm, and an NOE peak between -2ppm and -1.17ppm.
A glycogen phantom was also scanned using a NOVA 32ch pTx
head coil to confirm the expected peaks.
Results
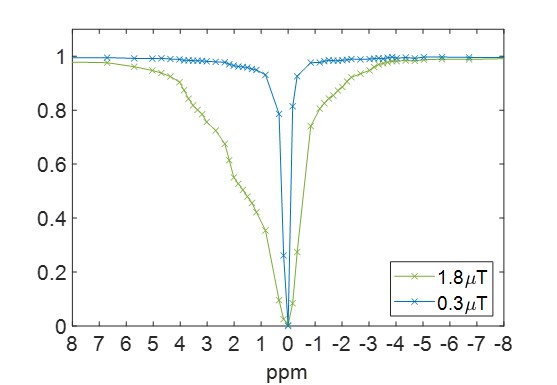
Figure 1 shows the spectrum from the glycogen phantom at (a)
1.8μT, and (b) 0.3μT, which closely matched the saturation power achieved from
the body coil. It appears that there is a second exchanging pool at +3.2ppm, which
is not visible at lower powers. This is comparable to the signal reported from
glucose by van Zijl3, suggesting there may have been some glucose
present in the phantom.
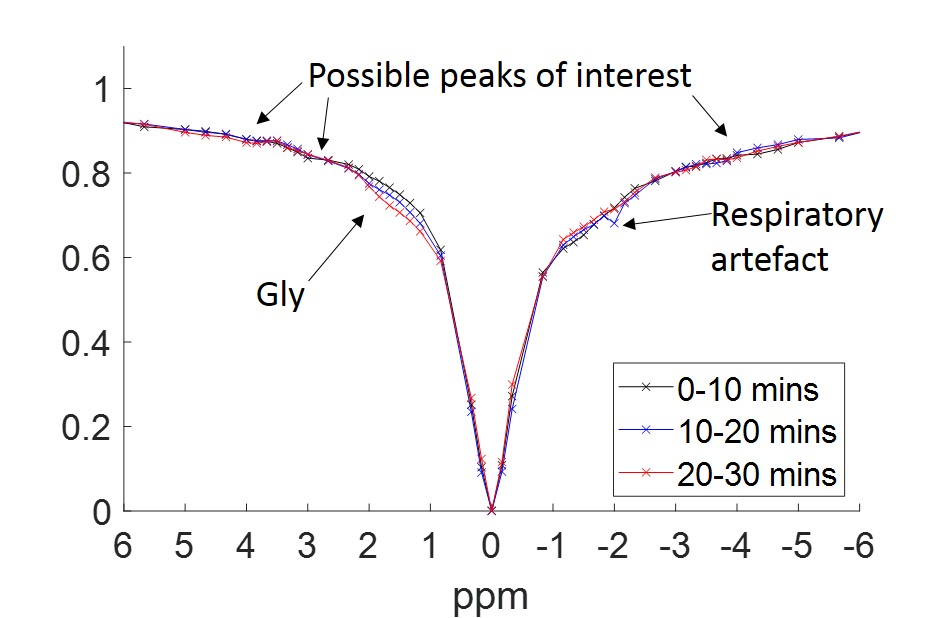
Figure 2 shows that repeatability was good across the spectrum, although the peak assigned to glycogen
increased over the course of 20mins, possibly due to glycogen storage.
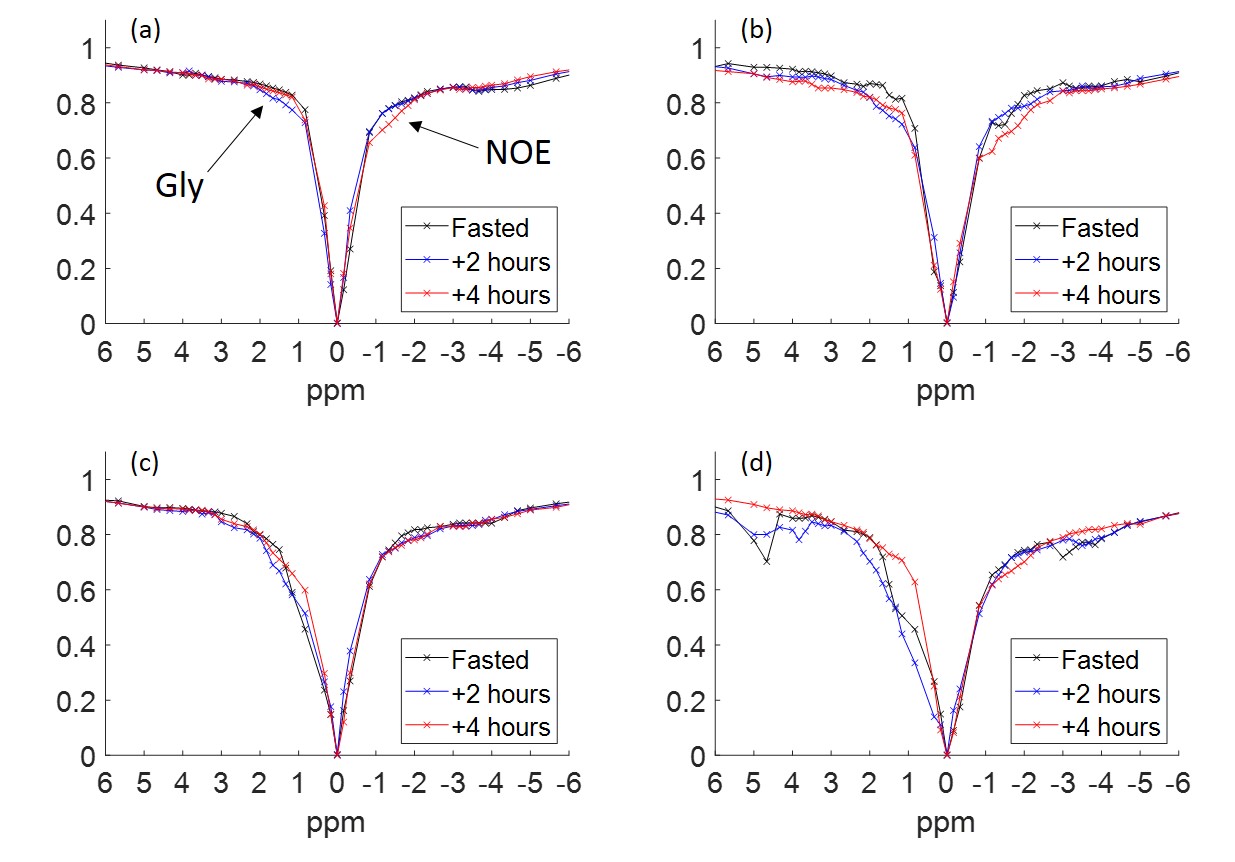
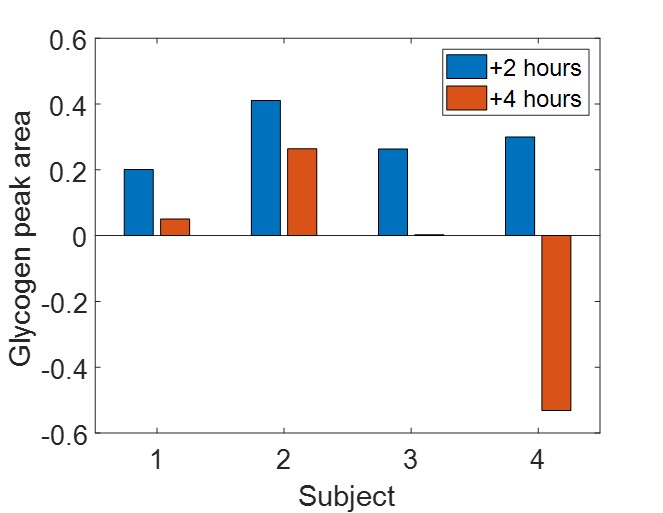
Figure 3 shows the spectra acquired from 4 subjects. The
general trend appears to be that the glycogen levels rise after two hours, and
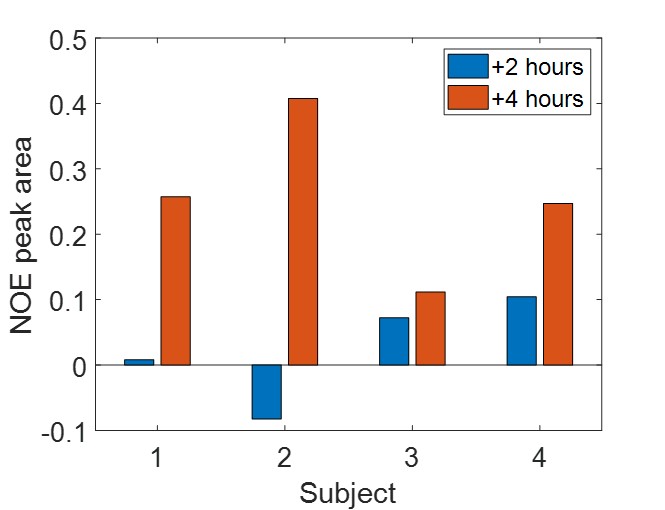
begin to fall after 4 hours, also illustrated in figure 4. Figure 5 shows that
the NOE peak visible at -1.7ppm rises most after 4 hours.
Discussion
This is the first z-spectrum acquired in the liver at 7T.
Figure 2 suggests multiple z-spectrum features that have been observed in
other tissues which might be of interest, e.g. MT was evident on all
spectra, which might be relevant in monitoring liver fibrosis.
We observed and quantified a glycogen peak which varied over
subjects and with time after a meal. It was unexpected that the glycogen levels
would drop back down to baseline after 4 hours, particularly since subjects
were encouraged to keep eating. However there was variation in subject age,
size, and weight, and future studies will use a more controlled feeding
protocol and blood glucose monitoring.
The NOE peak observed at -1.7ppm is a source of great
interest. It has previously seen to be visible in blood7, and so may
be linked to increased blood flow into the liver. It also emphasizes that such
data should not be quantified using asymmetry analysis.
Figure 3 shows the importance of acquiring the data
breath-held. Noisy spectra were observed when subjects admitted to have fallen
asleep, and indeed motion could be seen on the images from these time-points.
This accounts for the apparent drop in glycogen after 4 hours in subject 4,
where movement was observed on the first two spectra, altering the
acquired signal. Future work will consider improved methods of respiratory
control and monitoring.
Conclusion
Z-spectrum imaging performed in the liver at 7T yields
quantifiable changes in peaks consistent with glycogen and also in the NOE
signal located at -1.7ppm. Both of these signals rose two and four hours after
a meal respectively.
Acknowledgements
No acknowledgement found.References
1 Kalderon, B., Gopher, A., & Lapidot, A. (1986).
Metabolic pathways leading to liver glycogen repletion in vivo, studied by
GC‐MS and NMR. FEBS letters, 204(1), 29-32.
2 Sillerud, L. O., & Shulman, R. G. (1983). Structure
and metabolism of mammalian liver glycogen monitored by carbon-13 nuclear
magnetic resonance. Biochemistry, 22(5), 1087-1094.
3 Van Zijl, P. C., Jones, C. K., Ren, J., Malloy, C. R.,
& Sherry, A. D. (2007). MRI detection of glycogen in vivo by using chemical
exchange saturation transfer imaging (glycoCEST). Proceedings of the National
Academy of Sciences, 104(11), 4359-4364.
4 Deng, M., Chen, S. Z., Yuan, J., Chan, Q., Zhou, J., &
Wáng, Y. X. J. (2016). Chemical exchange saturation transfer (CEST) MR
technique for liver imaging at 3.0 Tesla: an evaluation of different offset
number and an after-meal and over-night-fast comparison. Molecular Imaging and
Biology, 18(2), 274-282.
5 Hoogduin H, Khlebnikov V, Keupp
J, et al (2017) Semi continuous wave CEST with alternating sets of 4 transmit
channels at 7T. MAGMA 30:S1–S152.
6 Keupp J, Baltes C, Harvey PR,
Brink J van den (2011) Parallel RF Transmission based MRI Technique for Highly
Sensitive Detection of Amide Proton Transfer in the Human Brain at 3T. Proc
Intl Soc Mag Reson Med 19:710.
7 Shah, S. M., Mougin, O. E., Carradus, A. J., Geades, N.,
Dury, R., Morley, W., & Gowland, P. A. (2018). The z-spectrum from human
blood at 7T. NeuroImage, 167, 31-40.
Figures