5003
Model-free generation of CEST contrast using principal components of Z-spectra at 3 T1High-field magnetic resonance center, Max Planck Institute for biological cybernetics, Tübingen, Germany
Synopsis
Fitting of spectrally selective CEST contrasts requires models with limiting assumptions. Snapshot CEST allows us to densely sample the Z-spectrum with rapid volumetric imaging within a clinically feasible scan time. With over 60k spectra available per subject, statistically-driven analysis methods are now possible. Here we demonstrate that principle component analysis can be used for model-free analysis of spectral features. Projection of Z-spectra onto principle components from a group of healthy subjects provides several relevant contrasts which reveal anatomical detail and correlate with Gadolinium uptake signatures in a brain tumor patient.
Purpose
Several Chemical Exchange Saturation Transfer (CEST) effects can be observed at 3T (amide-, amine-, rNOE-CEST). For their evaluation various regression models are used to isolate different contrasts, e.g. removal of extrapolated magnetization transfer [1], or Lorentzian line fit approaches [2], as well as linear baseline removal [3]. Such approaches are always limited by the assumptions about what is background and what is a signal. The purpose of this work is to begin examining sophisticated feature extraction in highly-sampled CEST data. Here we propose a data-driven modeling approach using the principal components of the Z-spectrum. Meaningful components could be identified by their CEST contrast generation in healthy tissue and in tumor areas.Methods and Materials
A snapshot gradient echo CEST readout was combined with an optimized low-power presaturation to target spectrally selective amide- and NOE-CEST effects (100 Gaussian pulses, tpulse = 20 ms, duty cycle 50 %, tsat = 4 s) [4]. Imaging was performed at 3 T (Prisma or PET/MR, Siemens Healthcare) in three healthy subjects and four brain tumor patient after written informed consent with 1.7x1.7x3 mm3 resolution and 220x178x54mm3 field-of-view. Acquisition time for selective CEST (56 frequency offsets) was 6.5 minutes. After motion correction, B0 correction, and skull stripping, low-power Z-spectra from three volunteers were concatenated. After removing the mean Z-spectrum, the residual signals were analyzed using principal component analysis (PCA). Acquired Z-spectra of each subject were projected onto each principle component (PC) to identify spatial correlations. Tumor patient Z-spectra were projected onto the PCs determined from healthy subjects. Comparison was performed with two-stage Lorentzian fitting [4] of PCA-denoised Z-spectra [5] to isolate background (direct water saturation, DS, and semisolid magnetization transfer, ssMT) and CEST signals (amide at +3.5 ppm, and rNOE at -3.5 ppm).Results
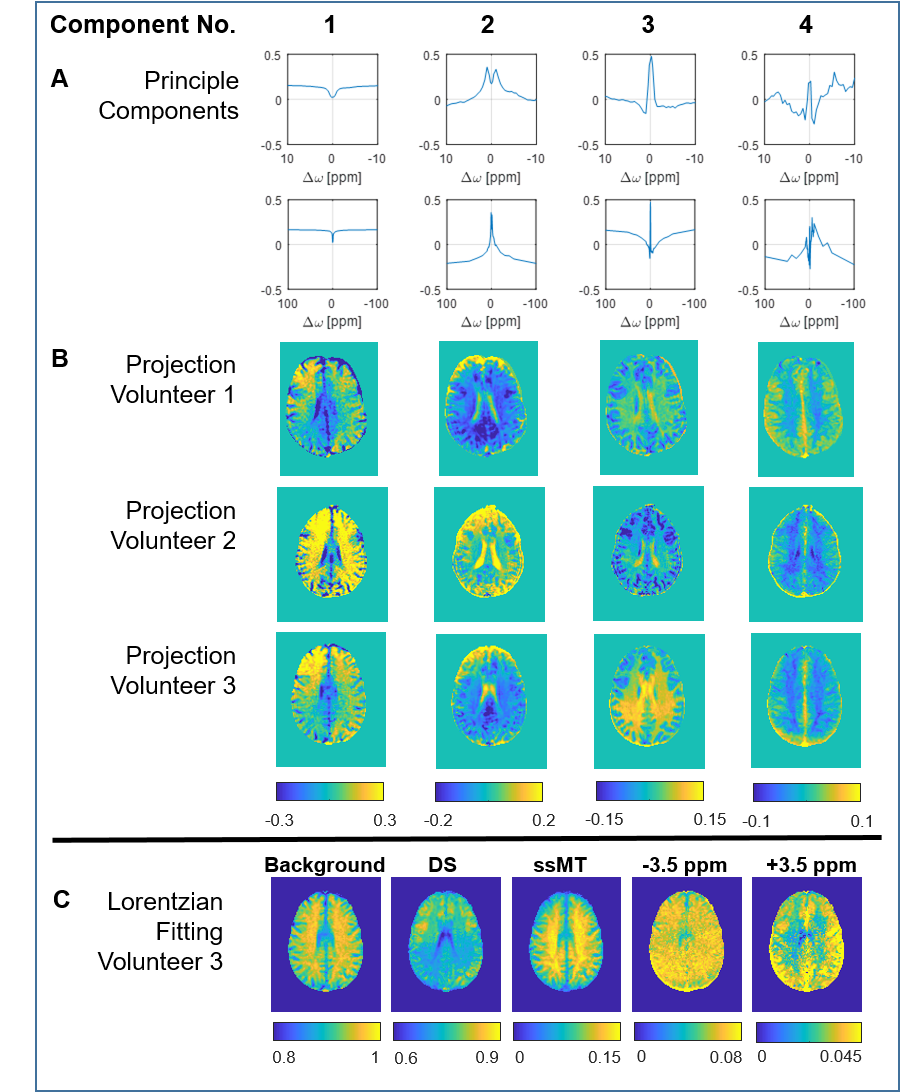
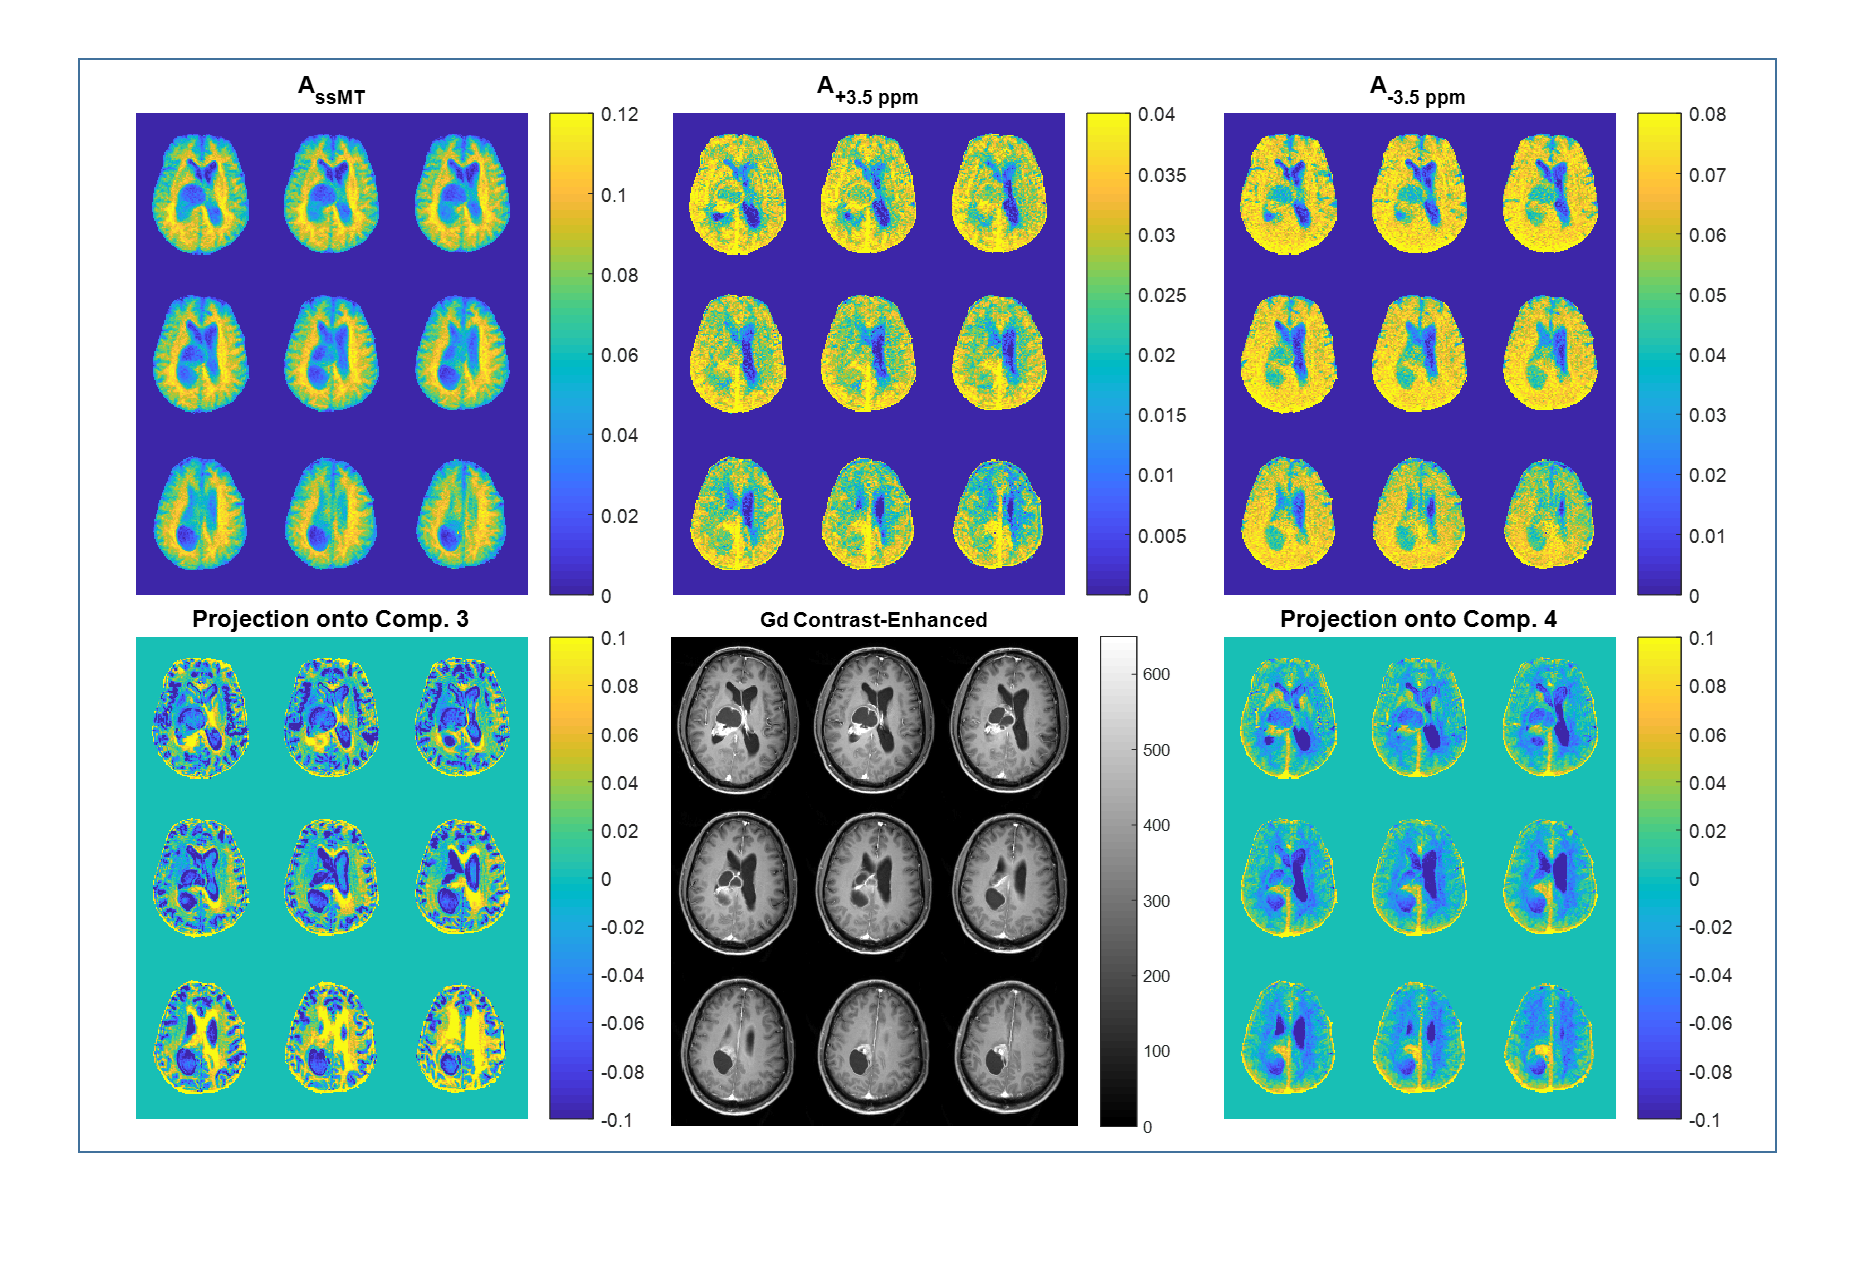
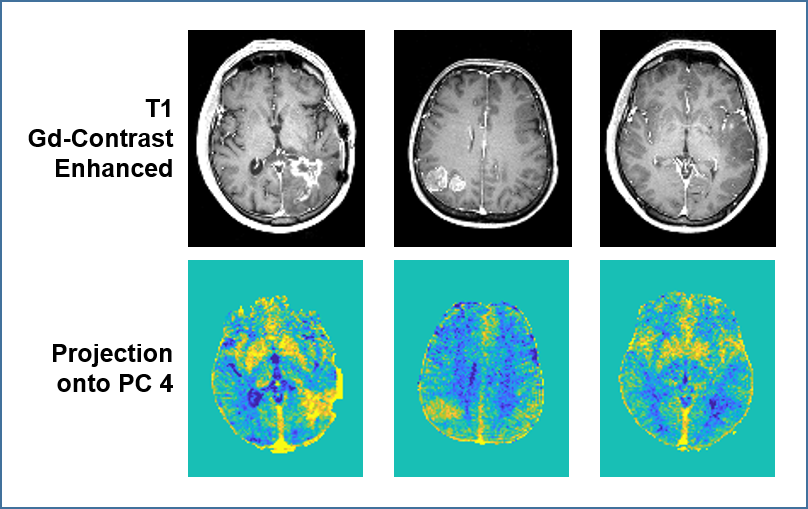
Figure 1A shows the first 4 PCs, and Figure 1B shows the coefficient maps from the projection of voxel Z-spectra onto each PC. While PC 1 correlates coarsely with the Z-spectrum baseline, and PC 2 depicts a direct water saturation mode, PCs 3 and 4 show more complex structures especially in the APT and NOE frequency ranges. These features are also observed in the coefficient maps. The PC 3 coefficients show gray/white matter contrast similar to those in Lorentzian-fitted NOE CEST and ssMT maps, while the PV 4 coefficients show similar contrast to amide CEST maps (Figure 1C). Figure 2 shows that application to brain tumor patient data (projection of Z-spectra onto the same PCs) shows hypo-intensities in necrotic areas in PC 3, again similar to NOE CEST and ssMT fitted contrasts. But PC 3 also depicts some features at tissue interfaces which we do not yet understand. Projection onto PC 4 strongly highlights some parts of the tumor that seem to correlate with the regions with strongest Gadolinium contrast uptake. Figure 3 illustrates that this feature of PC 4 appears consistently in tumors which exhibit Gadolinium enhancement, but does not appear in a non-enhancing tumor.Discussion
Rapid volumetric snapshot CEST imaging enables sampling of many frequency offsets in a clinically feasible scan time. The resulting datasets easily contain over 60,000 Z-spectra with high frequency resolution from 56 offsets sampled per spectrum; such ‘big CEST data’ paves the way for statistically-driven data processing methods such as machine learning approaches or, as shown here, principle component analysis. PCA and projections onto principle components reveal anatomically relevant contrasts, and are extremely fast computations compared to, for example, multi-Lorentzian fitting. The generated principle components themselves reveal combinations of features at various frequency offsets which differentiate Z-spectra in each tissue type relative to the mean Z-spectrum. The contrast from projection onto PC 4 is very similar to the published downfield NOE-suppressed amide CEST contrast (dnsAPT) [6], which was shown to correlate with Gadolinium uptake. Interestingly, dnsAPT also uses a mixture of NOE and amide signals to generate contrast, similar to the spectral features in PC4 shown in Figure 1A.Conclusion
Principle component analysis of Z-spectra is one possible model-free approach to investigate CEST contrasts. Projection onto the principle components can reveal relevant contrasts with correlations to normal anatomy and the presence of disease. Principle components themselves shed insight into which combination of resonances contribute relevant features in the Z-spectrum. The results encourage us to look for more features in CEST data with relevance for specific pathologies.Acknowledgements
Max Planck Society; German Research Foundation (DFG, grant ZA 814/2-1, support to KH,MS); European Union Horizon 2020 research and innovation programme (Grant Agreement No. 667510, support to MZ, AD).References
[1] Heo et al, MRM 75 (2016), pp. 1630-1639, http://doi.org/10.1002/mrm.25795
[2] Windschuh et al, NMR in Biomed. 28 (2015), pp.529-537, http://doi.org/10.1002/nbm.3283
[3] T. Jin, P. et al, MRM 69 (2013), pp. 760-770, http://doi.org/10.1002/mrm.24315
[4] Deshmane et al, “3D gradient echo snapshot chemical exchange saturation transfer MRI with low power saturation for clinical studies at 3T.” MRM in press; http://doi.org/10.1002/mrm.27569
[5] Breitling et al, “Denoising of Z-spectra for reliable CEST MRI using principal component analysis.” ISMRM 2019, submitted.
[6] Zaiss et al, MRM 77 (2017), pp. 196-208, http://doi.org/10.1002/mrm.26100
Figures