5001
Quantification of brain perfusion using dynamic glucose-enhanced MRI1Translational Radiation Oncology, National Center for Tumor Diseases (NCT), German Cancer Research Center (DKFZ), Heidelberg, Germany, 2Heidelberg Institute of Radiation Oncology (HIRO), National Center for Radiation Research in Oncology (NCRO), Heidelberg, Germany, 3Leibniz-Forschungsinstitut für Molekulare Pharmakologie, Berlin, Germany, 4Division of Medical Physics in Radiology, German Cancer Research Center (DKFZ), Heidelberg, Germany, 5Division of Medical Image Computing, German Cancer Research Center (DKFZ), Heidelberg, Germany, 6Division of Radiology, German Cancer Research Center (DKFZ), Heidelberg, Germany, 7Faculty of Physics and Astronomy, University of Heidelberg, Heidelberg, Germany, 8Faculty of Medicine, University of Heidelberg, Heidelberg, Germany
Synopsis
Dynamic glucose-enhanced (DGE) MRI was analyzed to derive quantitative parameters related to tissue perfusion, microvasculature and glucose uptake in the human brain. Adiabatically prepared T1ρ-weighted DGE-MRI was performed on seven healthy volunteers and one glioblastoma patient with a 7T scanner after administration of D-glucose. DGEρ time curves were investigated in different morphological structures of the healthy brain and in tumor tissue by extraction of semi-quantitative parameters and pharmacokinetic modelling using the extended Tofts model. Results show that application of semi-quantitative and pharmacokinetic modeling approaches for quantification of DGE-MRI is feasible in both healthy humans and brain tumor patients.
Purpose
Natural D-glucose is a promising new type of contrast agent, and feasibility of glucose-enhanced MRI for the detection of malignant brain tumors was recently demonstrated1,2. Studies indicate a major contribution of both blood-brain barrier leakage and tissue perfusion to the signal enhancement3. Hence, dynamic glucose-enhanced (DGE) MRI could be utilized to characterize tissue perfusion and permeability as well as glucose transport without application of gadolinium-based contrast agents or radioactive PET tracers. Therefore, DGE-MRI might allow studies on brain perfusion also in health subjects. In this work we used pharmacokinetic and non-compartmental analysis routinely applied in dynamic contrast-enhanced MRI to extract tissue specific perfusion-related parameters from DGEρ time curves in different regions of the brain.Methods
Retrospective
data of seven healthy volunteers and one glioblastoma patient, acquired in a
previous study, were analyzed2,4. DGE-MRI and high-resolution
non-enhanced T1-MPRAGE were acquired on a 7T MR scanner (Magnetom 7T, Siemens Healthineers). 100
mL of 20% D-glucose were administered over 2 minutes after a fasting period of 6-8 h. An
adiabatically prepared spin-lock pulse sequence (TE = 3.61 ms, TR = 23 ms, α=10°, 1.7
x 1.7 x 5 mm3 spatial resolution, Δt = 6 s, Taq = 20 min) was
used5. Data acquisition was performed using the previously reported T1ρ-weighted
DGE-MRI method4. DGEρ time
curves were calculated from T1ρ images as:
$$ DGEρ(t)=\frac{S_ {ref}-S(t)}{S_{ref}} \times 100\% $$
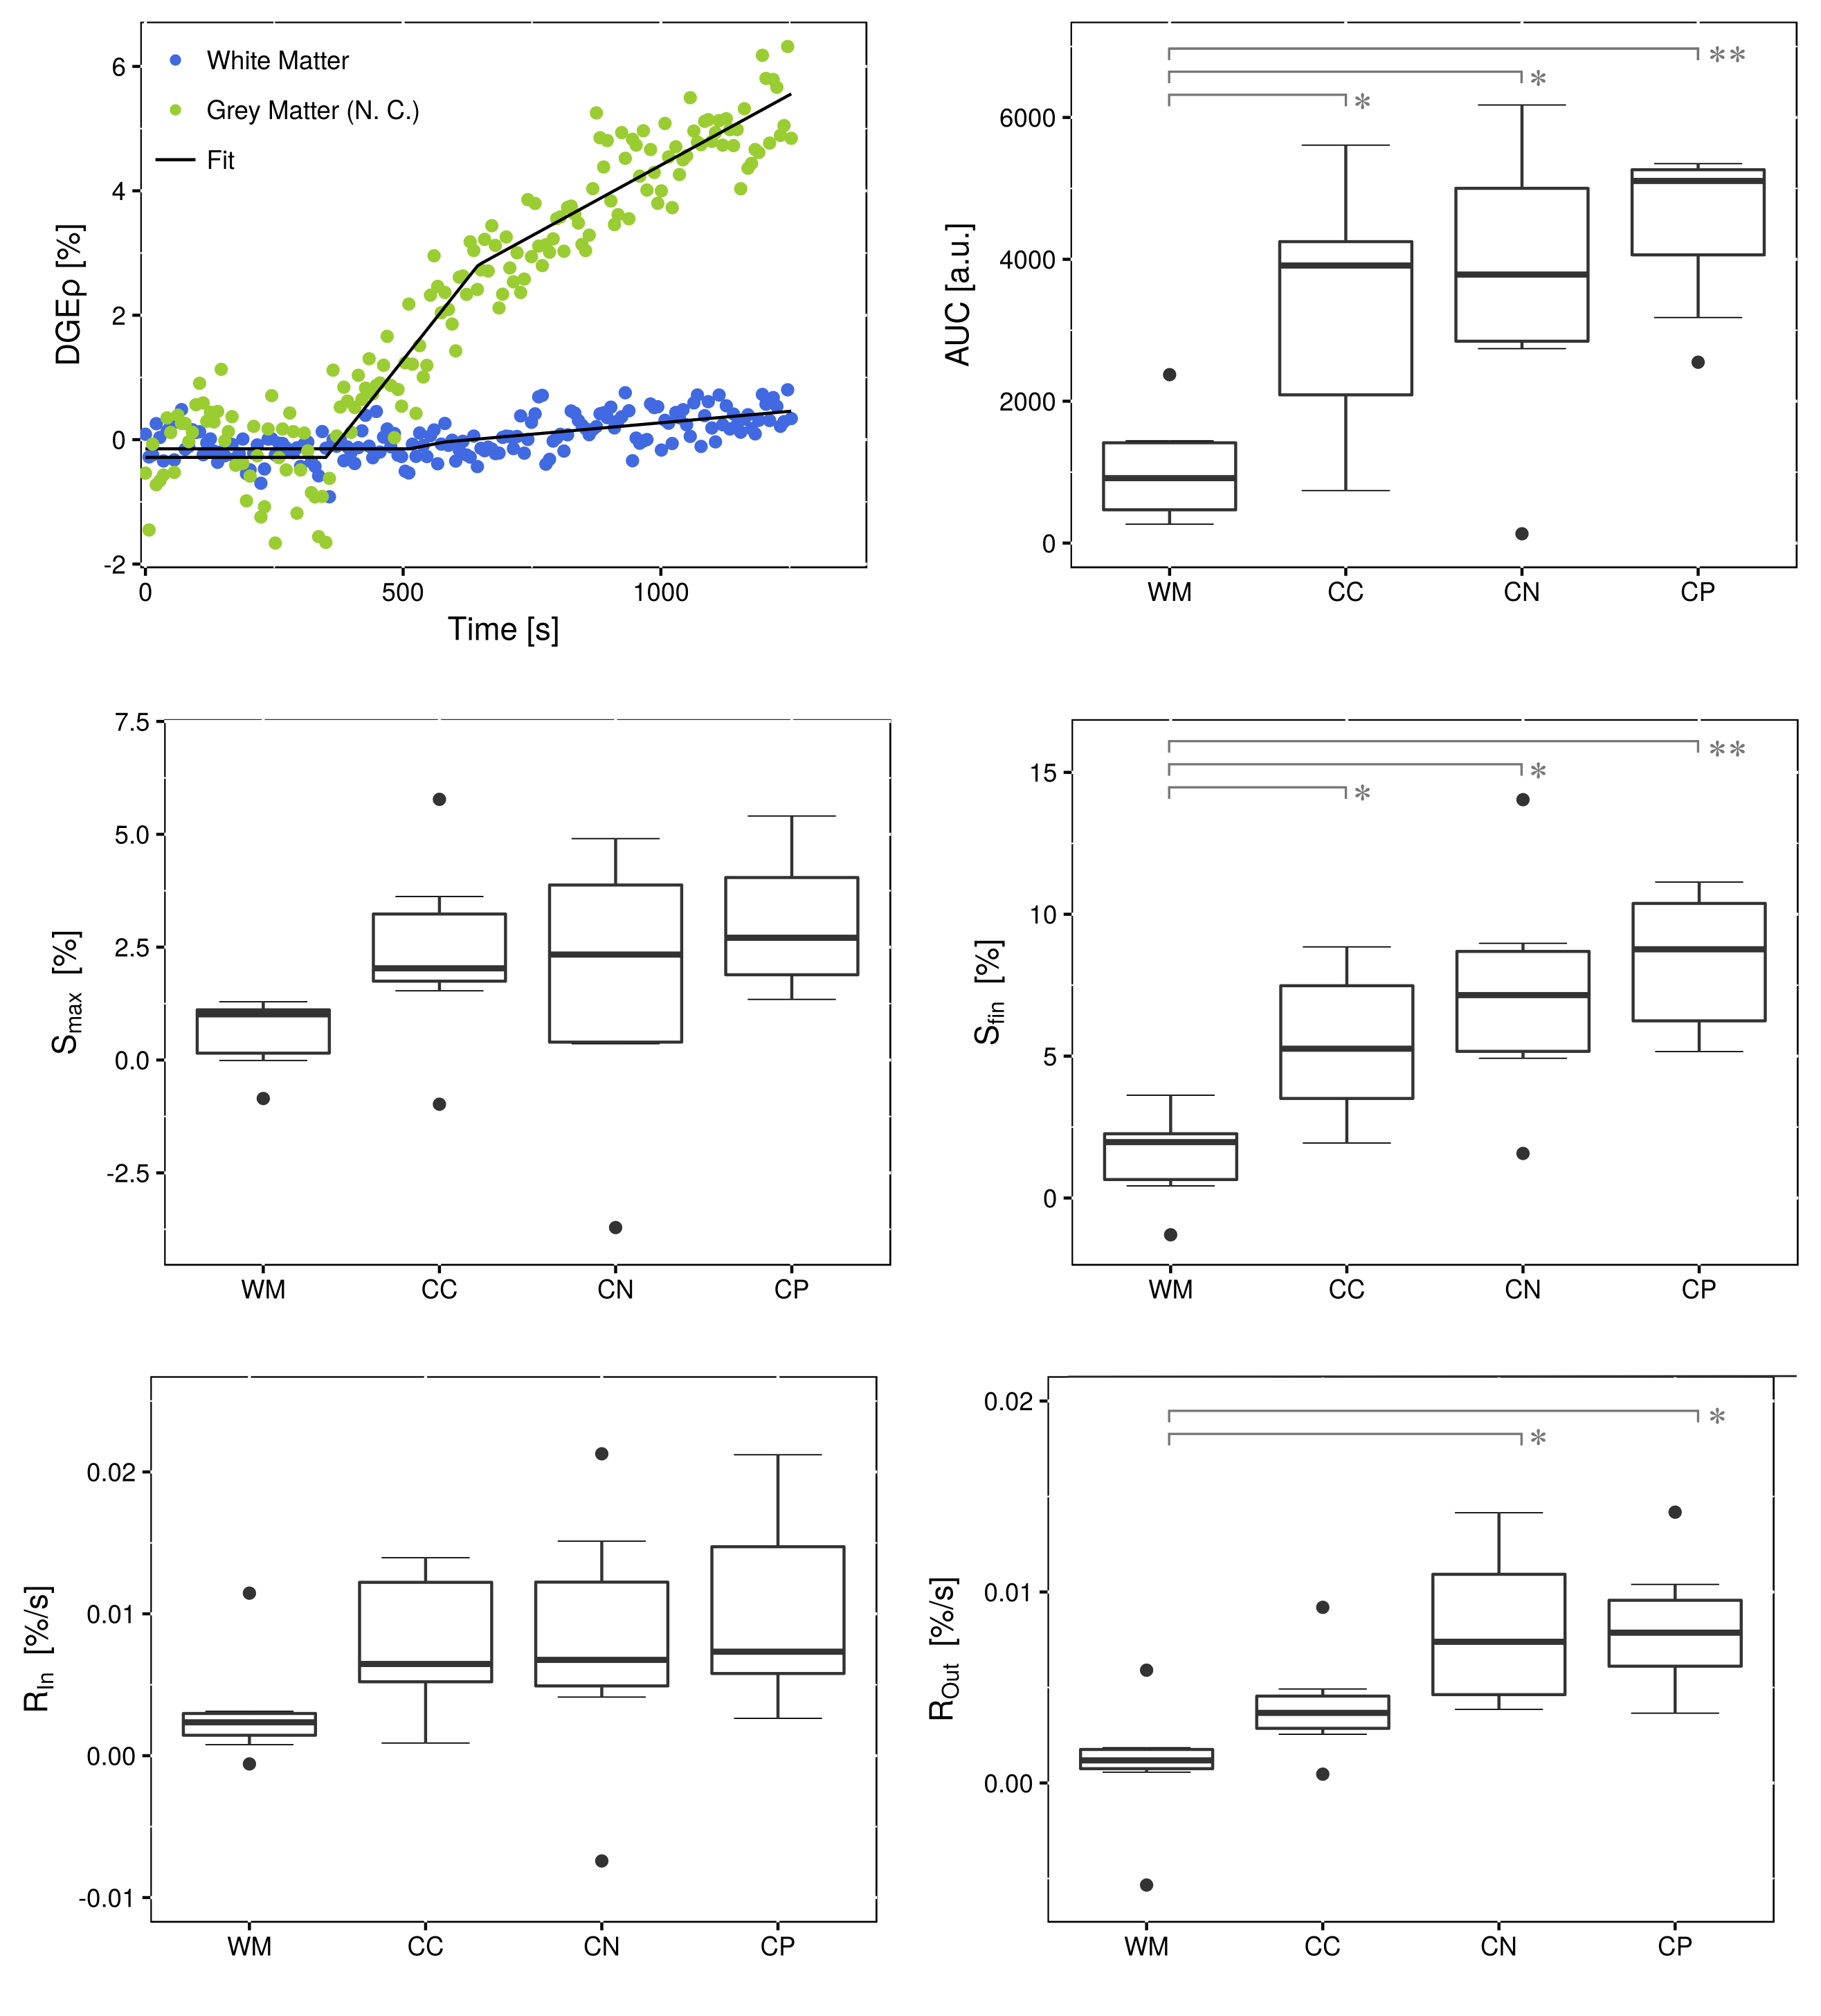
A
simple descriptive model that divides the curves into three linear segments was
applied to extract semi-quantitative parameters: area-under-the-curve ($$$AUC$$$),
time-to-peak ($$$TTP$$$), wash-in slope ($$$R_{in}$$$),
maximum ($$$S_{max}$$$), wash-out slope ($$$R_{out}$$$) and final concentration ($$$S_{fin}$$$).
These parameters were calculated on a
single-voxel basis for all subjects. Regions-of-interest (ROIs) were
segmented in the choroid plexus (CP), caudate
nucleus (CN), corpus callosum (CC) and non-enhancing white matter (WM)
and parameters were averaged within these structures.
For pharmacokinetic analysis of DGEρ time curves, the extended Tofts model6 was applied using the software MITK-ModelFit7. The arterial input function (AIF) was identified from regions of augmented maximum DGEρ values $$$S_{max}$$$ together with vascular structures on T1 images. Fits were conducted in CP, CC and CN, both voxel-wise (parameter maps) and ROI-based for quantification of perfusion parameters. For statistical analysis an ANOVA test was applied, following Dunnett post-hoc tests.
Results
Over all volunteers, significantly elevated values were found for $$$AUC$$$ (CN: p=0.0075, CP: p<0.001, CC: p=0.0247) and $$$S_{fin}$$$ (CN: p=0.0019, CP: p<0.001, CC: p=0.0334) when compared to WM (see Figure 1). $$$AUC$$$ is related to perfusion8, hence this result is plausible considering the high vascularization of these structures. DGE-MRI animal experiments have reported similar results for $$$S_{fin}$$$9. For $$$R_{out}$$$, significant differences with respect to WM were observed for CN (p=0.0021) and CP (p=0.0019).
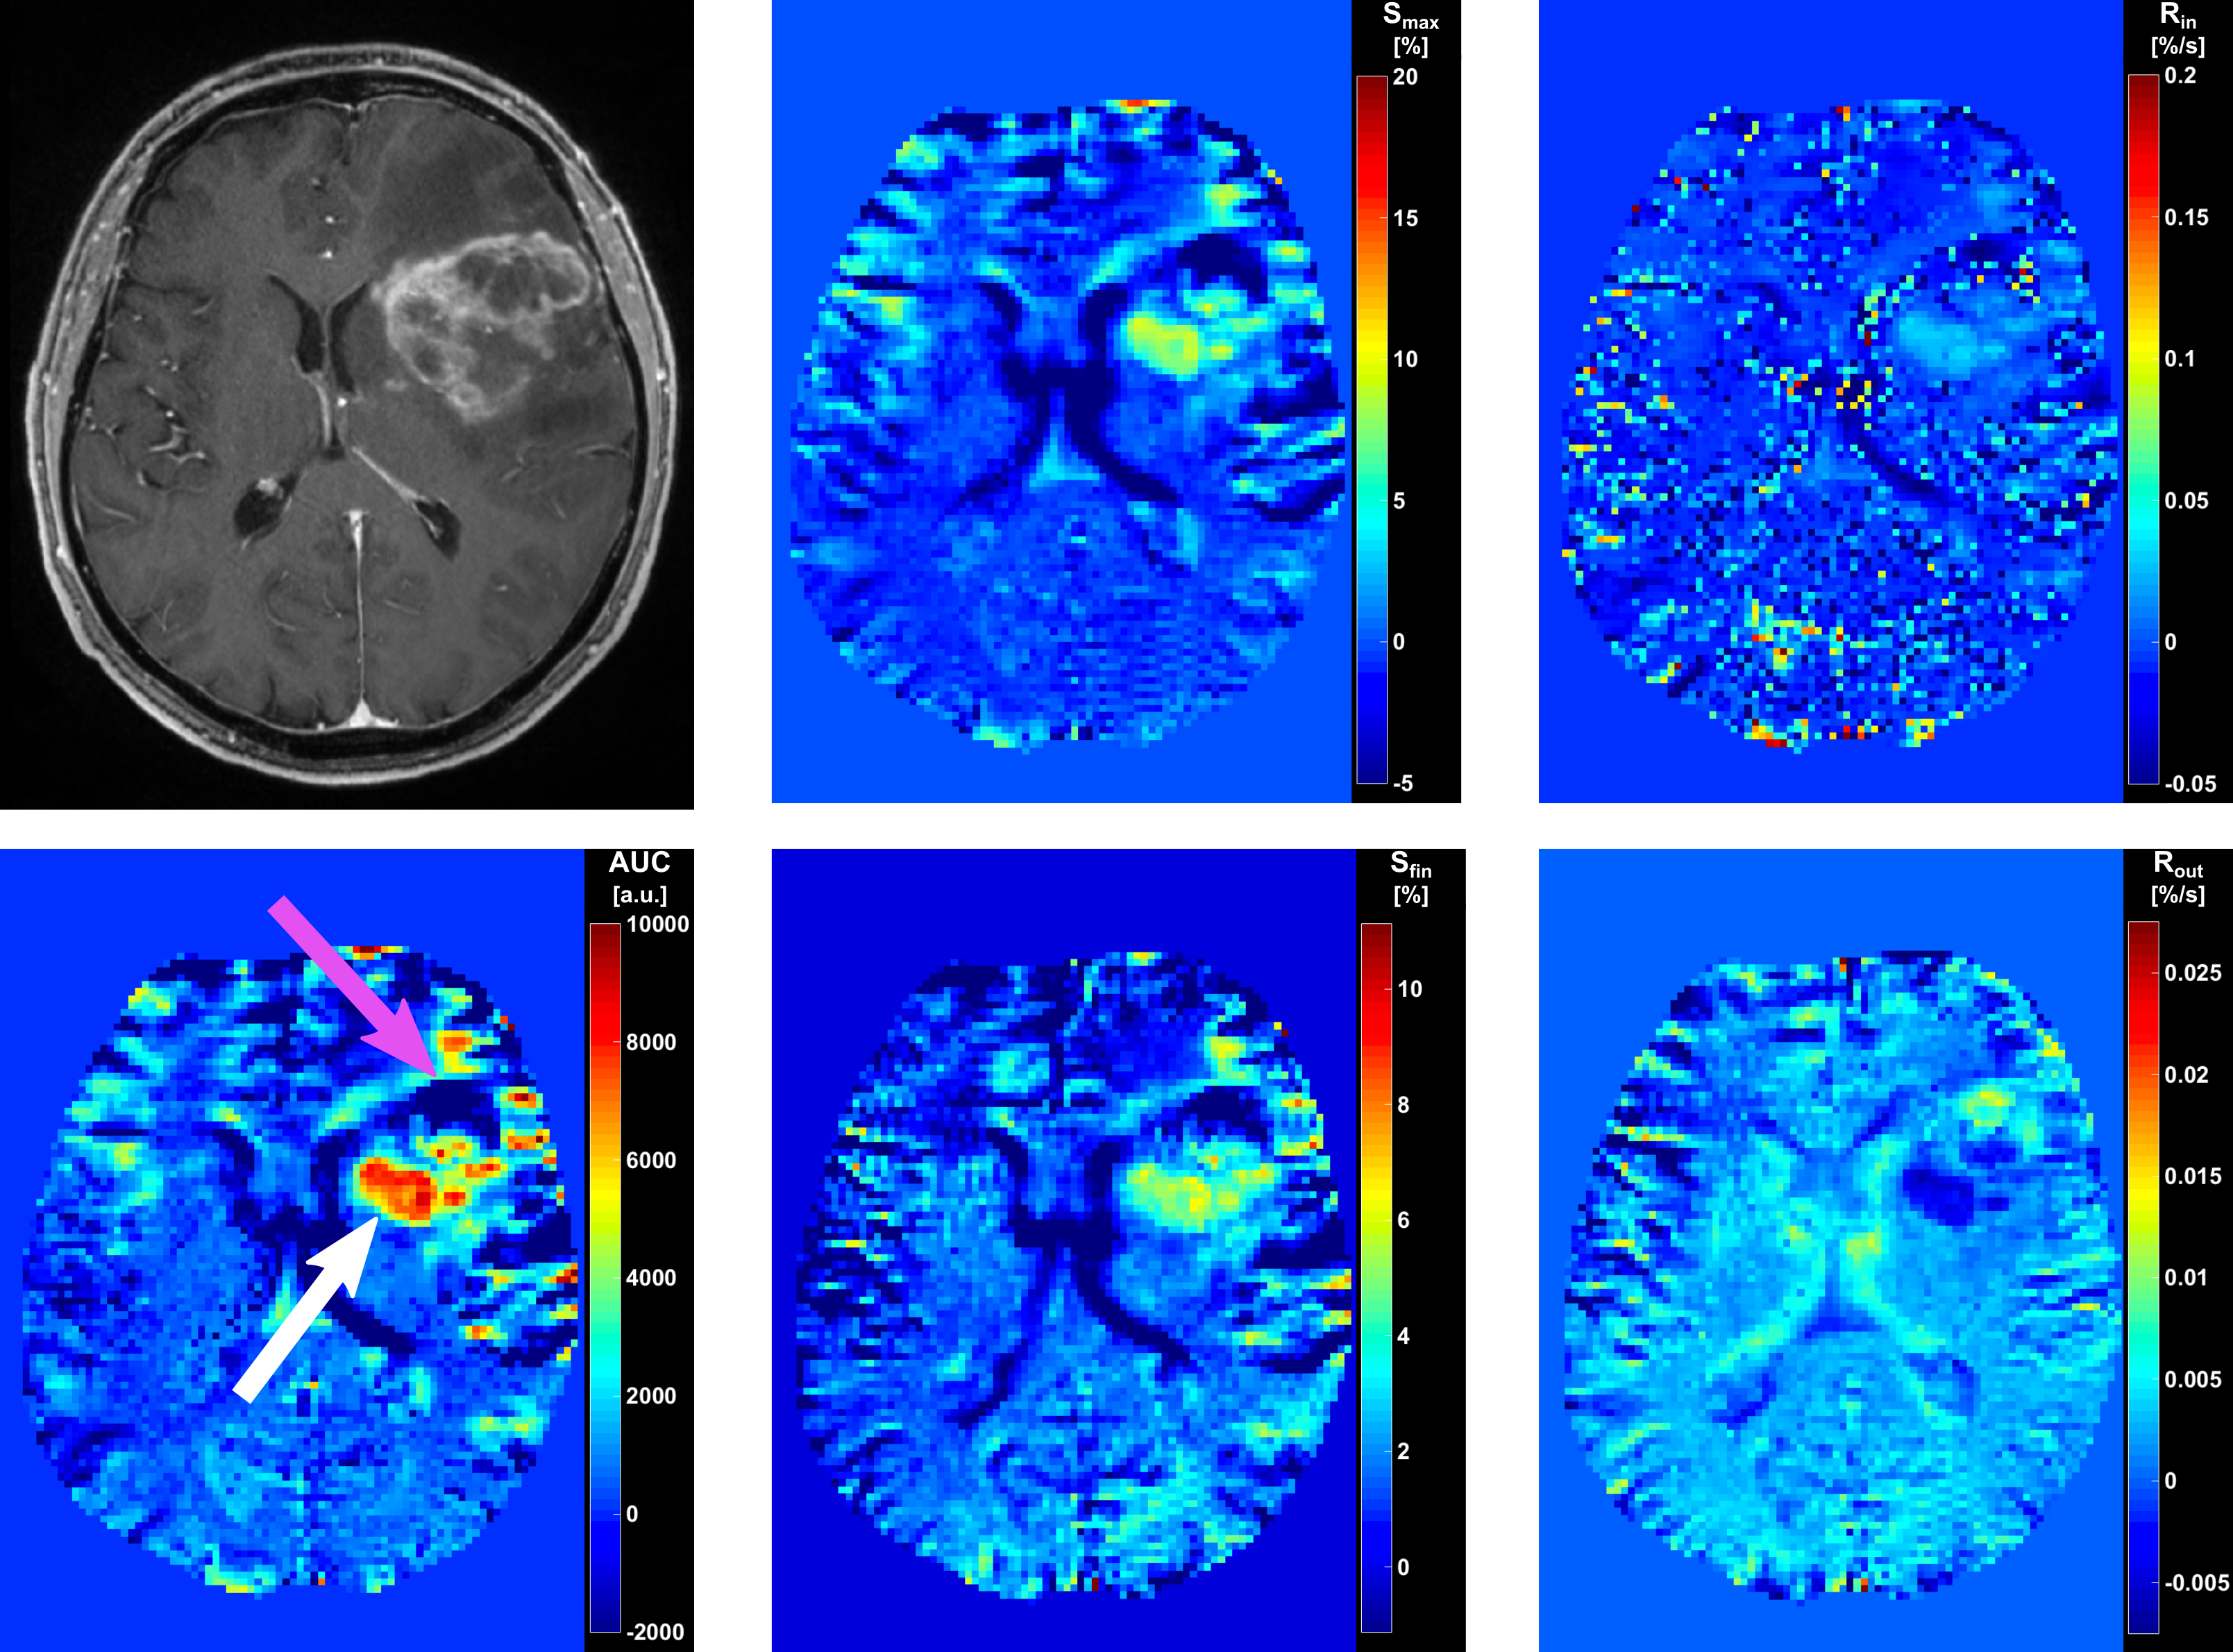
For the glioblastoma patient, visual assessment of parameter maps showed increased values within parts of the tumor on maps of parameters $$$AUC$$$, $$$TTP$$$, $$$R_{in}$$$, $$$S_{max}$$$, $$$R_{out}$$$ and $$$S_{fin}$$$ (Figure 2). The parameter maps allowed for identification of two sub-regions with opposite appearance: except for $$$R_{out}$$$, which showed inverse behavior, all parameters exhibited hyperintensities in the dorso-medial tumor region and hypointensities in the fronto-lateral region.
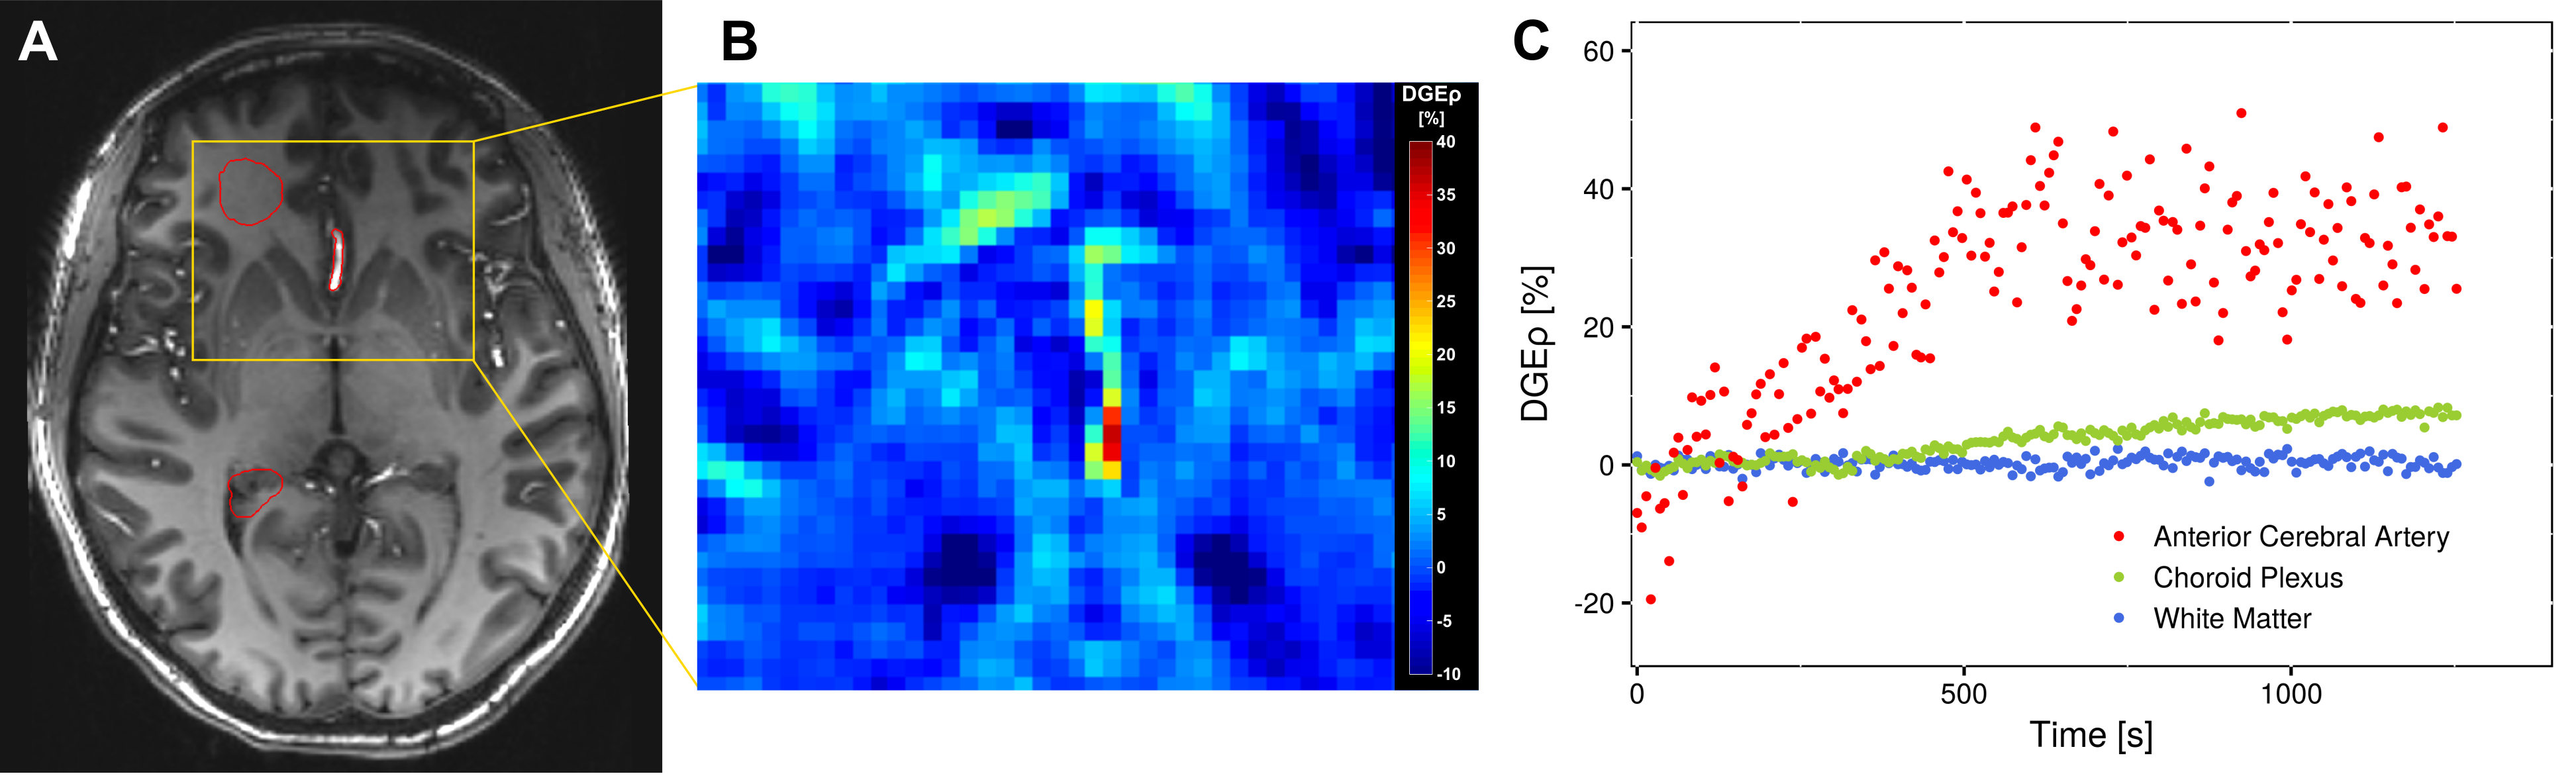
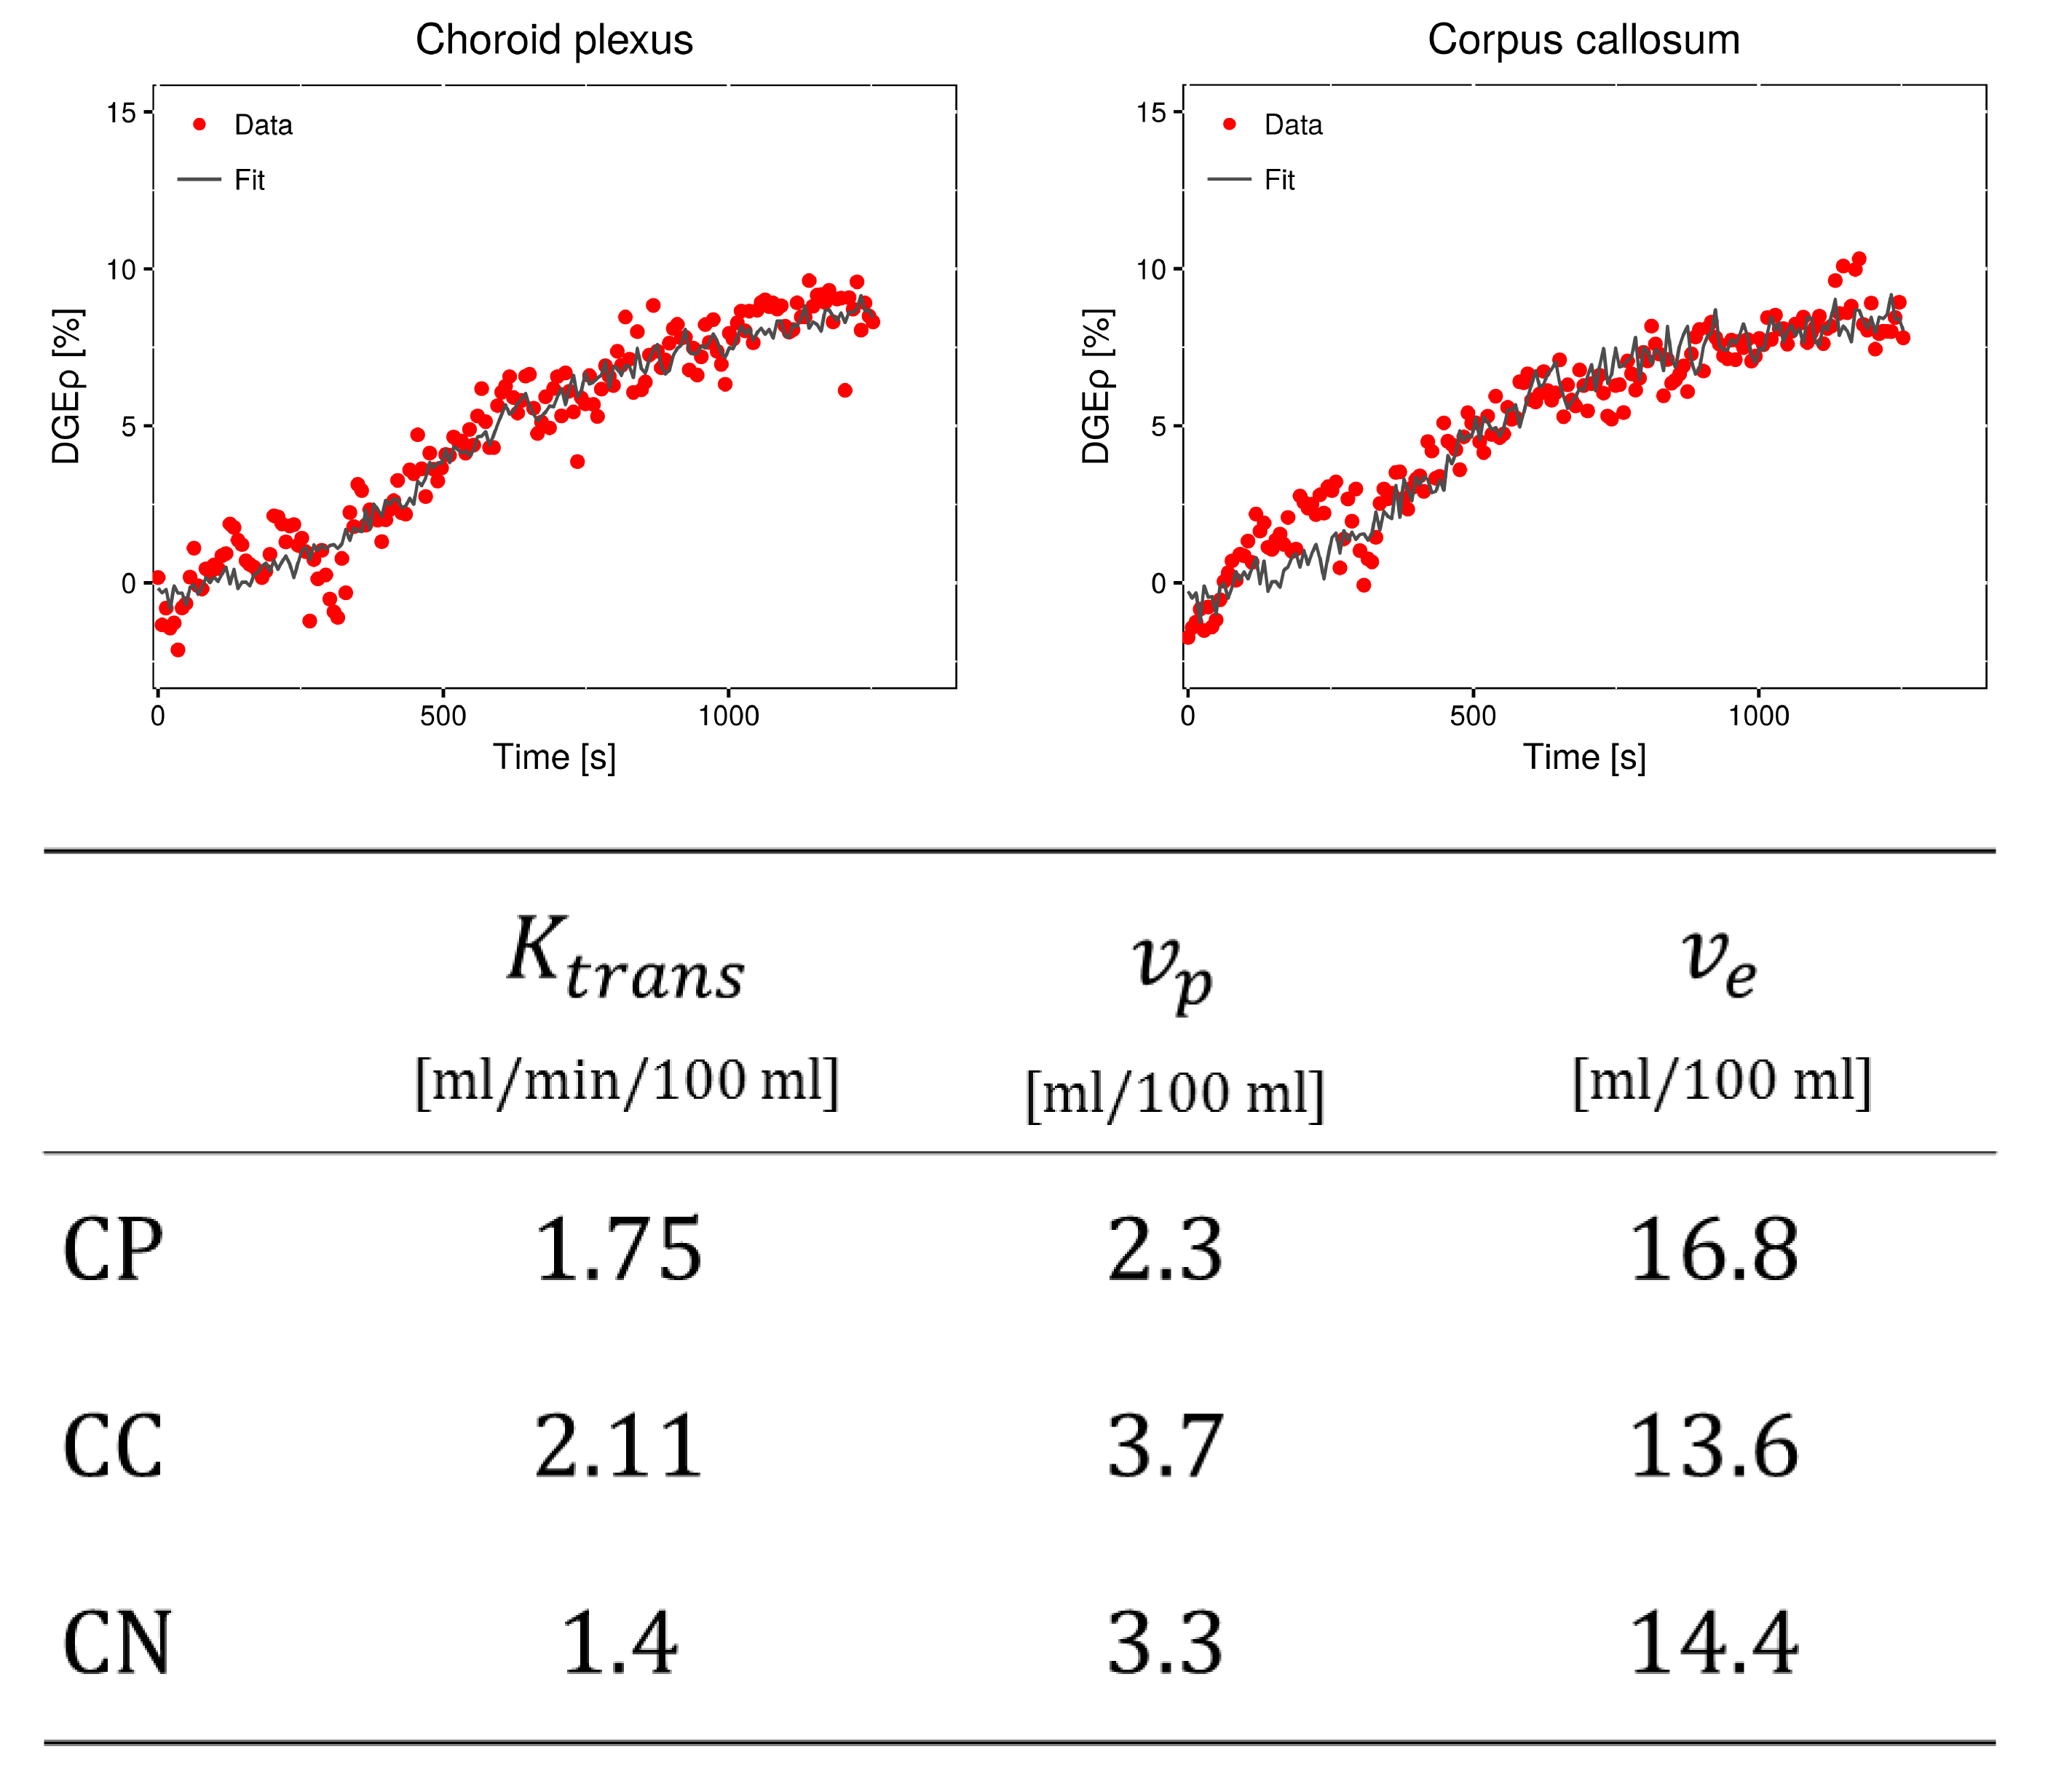
Furthermore, following glucose injection, in one volunteer substantially elevated DGEρ values were observed in the anterior cerebral artery (Figure 3). Using this signal as AIF, pharmacokinetic modelling by application of the extended Tofts model could be performed. Results from ROI-based fits in the CP, CN and CC are summarized in Figure 4. Values determined for $$$v_p$$$ and $$$K_{trans}$$$ were comparable to published values of 2 - 5 % for the blood volume10 and 0.3 - 1.6 ml/min/100 ml for the transfer constant11.
Conclusion
The presented study shows the feasibility of pharmacokinetic analysis of DGE-MRI data. It provides the first quantification of kinetics in DGE-MRI in different regions of the healthy human brain using a non-compartmental analysis approach and the first application of pharmacokinetic modelling to DGE-MRI time curves employing an image-based AIF. In healthy subjects significant differences in the determined semi-quantitative parameters were observed between different anatomical brain structures. Results show that besides the $$$AUC$$$, parameters describing the DGEρ time curve shape (e.g. $$$S_{max}$$$, $$$R_{out}$$$) can also be used to further characterize tumors and their tissue specific properties. The derived parameter maps might help to non-invasively study perfusion properties in the healthy brain and add valuable information for further characterization of brain tumors without the limitations set by conventional MRI contrast agents.Acknowledgements
References
1. Xu X, Yadav NN, Knutsson L, et al. Dynamic Glucose-Enhanced (DGE) MRI: Translation to Human Scanning and First Results in Glioma Patients. Tomogr. J. Imaging Res. 2015;1:105–114. doi: 10.18383/j.tom.2015.00175.
2. Paech D, Schuenke P, Koehler C, et al. T1ρ-weighted Dynamic Glucose-enhanced MR Imaging in the Human Brain. Radiology 2017;285:914–922. doi: 10.1148/radiol.2017162351.
3. Jin T, Iordanova B, Hitchens TK, et al. Chemical exchange–sensitive spin‐lock (CESL) MRI of glucose and analogs in brain tumors. Magn. Reson. Med. 2018,80: 488-495. doi: 10.1002/mrm.27183.
4. Schuenke P, Paech D, Koehler C, et al. Fast and Quantitative T1ρ-weighted Dynamic Glucose Enhanced MRI. Sci. Rep. 2017;7:42093. doi: 10.1038/srep42093.
5. Schuenke P, Koehler C, Korzowski A, et al. Adiabatically prepared spin-lock approach for T1ρ-based dynamic glucose enhanced MRI at ultrahigh fields. Magn. Reson. Med. 2016;78:215–225. doi: 10.1002/mrm.26370.
6. Tofts, PS. Modeling tracer kinetics in dynamic Gd‐DTPA MR imaging. J. Magn. Reson. Imaging 1997;7:91-101. doi: 10.1002/jmri.1880070113
7. Debus C, Floca R, Ingrisch M, et al. MITK-ModelFit: generic open-source framework for model fits and their exploration in medical imaging-design, implementation and application on the example of DCE-MRI. arXiv preprint 2018; arXiv:1807.07353.
8. O'connor J P, Jackson A, Parker G, et al. Dynamic contrast-enhanced MRI in clinical trials of antivascular therapies. Nat. Rev. Clin. Oncol. 2012;9:167-77. doi: 10.1038/nrclinonc.2012.2.
9. Jin T, Mehrens H, Wang P, et al. Glucose metabolism-weighted imaging with chemical exchange-sensitive MRI of 2-deoxyglucose (2DG) in brain: Sensitivity and biological sources. NeuroImage 2016;143:82–90. doi: 10.1016/j.neuroimage.2016.08.040.
10. Santarosa C, Castellano A, Conte GM, et al. Dynamic contrast-enhanced and dynamic susceptibility contrast perfusion MR imaging for glioma grading: Preliminary comparison of vessel compartment and permeability parameters using hotspot and histogram analysis. Eur. J. Radiol. 2016;85:1147–56. doi: 10.1016/j.ejrad.2016.03.020.
11. Heye AK, Culling RD, Valdés Hernández MDC, et al. Assessment of blood-brain barrier disruption using dynamic contrast-enhanced MRI. A systematic review. NeuroImage Clin. 2014;6:262–74. doi: 10.1016/j.nicl.2014.09.002.
Figures