5000
Does the MT Effect Bias CEST Effects? Quantifying CEST in the Presence of MT1Wellcome Centre for Integrative Neuroimaging, University of Oxford, Oxford, United Kingdom, 2Institute of Biomedical Engineering, Department of Engineering Sciences, University of Oxford, Oxford, United Kingdom, 3Vanderbilt University Institute of Imaging Sciences, Vanderbilt University, Nashville, TN, United States
Synopsis
Chemical exchange saturation transfer (CEST) is an MRI technique sensitive to the presence of low-concentration solute protons exchanging with water. However, magnetization transfer (MT) effects due to large macromolecules also exchange with water, and they can bias potential CEST effects if they are not correctly modelled. This study demonstrates that simultaneously modelling CEST and MT may yield incorrect estimates of CEST effects if an insufficient model is utilised. To prevent this, the MT effect should first be quantified outside the CEST domain and subsequently applied to CEST analyses.
Purpose:
Chemical exchange saturation transfer (CEST) is an MRI technique sensitive to the presence of low-concentration solute protons exchanging with water (e.g. amide protons in proteins). In a CEST experiment, these solute protons are saturated; this saturation is then transferred to water, causing a measurable signal attenuation. Other exchange processes – such as magnetization transfer (MT) effects from large macromolecular compounds, and nuclear Overhauser effects (NOE) – will also induce water signal reductions; thus, the resulting CEST spectrum is a convolution of many different competing exchange processes1.
MT is well-characterised at frequencies outside the CEST domain2–4, and has been used to quantify myelin5,6, tumours7, and muscle8. However, as the MT effect is also present in the CEST spectrum, it must be included to quantify the CEST effect. Currently, most CEST analyses either assume the MT effect is a symmetric, flat baseline shift over the CEST domain, or use a quantitative model to fit CEST and MT effects simultaneously9,10. However, because the MT linewidth is so broad that all data contributes to the parameter estimation, simultaneously modelling MT and CEST effects will introduce biases into the analysis. This study demonstrates that simultaneously modelling CEST and MT may yield incorrect estimates of CEST effects if an insufficient model is utilised. To prevent this, the MT effect should first be quantified outside the CEST domain and subsequently applied to CEST analyses. We demonstrate MT effect bias in vivo and CEST effect bias in simulation.
Methods:
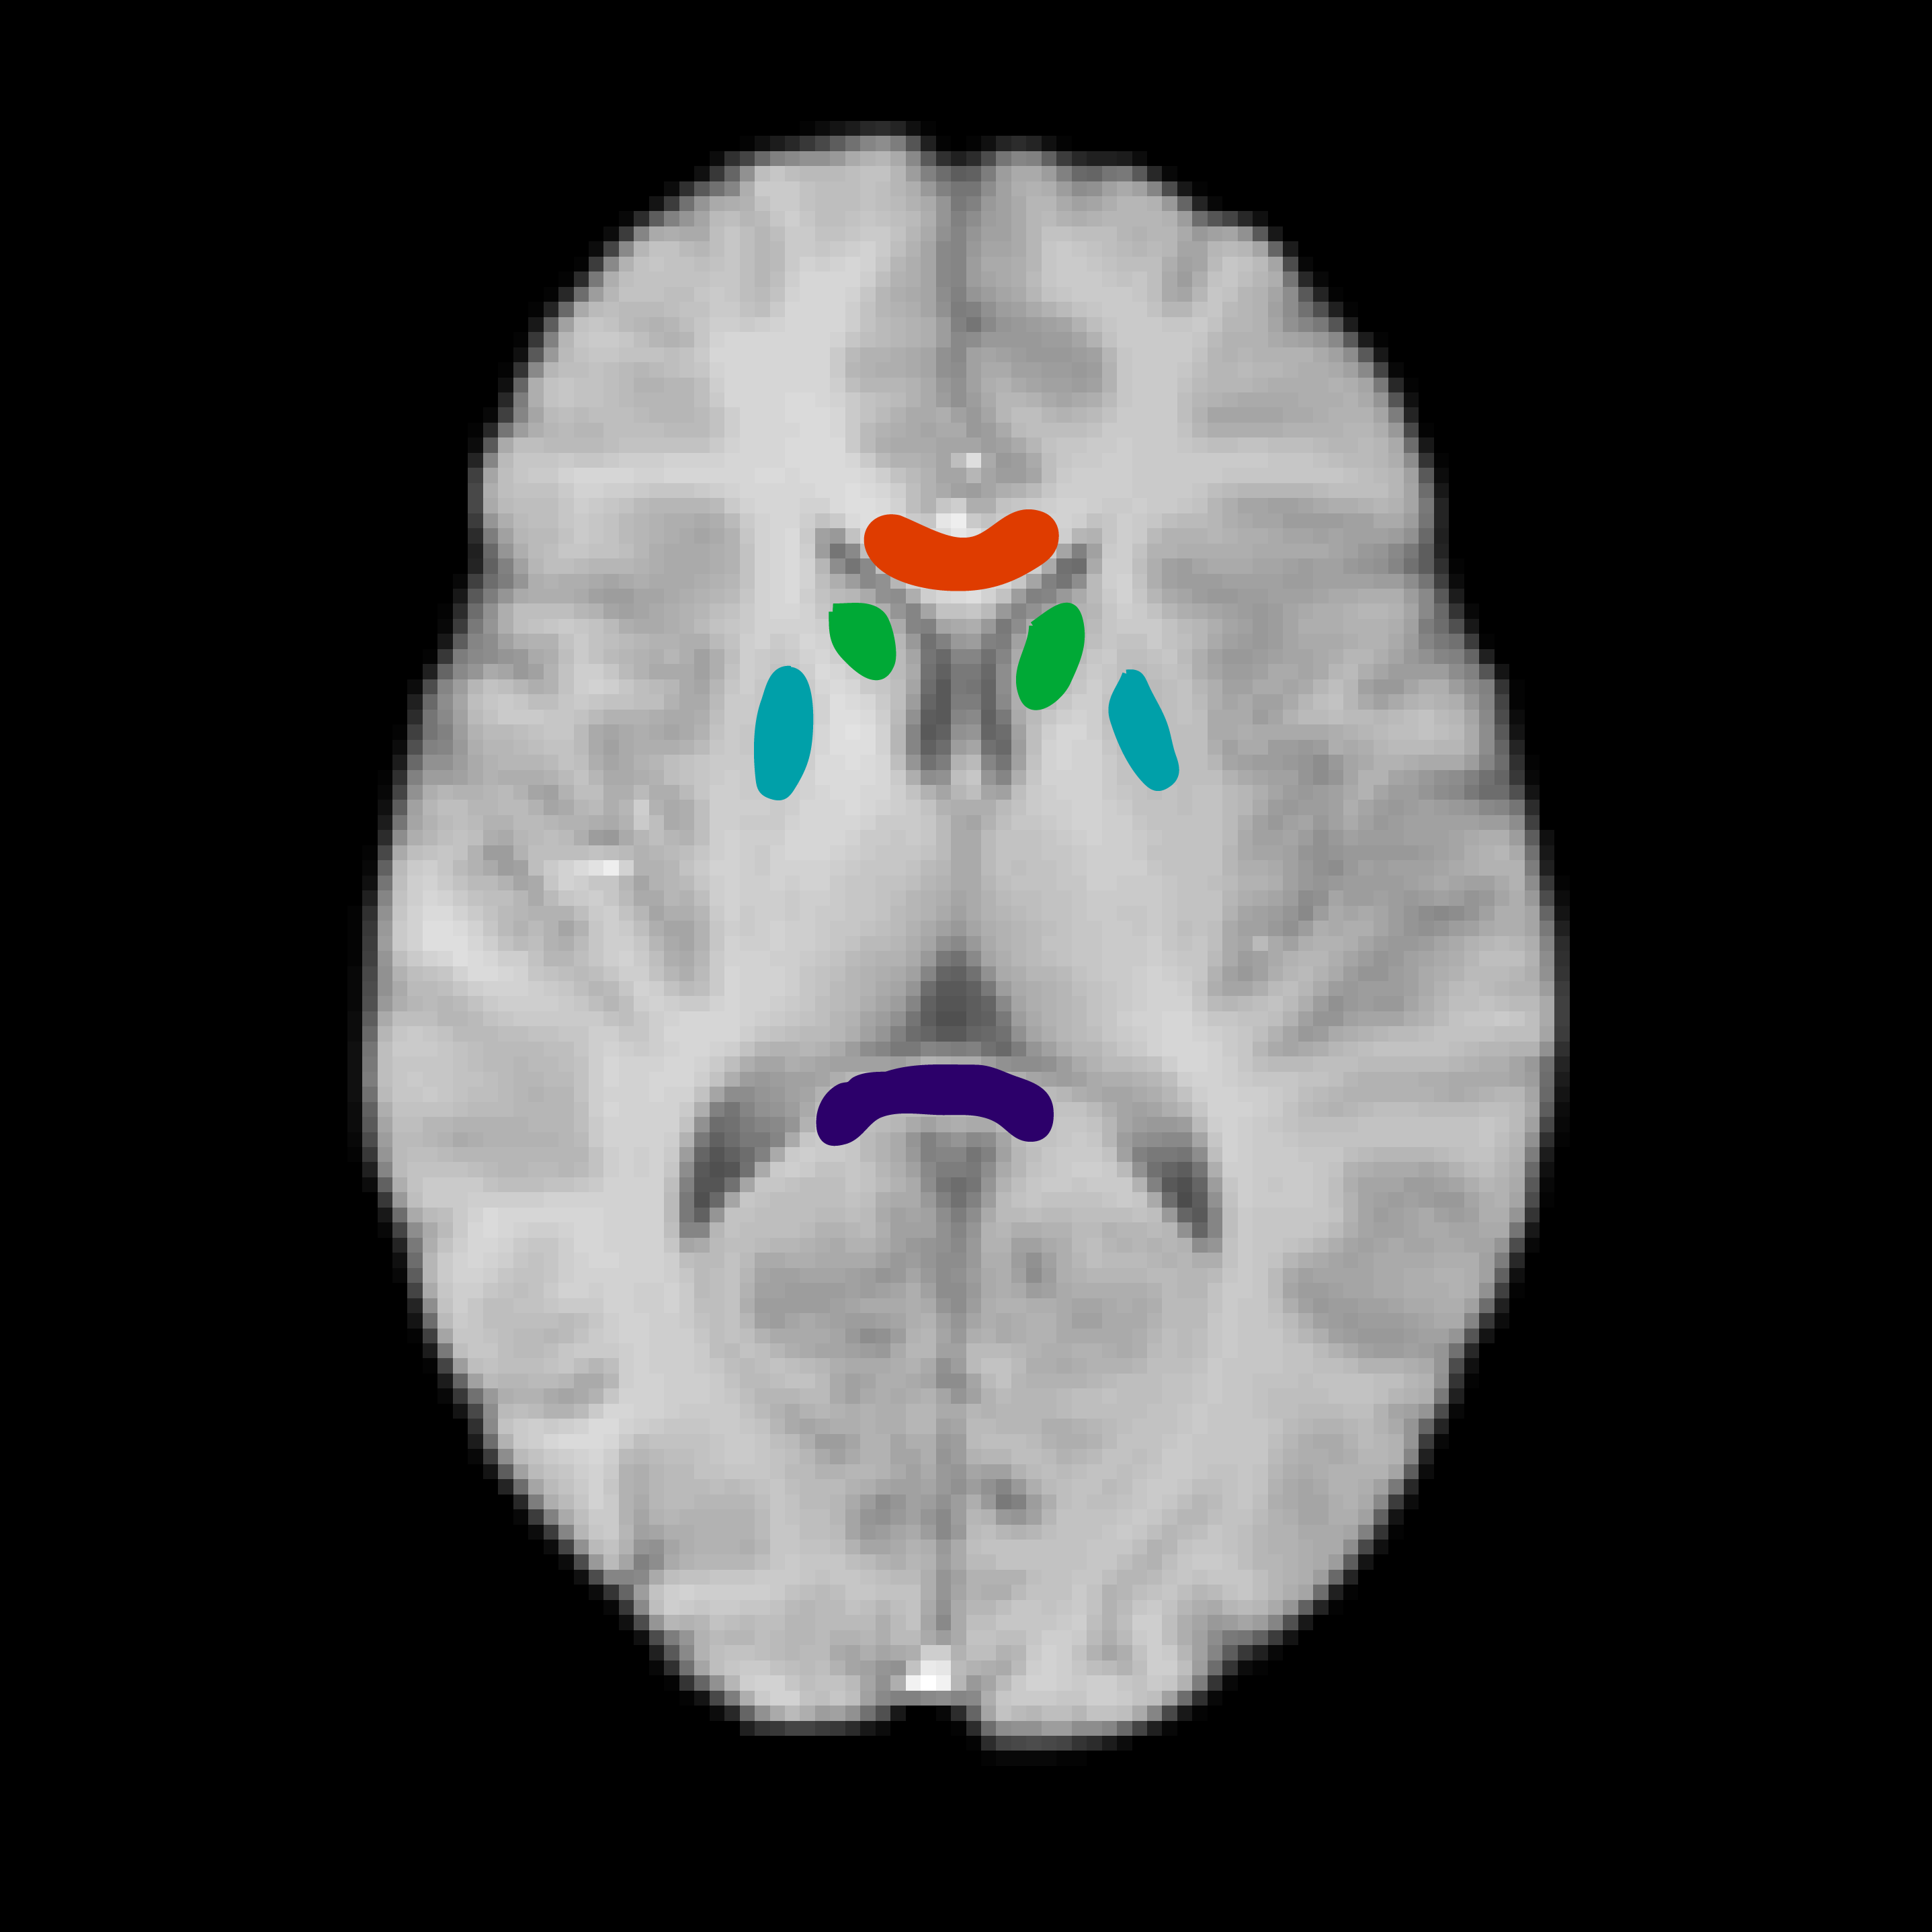
Nine healthy volunteers (age: 31.8±7.4, 4F) were imaged on a 3T Siemens Verio MRI scanner (Erlangen, Germany). The CEST acquisition consisted of a CEST pulse train with a 2D centre-out FLASH readout11. The CEST pulse consisted of a train of: 50, 20-ms pulses, FA=184°, 50% duty cycle; at 41 frequency offsets sampled asymmetrically between ±4.5-ppm to cover the amide resonance. Additional offsets at 7.5, 15, 30, 60, and 100-ppm were acquired to sample the MT spectrum, using the same saturation pulse but with FA=540°. T1 and B1+ maps were also collected, with the variable flip angle, and DREAM12 sequences, respectively. To determine the MT quantification bias of unaccounted for CEST effects, the full CEST+MT dataset was analysed using a two-pool model with Bayesian inference10 (Water, MT offset by -2.41-ppm with a Super-Lorentzian lineshape13), followed by the recursive removal of 20 random CEST frequency offsets until only MT frequency data was left, representing a quantitative MT (qMT) acquisition. Parameter estimates of the macromolecular-to-free pool size ratio (PSR) were compared by taking ROIs in the genu, splenium, thalamus, and caudate (Fig. 1). The Wilcoxon rank-sum test was performed on each ROI to statistically compare the PSR derived from the qMT acquisition with each of the CEST+qMT acquisitions. Finally, to demonstrate that these effects are not limited to the MT pool, simulations were performed to compare the effect of fitting a three-pool model to a spectrum with unaccounted-for CEST pools (simulation parameters listed in Fig. 5).Results and Discussion:
The bias introduced by unmodeled CEST data into the MT effect is demonstrated in Figure 2. The qMT-only data (Fig. 2a) was comparable with literature PSR estimates14,15; when CEST data were included (Fig. 2b-c), the estimated PSR increased. As CEST data was removed, the PSR returned to values similar to those seen in qMT-only analysis in Figure 2a. This effect was further captured using ROI analysis (Figs. 3-4). Statistically significant (p < 0.05) increases in PSR were seen between the different analysis methods until almost all CEST data was removed.
Figure 5 demonstrates the bias of fitting an incomplete CEST model to simulated CEST data. Due to the nature of the MT effect, the model minimised unmodeled CEST effects by increasing the PSR. The actual PSR was 20%, however, the fitted PSR was 21.75%. Additionally, the amide CEST effect was estimated as 0.25%, compared to its actual value of 0.5%, demonstrating that these biases are not isolated to the MT effect alone.
Conclusions:
These results indicate that current practices9,10,16 of simultaneously fitting both CEST and MT effects in a model-based analysis can lead to significant bias in all parameter estimates unless a sufficiently complex model is utilised. The broad linewidth of the MT effect absorbs any unmodeled exchange processes as increased PSR, leading to underestimation in modelled CEST effects and overestimation of PSR. Therefore, care must be taken when modelling CEST and MT effects in vivo by either fitting MT data separately, then propagating these estimates into the CEST analysis, or by employing a sufficiently complex model that minimises these biases.Acknowledgements
Funding provided by: Whitaker International Program Fellowship, and St. Hilda’s College Junior Research Fellowship. The Wellcome Centre for Integrative Neuroimaging is supported by core funding from the Wellcome Trust (203139/Z/16/Z).References
1. Desmond, K. L. & Stanisz, G. J. Understanding quantitative pulsed CEST in the presence of MT. Magn. Reson. Med. 67,979–990 (2012).
2. Henkelman, R. M. et al. Quantitative interpretation of magnetization transfer. Magn Reson Med. 29,759–766 (1993).
3. Sled, J. G. & Pike, G. B. Quantitative Interpretation of Magnetization Transfer in Spoiled Gradient Echo MRI Sequences. J. Magn. Reson.145,24–36 (2000).
4. Morrison, C., Stanisz, G. & Henkelman, R. M. Modeling Magnetization Transfer for Biological-like Systems Using a Semi-solid Pool with a Super-Lorentzian Lineshape and Dipolar Reservoir. J. Magn. Reson. Ser. B108,103–113 (1995).
5. Trujillo, P. et al. Pool size ratio of the substantia nigra in Parkinson’s disease derived from two different quantitative magnetization transfer approaches. Neuroradiology 59,1251–1263 (2017).
6. Smith, A. K. et al. Evaluating single-point quantitative magnetization transfer in the cervical spinal cord: Application to multiple sclerosis. NeuroImage Clin. 16,58–65 (2017).
7. Mehrabian, H., Lam, W. W., Myrehaug, S., Sahgal, A. & Stanisz, G. J. Glioblastoma (GBM) effects on quantitative MRI of contralateral normal appearing white matter. J. Neurooncol.1–10 (2018). doi:10.1007/s11060-018-2846-0
8. Li, K. et al. A rapid approach for quantitative magnetization transfer imaging in thigh muscles using the pulsed saturation method. Magn. Reson. Imaging 33,709–717 (2015).
9. Tee, Y. K., Donahue, M. J., Harston, G. W. J., Payne, S. J. & Chappell, M. A. Quantification of amide proton transfer effect pre-And post-gadolinium contrast agent administration. J. Magn. Reson. Imaging 40,832–838 (2013).
10. Chappell, M. A. et al. Quantitative Bayesian model-based analysis of amide proton transfer MRI. Magn. Reson. Med. 70,556–567 (2013).
11. Schmitt, B., Zaiß, M., Zhou, J. & Bachert, P. Optimization of pulse train presaturation for CEST imaging in clinical scanners. Magn. Reson. Med. 65,1620–1629 (2011).
12. Brenner, D. et al. 3DREAM – a Three-Dimensional Variant of the DREAM Sequence. in Proceedings of the Joint Annual Meeting of the ISMRM-ESMRMB (2014).
13. Morrison, C. & Mark Henkelman, R. A Model for Magnetization Transfer in Tissues. Magn. Reson. Med. 33,475–482 (1995).
14. Dortch, R. D., Bagnato, F., Gochberg, D. F., Gore, J. C. & Smith, S. A. Optimization of selective inversion recovery magnetization transfer imaging for macromolecular content mapping in the human brain. Magn. Reson. Med.(2018). doi:10.1002/mrm.27174
15. Yarnykh, V. L. et al. Fast Whole-Brain Three-dimensional Macromolecular Proton Fraction Mapping in Multiple Sclerosis. Radiology274,210–220 (2015).
16. Harston, G. W. J. et al. Identifying the ischaemic penumbra using pH-weighted magnetic resonance imaging. Brain 138,36–42 (2015).
17. van Zijl, P. C. M., Lam, W. W., Xu, J., Knutsson, L. & Stanisz, G. J. Magnetization Transfer Contrast and Chemical Exchange Saturation Transfer MRI. Features and analysis of the field-dependent saturation spectrum. Neuroimage 168,222–241 (2018).
Figures