4999
Dynamic Glucose Enhanced Imaging at 3T: Effects of Physiological Changes and Motion1Russell H. Morgan Department of Radiology and Radiological Science, Johns Hopkins University, Baltimore, MD, United States, 2F.M. Kirby Research Center for Functional Brain Imaging, Kennedy Krieger Research Institute, Baltimore, MD, United States, 3Department of Medical Radiation Physics, Lund University, Lund, Sweden, 4High-field Magnetic Resonance Center, Max Planck Institute for Biological Cybernetics, Tubingen, Germany
Synopsis
Dynamic glucose enhanced (DGE) MRI has shown potential for imaging D-glucose delivery and brain uptake at fields of 7T and higher. Here we evaluate some issues involved with translating DGE MRI to the clinical field strength of 3T. Due to the reduced effect size subject motion becomes more confounding than at 7T, possibly producing artifacts in terms of dynamic signal changes that are beyond the magnitude of the actual effect size. On the other hand, physiological changes such as ventricular swelling and vascular dilatation may appear as motion to the motion correction procedure, possibly leading to unintended overcorrection.
Introduction
Recently, promising results have been published for using D-Glucose1,2 and glucose analogues3-6 as biodegradable contrast agents for MRI. Dynamic glucose enhanced (DGE) imaging has been performed in animals 7-9 and in humans10-13. To be relevant in daily clinical practice, it is necessary to develop DGE at lower field strengths. Using Bloch-McConnel simulations for 10 mM D-Glucose increase, we estimated the DGE effect size at 3T to be 0.5%-2% at an offset of 2 ppm, depending on the type of tissue involved. Subject motion, either involuntary or due to subject physical response to the infusion procedure and blood draws, can lead to severe artifacts in the dynamic glucose difference images, especially at tissue interfaces. These artifacts may cause signal changes that are beyond the magnitude of the actual effect size.14 Therefore there is a possibility that they will be mistaken for true glucose effects. Here, we analyze the effect of subject movement in DGE images and perform retrospective motion correction to improve glucoCEST imaging.Methods
Written consent was obtained from all participants. A brief hyperglycemic state was established by intravenous infusion of D50 Dextrose over 2 minutes. Venous glucose level was monitored periodically (IV line). GlucoCEST imaging was performed on 3T Philips MRI scanner (Elition R5.4, Philips Healthcare) at 2 ppm offset from water using B1 of 1.6 μT for 1 s and a multishot 3D TSE sequence with TR/TE/FA of 3.5s/6.1ms/90°. 15 slices (4.4 mm each) and in-plane resolution of 3.3x3.3 mm2 were acquired.
Motion correction: Image realignment was performed using SPM1215. The first images acquired without saturation were removed from the series and the 2nd image with saturation was chosen as reference. All images were first aligned to the reference image, then a mean image was calculated and each dynamic image was aligned to the mean image using rigid body transformation. A 4 mm (FWHM) Gaussian smoothing kernel was applied and interpolation/re-slicing was done with 4th degree B-spline. We repeated this realignment process twice to refine the motion correction results.
Results
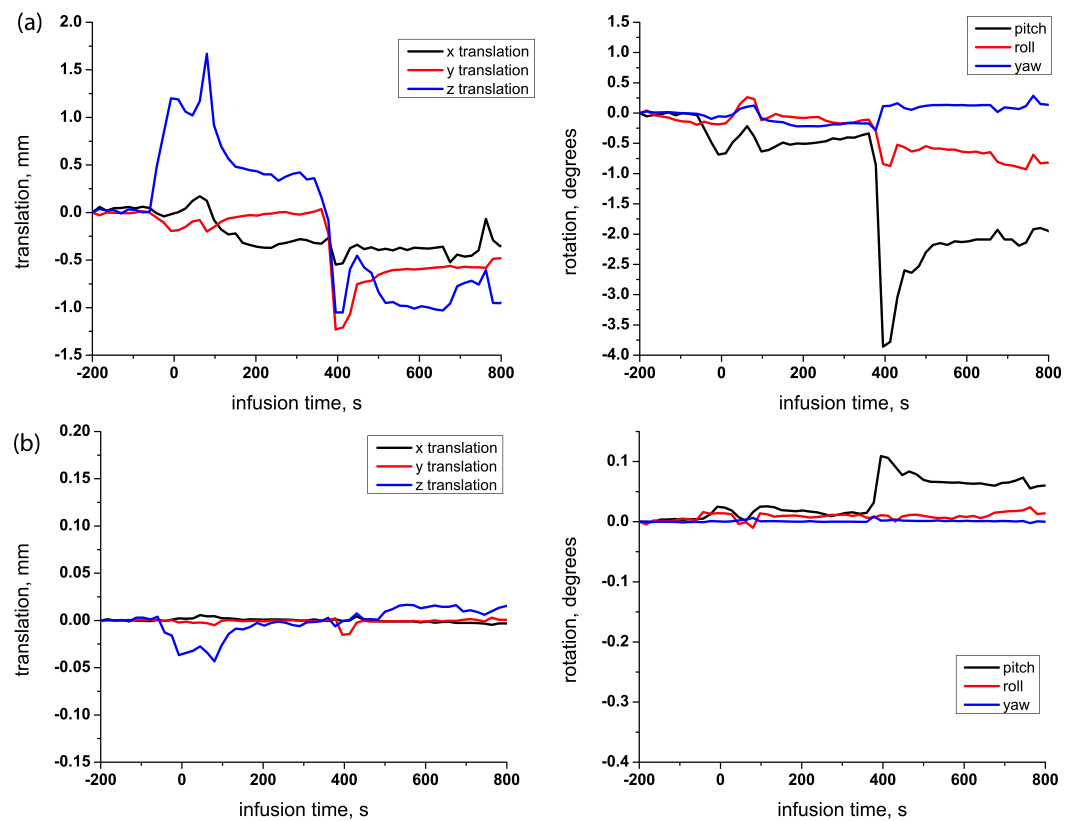
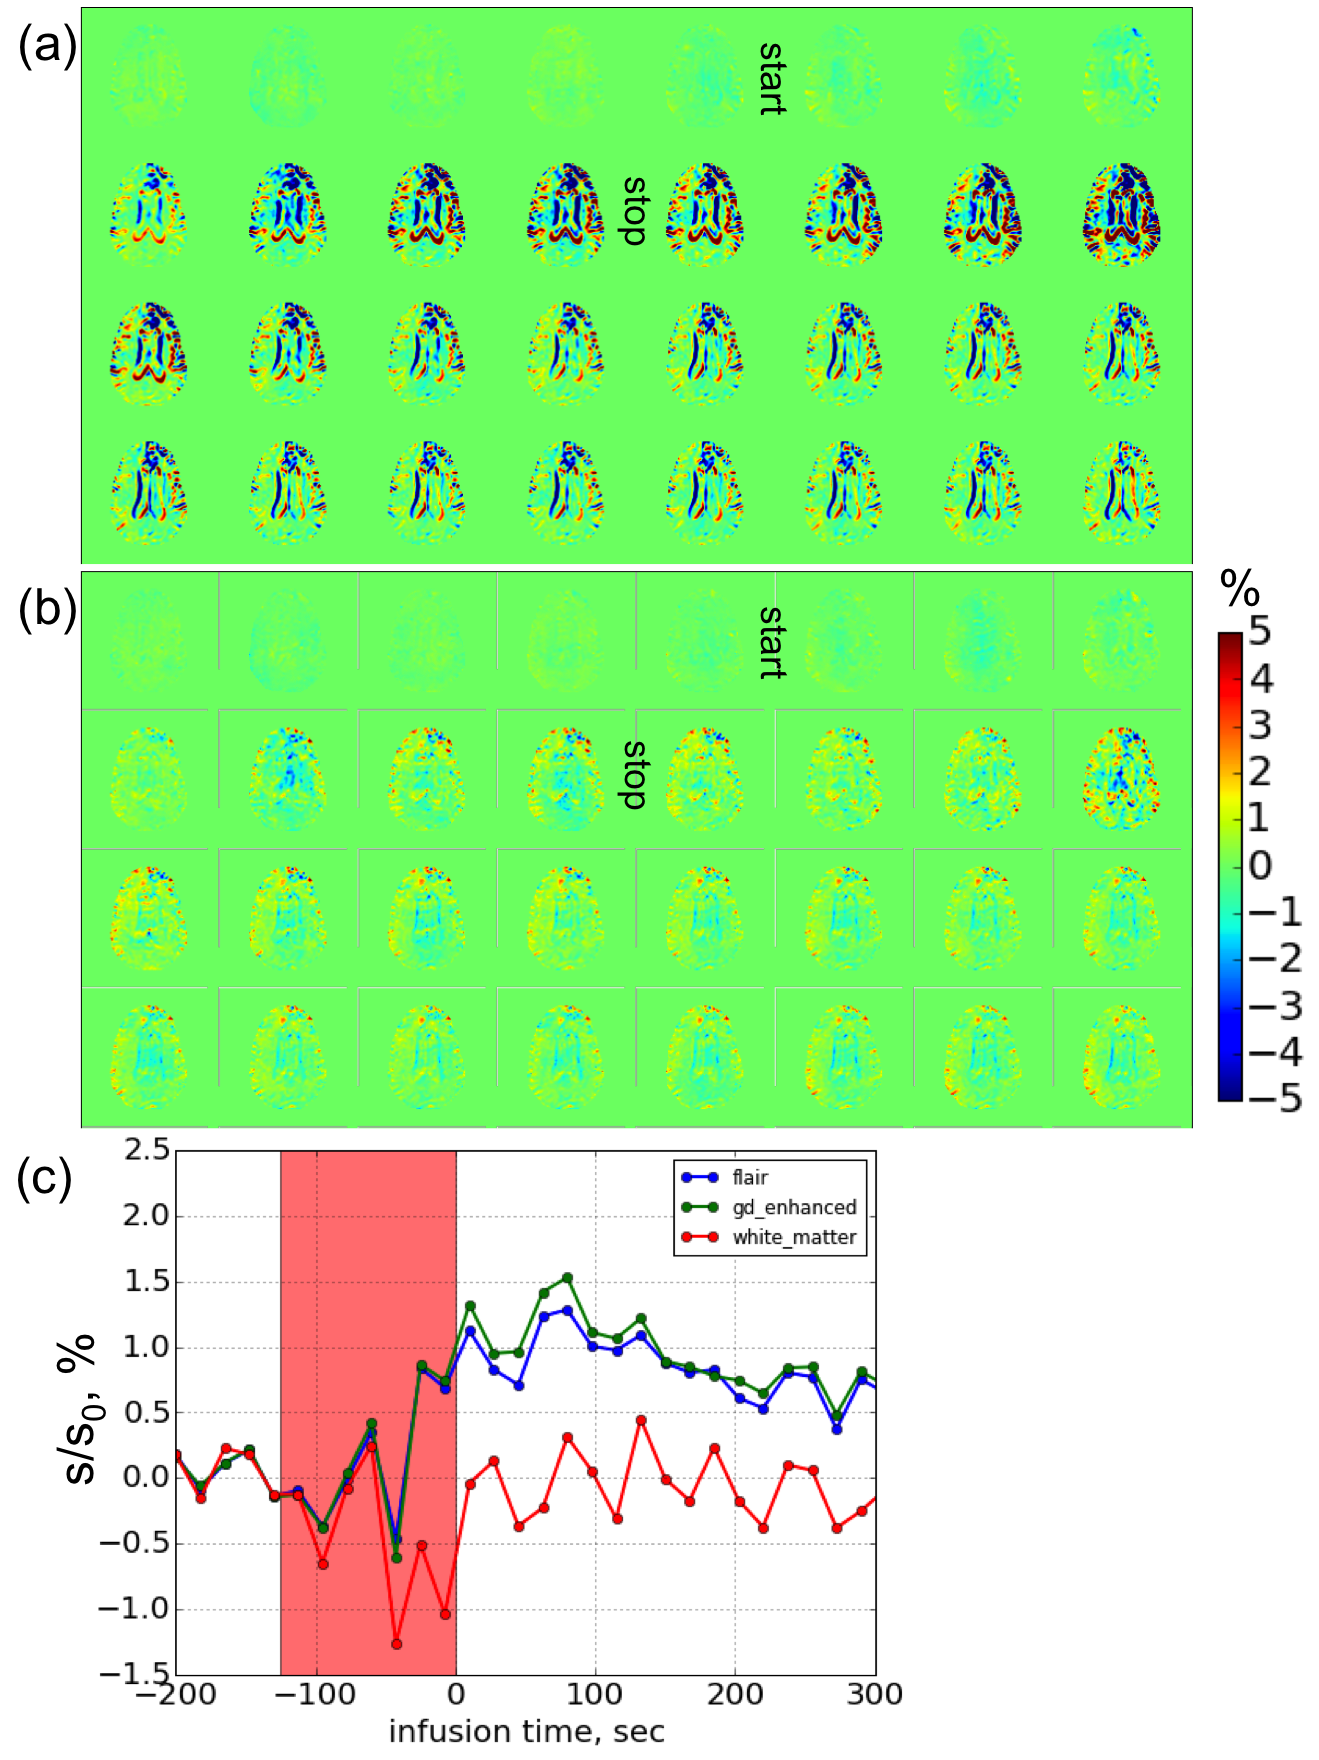
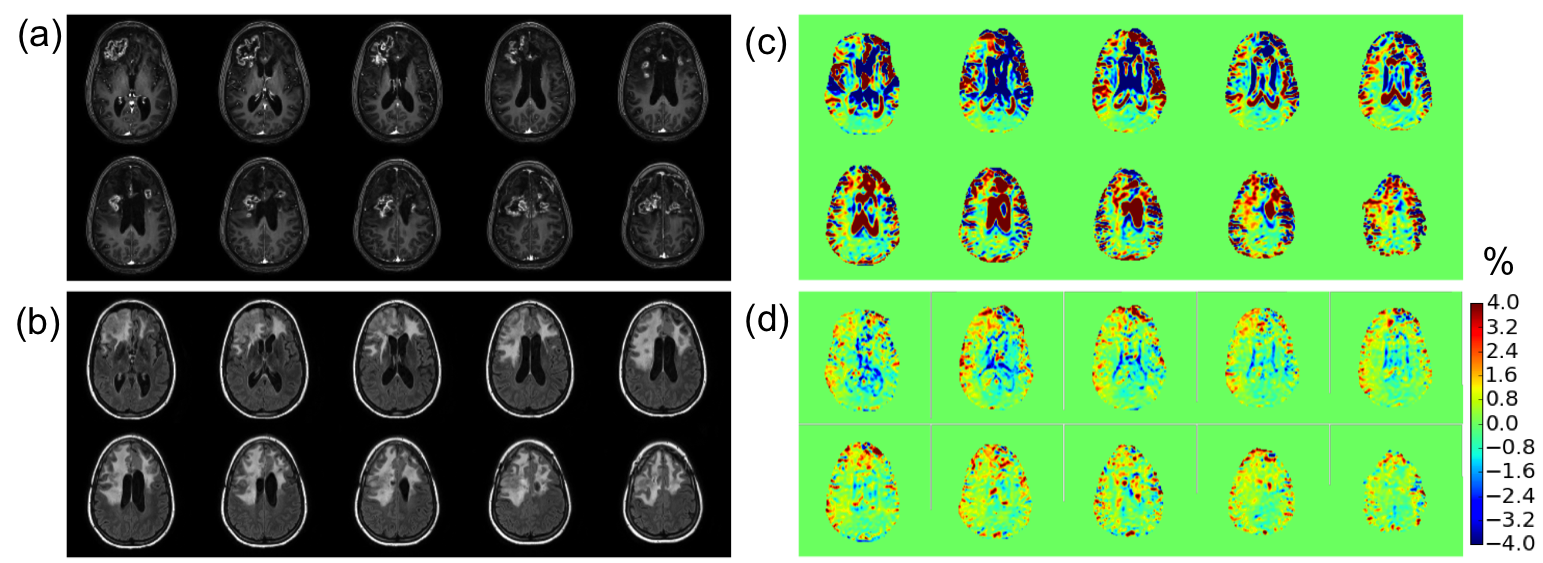
Figure 1 shows the motion profile as a function of scan time before and after realignment for a patient with recurrent glioblastoma. After realignment, the motion correction procedure only leads to a change of only about 1/100th of a voxel, indicating no further correction needed. Figure 2 shows the DGE images with and without motion correction. Areas adjacent to the ventricles and at the gray/white and gray/CSF interfaces were most affected by motion artefacts. Upon motion correction, the dynamic images were improved. The DGE signal in the Gd/FLAIR enhanced regions was around 0.5-1% and post infusion the unaffected white matter was around 0%. Figure 3 shows the post Gd-MPRAGE, T2-FLAIR, and DGE area-under-curve (AUC) images for the same patient calculated by summing up the dynamic images acquired within first 5 min post infusion. The original AUC images suffered from severe motion artefact and were not reliable for analysis of contrast enhancement. After motion correction, we observed several areas of DGE MRI enhancement that corresponded to the Gd/FLAIR enhanced region.Discussion
The above results show that motion correction adjusted the DGE effect to the expected effect size. In this study we noticed that motion started shortly after the glucose infusion. One possible intuitive interpretation is that this is due to the technicians performing procedures (such as blood sampling through the IV line) and/or the sensation of the infusion. For instance, several participants reported feeling a pulsating or warm feeling in the head and warm in the groin areas upon glucose infusion. The sensation generally disappeared quickly (tens of seconds) but may cause (in)voluntarily motion. Alternatively, it has been reported that D-glucose can cause vessel dilatation and enlargement of the ventricles due to the rapid uptake 16. These physiological volumetric changes may affect the DGE subtraction images and appear as motion. This type of tissue boundary change could be mitigated by motion correction and more work is needed to assure that the procedure does not overcompensate.Conclusion
Due to the reduced CEST effect size compared to 7T, minor motion can cause severe tissue interface artefacts in dynamic difference images at 3T. To successfully perform DGE imaging at 3T, participants need to be immobilized as much as possible, the infusion duration should be increased and minimal procedures should be performed during the scan. However, physiological changes that cause movement will still be present and may affect motion correction. Thus, such procedures may need to be further developed to address this issue that is specific for DGE imaging.Acknowledgements
NIH grants: RO1 EB019934 and K99 EB026312
Swedish Research Council grants no 2015-04170 and 2017-00995, Swedish Cancer Society grant no CAN 2015/251 and Swedish Brain Foundation grant no FO2017-0236.
References
1. Chan KWY, McMahon MT, Kato Y, et al. Natural D-glucose as a biodegradable MRI contrast agent for detecting cancer. Magnetic Resonance in Medicine 2012; 68(6): 1764-73.
2. Walker-Samuel S, Ramasawmy R, Torrealdea F, et al. In vivo imaging of glucose uptake and metabolism in tumors. Nat Med 2013; 19(8): 1067-72.
3. Nasrallah FA, Pages G, Kuchel PW, Golay X, Chuang KH. Imaging brain deoxyglucose uptake and metabolism by glucoCEST MRI. J Cereb Blood Flow Metab 2013; 33(8): 1270-8.
4. Rivlin M, Horev J, Tsarfaty I, Navon G. Molecular imaging of tumors and metastases using chemical exchange saturation transfer (CEST) MRI. Sci Rep 2013; 3.
5. Rivlin M, Navon G. Glucosamine and N-acetyl glucosamine as new CEST MRI agents for molecular imaging of tumors. Sci Rep 2016; 6: 32648.
6. Rivlin M, Tsarfaty I, Navon G. Functional molecular imaging of tumors by chemical exchange saturation transfer MRI of 3-O-Methyl-D-glucose. Magnetic Resonance in Medicine 2014; 72(5): 1375-80.
7. Jin T, Mehrens H, Hendrich KS, Kim SG. Mapping brain glucose uptake with chemical exchange-sensitive spin-lock magnetic resonance imaging. J Cereb Blood Flow Metab 2014; 34(8): 1402-10.
8. Zu Z, Spear J, Li H, Xu J, Gore JC. Measurement of regional cerebral glucose uptake by magnetic resonance spin-lock imaging. Magnetic Resonance Imaging 2014; 32(9): 1078-84.
9. Xu X, Chan KWY, Knutsson L, et al. Dynamic glucose enhanced (DGE) MRI for combined imaging of blood–brain barrier break down and increased blood volume in brain cancer. Magnetic Resonance in Medicine 2015; 74(6): 1556-63.
10. Xu X, Yadav NN, Knutsson L, et al. Dynamic Glucose-Enhanced (DGE) MRI: Translation to Human Scanning and First Results in Glioma Patients. Tomography 2015; 1(2): 105-14.
11. Paech D, Schuenke P, Koehler C, et al. T1rho-weighted Dynamic Glucose-enhanced MR Imaging in the Human Brain. Radiology 2017: 162351.
12. Schuenke P, Koehler C, Korzowski A, et al. Adiabatically prepared spin-lock approach for T1ρ-based dynamic glucose enhanced MRI at ultrahigh fields. Magnetic Resonance in Medicine 2017; 78(1): 215-25.
13. Schuenke P, Paech D, Koehler C, et al. Fast and Quantitative T1rho-weighted Dynamic Glucose Enhanced MRI. Sci Rep 2017; 7: 42093.
14. M. Z. Artifacts in dynamic CEST MRI due to motion and field shifts. 7th international CEST workshop; Beijing, China.
15. Nichols WPKFJASKT. Statistical Parametric Mapping: The Analysis of Functional Brain Images: Academic Press; 2006.
16. Puri BK, Lewis HJ, Saeed N, Davey NJ. Volumetric change of the lateral ventricles in the human brain following glucose loading. Experimental physiology 1999; 84(1): 223-6.
Figures