4996
Artifacts in dynamic CEST MRI due to motion and field shifts – implications for glucoCEST MRI at 3T1High-field magnetic resonance center, Max Planck Institute for biological cybernetics, Tübingen, Germany, 2University College London, London, United Kingdom, 3Diagnostic & Interventional Neuroradiology, University Clinic Tuebingen, Tübingen, Germany
Synopsis
Dynamic glucose enhanced imaging yields expected CEST effects that are rather small in tissue especially at clinical field strengths (<2 %). Small movements during the dynamic CEST measurement together with a subtraction-based evaluation can lead to pseudo CEST effects of the same order of magnitude. We studied these effects by virtual difference images of a basline scan that were altered by the rigid body transformations and B0 shifts. Minor motion (0.6 mm translations) and B0 artifacts (7 Hz shift) can lead to pseudo effects in the order of 1% in dynamic CEST imaging, despite no glucose was injected at all.
INTRODUCTION
Dynamic CEST studies such as dynamic glucose enhanced imaging, have gained a lot of attention recently, as it monitors the uptake and wash‐out of glucose shown in tumor models in animals (1,2) and patients with glioblastoma (3,4). The expected CEST effects after injection are rather small in tissue especially at clinical field strengths (1-2 %). Small movements during the dynamic CEST measurement together with a subtraction-based evaluation can lead to pseudo CEST effects of the same order of magnitude. These artifacts are studied herein.Methods
A 3D snapshot-CEST acquisition (5) optimized for 3T consisted of a pre-saturation module of 5 s followed by a readout module of duration TRO = 3.5 s. (FOV=220x180x48 mm3, 1.7x1.7x3mm3, TE=2 ms, TR=5 ms, BW=400 Hz/pixel, 18 slices, FA=6° and elongation factor E=0.5 (rectangular spiral reordered)). The CEST saturation period consists of 1 Gaussian-shaped RF pulse, using a pulse duration of tpulse = 100 ms, and mean B1 = 3 µT. A separate WASABI measurement was acquired for B0 and B1 mapping (6). A brain tumor patient 3D-CEST baseline scan without glucose injection performed at 3T was used to generate a virtual dynamic measurement introducing different kinds of simulated motion and B0 shifts. All subject measurements were performed after informed written consent and fulfilling all institute policies.Results
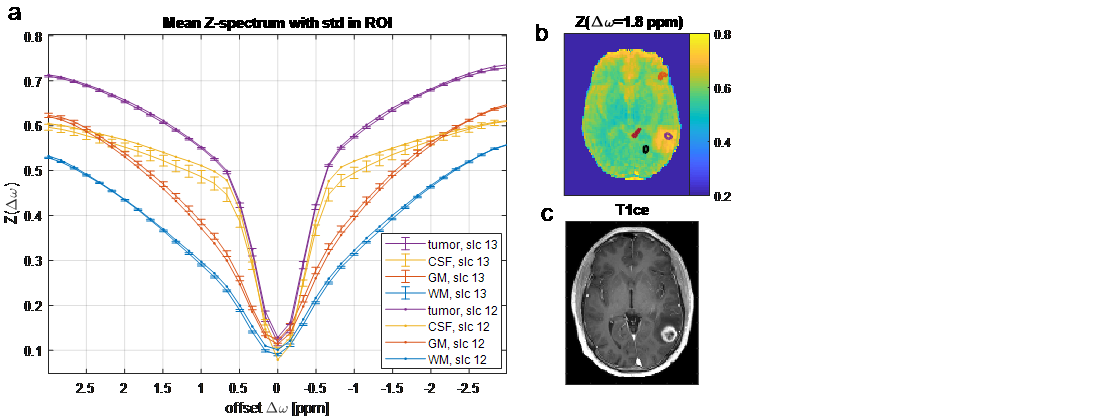
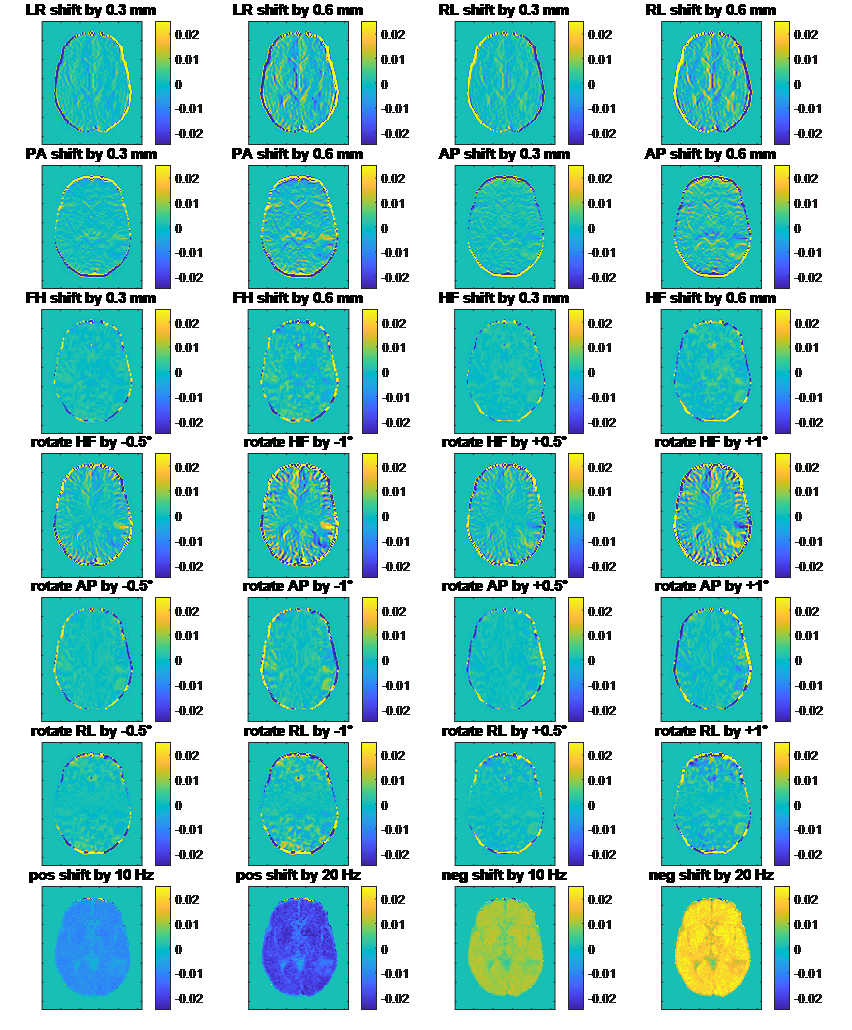
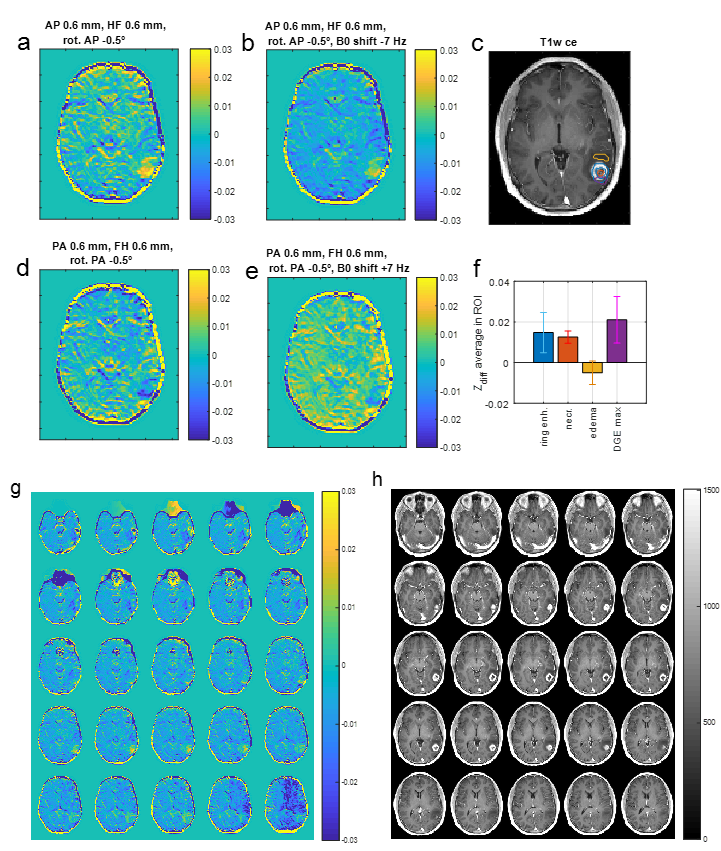
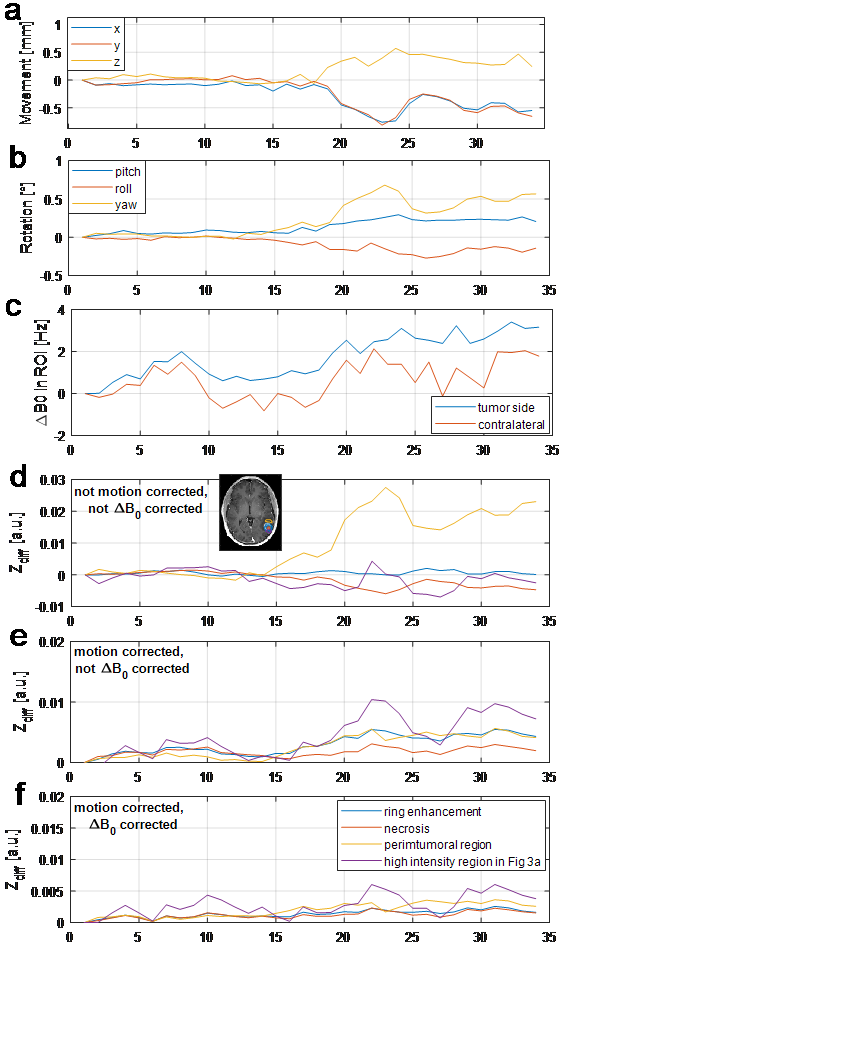
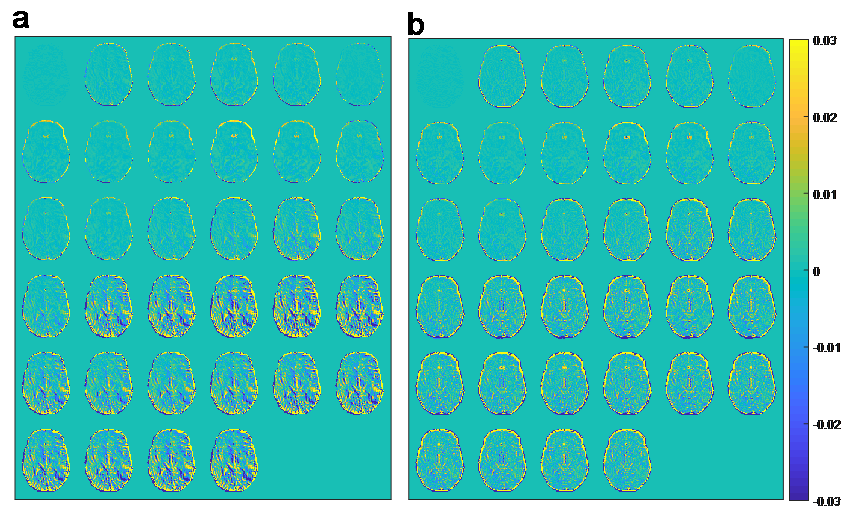
Different tissue generate different Z-spectra, thus different dB0 dependence (Fig 1a). Tumor tissue shows already contrast in the baseline scans (Fig 1bc). Virtual difference images after the rigid body transformations were calculated (Figure 2) for translations only, rotations only and B0 shifts only. Typical motion artifacts visible as bright-dark patterns are observed in healthy and tumorous tissue. In a worst case scenario such minor motion (0.6 mm translations) and B0 artifacts (7 Hz shift) can lead to pseudo effects in the order of 1% in dynamic CEST imaging (Figure 3), despite no glucose was injected at all. A real motion applied to the baseline tumor data shows similar effect sizes (Fig 4). In Figure 4 ROI evaluations were performed showing the Zdiff contrast with and without motion correction, and with and without B0 correction. This analysis reveals that motion is the dominant influence, yet, motion induced B0 changes can still alter the effect strength by about 0.5% and a combined motion and B0 correction should yield the best results. The pseudo CEST effects are shown as maps in figure 5 and highlight heterogeneously the tumor area.Discussion
Especially around tissue interfaces such as CSF borders or tumor affected areas, the pseudo CEST effect patterns are non-intuitive and can be mistaken as dynamic agent uptake. Mitigation and correction strategies are very important for reliable and robust dynamic glucose enhanced imaging. When motion artifacts are still apparent in data and dynamic effects are larger than expected glucose uptake the signal remains doubtful.Conclusion
Correction or mitigation even of small motions is crucial for dynamic CEST imaging, especially in subjects with lesions. Concomitant B0 alterations can as well induce minor pseudo effects at 3 T; this influence will be larger at higher magnetic field strengths. Attempting dynamic CEST measurements in patients without putting an effort into sophisticated motion correction is strongly ill-advised, and development of mitigation and correction strategies strongly encouraged.Acknowledgements
The financial support of the Max Planck Society, German Research Foundation (DFG, grant ZA 814/2-1), and European Union’s Horizon 2020 research and innovation programme (Grant Agreement No. 667510) is gratefully acknowledged.References
(1) Walker-Samuel et al. Nat Med 2013;19:1067–72.
(2) Xu X, et al Magn Reson Med 2015;74:1556–63.
(3) Xu X, et al Tomography 2015;1:105–114.
(4) Schuenke P et al Scientific Reports 2017;7:42093.
(5) Zaiss et al. NMR Biomed 2018;31:e3879.
(6) Schuenke P et al. Magnetic Resonance in Medicine 2017;77:571–580.
Figures