4994
Characterization of brown adipose tissue in PCOS patients by Z-Spectrum Imaging (ZSI)1Radiological Department, Tongji Hospital, Tongji Medical College, HUST, Wuhan, China, 21.Radiology Dept., 2. Bioengineering Dept., College of Medicine, University of Illinois at Chicago, Chicago, IL, United States, 3Dept. of Physiology & biophysics, College of Medicine, University of Illinois at Chicago, Dept. of Physiology & biophysics, Chicago, IL, United States, 4Department of Radiology, College of Medicine, University of Illinois at Chicago, Department of Radiology, College of Medicine, University of Illinois at Chicago, Chicago, IL, United States
Synopsis
Z-spectrum imaging (ZSI) was used to characterize brown adipose tissue (BAT) features in polycystic ovary syndrome (PCOS) patients compared to healthy subjects. Fat-water fraction (FWF) was derived from the fitting of the direct saturation of water and fat in ZSI. BAT segmentation allowed the measurement of BAT-specific FWF and area. PCOS group showed increased FWF and reduced BAT area compared to controls, likely due to reduced BAT cells activity and lipid accumulation. ZSI can therefore be used to study BAT characteristics in vivo in metabolic disorders.
Characterization of brown adipose tissue in PCOS patients by Z-Spectrum Imaging (ZSI)
INTRODUCTION: Polycystic ovary syndrome (PCOS) is a reproductive female disorder associated with several metabolic comorbidities like obesity and insulin resistance [1]. In the study of metabolic disorders, research has recently focused on brown adipose tissue (BAT), a subtype of beneficiary fat that can improve the whole-body metabolism by altering insulin sensitivity and modifying susceptibility to weight gain [2]. Lately, BAT distribution has been successfully measured by Z-Spectrum Imaging (ZSI), based on the reduced fat-water fraction (FWF) compared to white adipose tissue (WAT) [3]. The purpose of this study is to characterize BAT in healthy subjects and PCOS patients by using ZSI.
METHODS: Z-Spectrum Imaging was carried out at a 3T MRI scanner on 19 normal females (NCF, 24-34 years old), 17 normal males (NCM, 22-35years old) and 13 PCOS Patients (female, 20-33 years old). Data were collected by a CEST sequence with a saturation pulse of 1 µT, 200 ms long, at a frequency range within ±5ppm and followed by fast spin echo readout. Z-spectral data were first fitted to a model including multiple Lorentzian curves representing the direct saturation of water and fat and the magnetization transfer from macromolecules. FWF maps were then computed based on the fitted amplitudes of water and fat dips in Z-spectrum [3]. The histogram of pixel-wise FWF within the supraclavicular area was then cauterized by a multiple Gaussian fitting. FWF thresholds were prescribed from the histogram analysis for the differentiation and segmentation of WAT, BAT or Muscle (Figure 1). At last, two parameters were extracted from the analysis: the average FWF value within the segmented BAT (FWF in BAT) and the fraction of BAT over the total fat depot, defined as BATf=BATarea/ (BATarea+WATarea). The parameters were compared among the 3 study groups, and the correlations between the output parameters and subjects’ BMI were quantified.
RESULTS: As expected, FWF in BAT correlated linearly with BMI in healthy subjects, whereas there was an inverse correlation between BATf and BMI (Figure 2). The PCOS group had higher FWF in BAT than the NCF group (P<0.001), while the BATf of the PCOS group was smaller than the controls (P<0.001). The FWF in BAT of the NCF group was found to be higher than the NCM group (P<0.05), while there was no significant difference between male and female in BATf (Figure 3).
DISCUSSION AND CONCLUSION: ZSI enables the segmentation of BAT and the characterization of BAT-specific features: average FWF of BAT and the fraction of BAT over the total fat. The correlations between the BATf & FWF in BAT and BMI in the normal subjects (males and females) indicate that the subjects having higher BMI have increased FWF in BAT, indicating increased lipid content in BAT. Normal subjects with higher BMI also show less BAT fraction, indicating relatively higher level of metabolic passive WAT depot. The difference between the NCF and PCOS groups revealed that the PCOS patients have reduced BAT fraction than normal subjects, and the increased BAT FWF in PCOS patients suggests a reduced metabolism in their BAT depots. The lack of correlation between BMI and FWF in the PCOS patients indicates further reduced BAT metabolism compared to normal subjects with comparable BMI. In conclusion, as a normal MRI imaging technique, ZSI can be used to noninvasively identify and characterize BAT in vivo and under clinical settings, and can give insights on the comorbidities mechanism and diagnosis of PCOS.
Acknowledgements
Acknowledgment: This study is supported by US NIH grant R21EB023516References
1. Escobar-Morreale HF. Polycystic ovary syndrome: definition, aetiology, diagnosis and treatment. Nat Rev Endocrinol. 2018;14(5):270-284.
2. Cypess AM, Lehman S, Williams G, et al. Identification and importance of brown adipose tissue in adult humans. N Engl J Med. 2009; 360(15):1509-17.
3. Scotti A, Tain RW, Li W, et al. Mapping brown adipose tissue based on fat water fraction provided by Z-spectral imaging. J Magn Reson Imaging. 2018; 47(6):1527-1533.
Figures
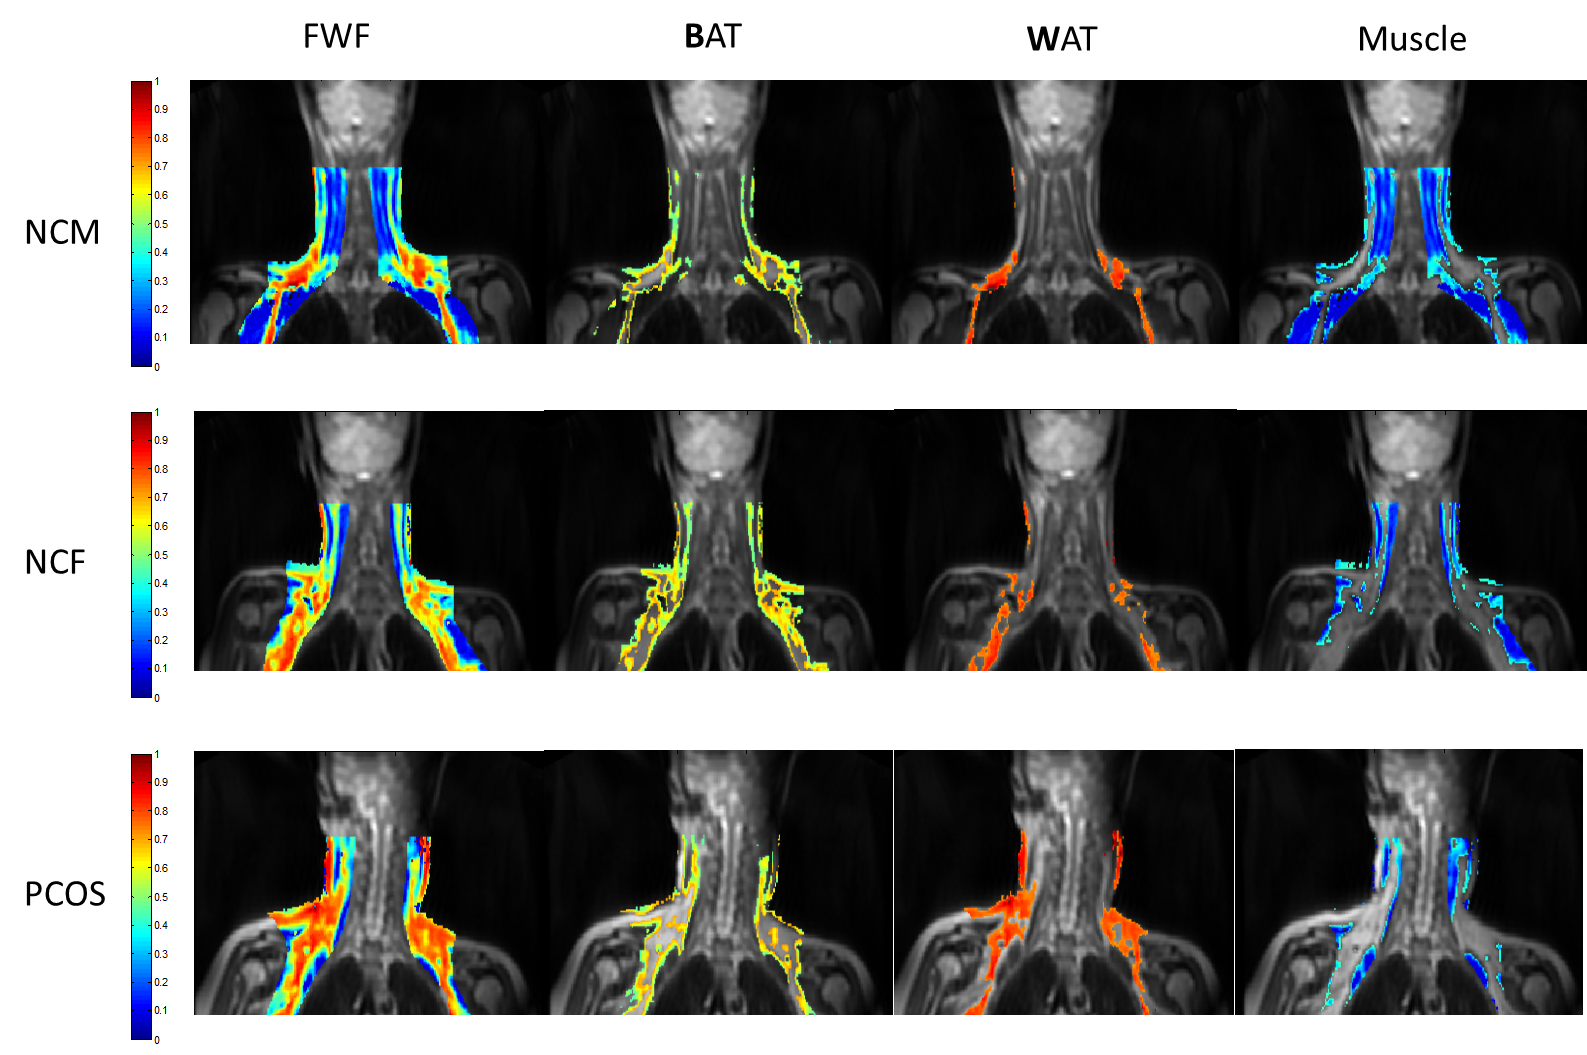
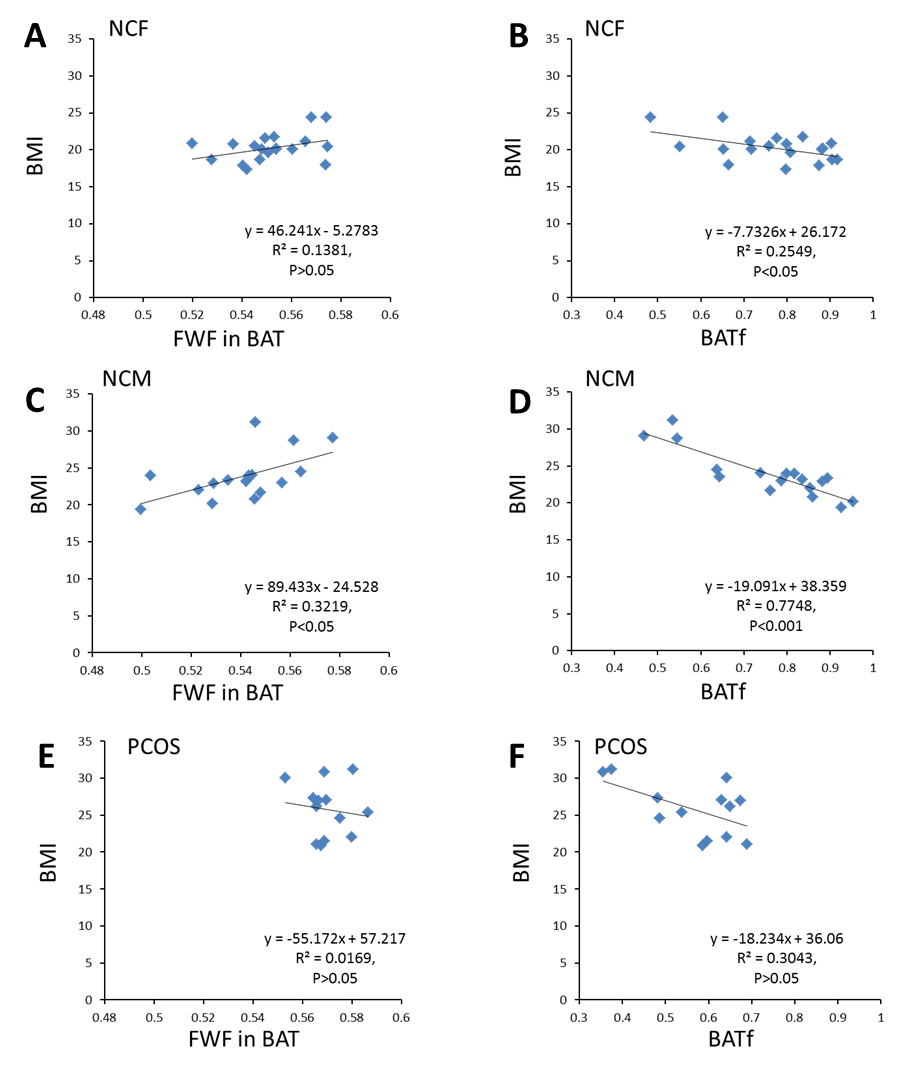
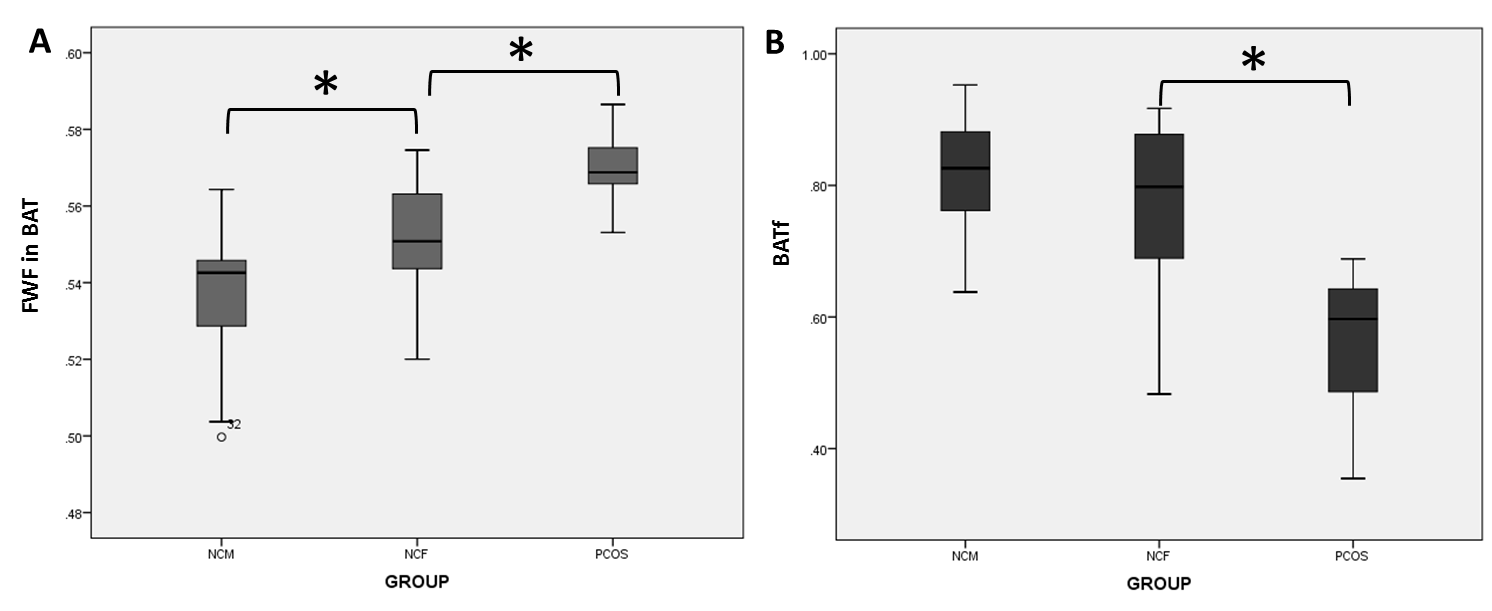
Figure 3.Comparisons of FWF in BAT (A) and BATf (B) among the different groups.
* Significant differences with P<0.05.