4993
Simultaneous Concentration Quantification of SPIO and ProHance using bSSFP MR Fingerprinting1Biomedical Translational Imaging Centre (BIOTIC), Halifax, NS, Canada, 2Department of Physics & Atmospheric Science, Dalhousie University, Halifax, NS, Canada
Synopsis
Superparamagnetic Iron Oxide (SPIO) contrast agents are used extensively in molecular imaging studies as a tool to evaluate various cell types. Enabling simultaneous use of multiple contrast agents would greatly improve molecular imaging studies. We utilize a bSSFP MR fingerprinting sequence, combined with an extension of the concentration-dependent linear relationship, to show that concentrations of SPIO and a second contrast agent (ProHance) can be simultaneously quantified.
Introduction
Superparamagnetic Iron Oxide (SPIO) contrast agents are used extensively in molecular imaging studies as a tool to evaluate various cell types. This allows monitoring and potential quantification of cell populations in vivo, facilitating longitudinal studies of disease progression, and ultimately aids in the characterization of their underlying mechanisms.
However, quantitative MR cell tracking is currently limited to single contrast agents; restricting the speed and complexity of information that can be achieved. MR Fingerprinting (MRF) is a novel methodology that enables acquisition of multiple relaxivity maps simultaneously1. Recent work has shown that MRF allows quantification of two contrast agents administered together2,3, and can be expanded to include T2* quantification4. However, MRF quantification of T2* contrast agents such as SPIO is still under development.
In this work, we show that MRF can be used to quantify SPIO and a T1 weighted contrast agent simultaneously in vitro. This study aims to lay the groundwork for future in vivo dual contrast agent quantification for use in monitoring immune response.
Methods
All phantoms were prepared in 5 mm NMR tubes, with 4% gelatine in distilled water. Varying concentrations of either Molday ION Rhodamine B (MIRB; Biopal) or ProHance (Gadoteridol; Bracco Imaging) were added (n = 12), with MIRB: 0.3 - 3.5 mM and ProHance: 0.135 - 0.54 mM. Additional phantoms were created containing both ProHance [0.2 - 0.54 mM] and MIRB [0.3 - 2.1 mM] increasing in opposite directions (n=4). Bulk T1, T2, and T2* values were obtained using conventional methods for each phantom with a 3T preclinical scanner (Agilent, Santa Clara, CA).
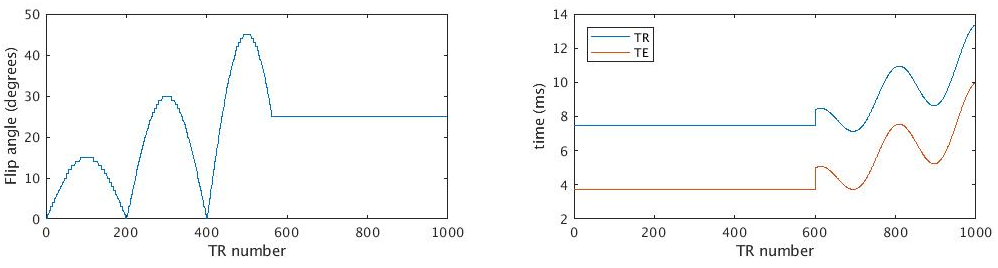
A cartesian IR-bSSFP, adapted for MRF acquisition by varying TE, TR, and flip angle allowed for joint quantification of T1, T2, and T2*, as shown in Figure 1. Fully sampled data was collected over 1000 parameter iterations, yielding 1000 128x128 images with 3x3mm resolution in 20 minutes. The data was reconstructed offline using MATLAB (The MathWorks; Natick, MA).
The MRF dictionary was generated offline using MATLAB, by simulating the signal evolution according to the Bloch equations. T2* decay dynamics were added by scaling the output at each TR by exp(-(TE-TR/2)/T2*). The dictionary was calculated over values of T1 = 30 - 2300 ms, T2 = 1 - 1150 ms, and T2* = 0.1 - 80 ms, with decreasing granularity as each value increases. Illogical entries were removed, such as entries where T1 < T2. The dictionary was approximately 600,000 entries, taking approximately 15 minutes to construct.
Dictionary matching was performed by calculating the maximum dot product of the magnitude of the signal with the magnitude of each dictionary entry, providing an estimation of T1, T2, and T2* in approximately 10 minutes. Estimates of concentrations were calculated by solving the following system of equations:
T1=T10+[Gd]r1,g+[SPIO]r1,SPIO
T2=T20+[Gd]r2,g+[SPIO]r2,SPIO
T2*=T2*0+[Gd]r2*,g+[SPIO]r2*,SPIO
Results and Discussion
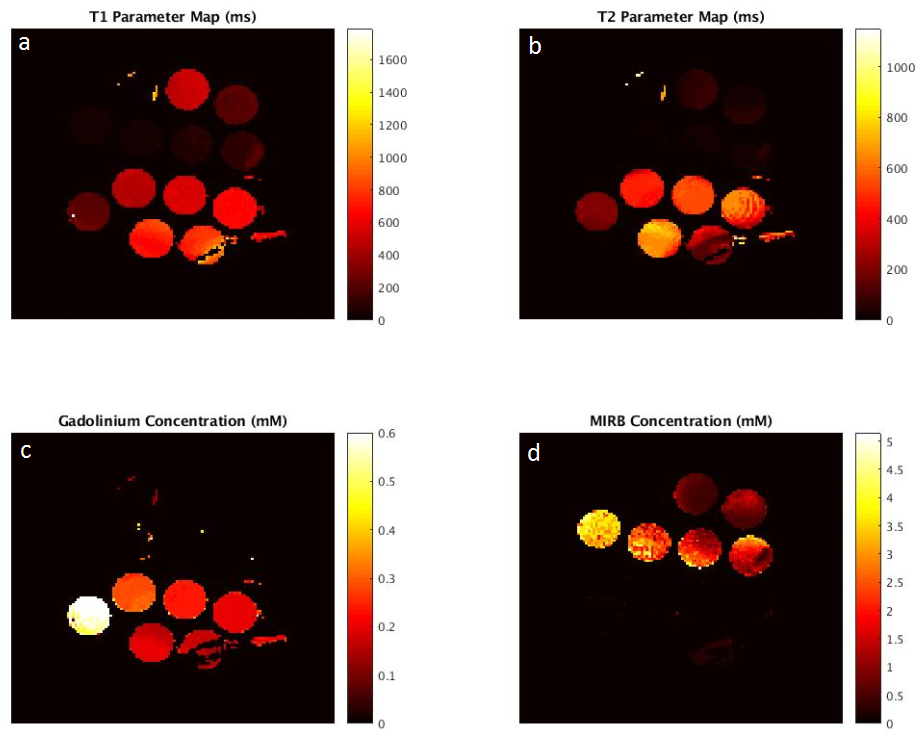
Figure 2 shows the parameter maps of the phantoms containing individual contrast agents, and the estimated concentrations of each agent. This demonstrates that MRF can quantify contrast agent concentration for separated agents. The bottom right phantom in figure 2 was subject to aliasing, causing errors in all maps in this region. Inhomogeneity observed in MIRB phantoms in figure 2d can be attributed to lack of a pre-contrast baseline for each phantom. As a surrogate, the average relaxation rates from a control tube with no contrast agent were used. We expect this to be resolved when moving to in vivo applications.
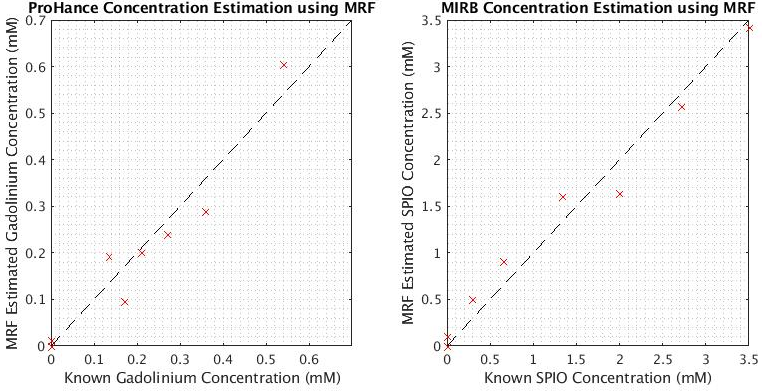
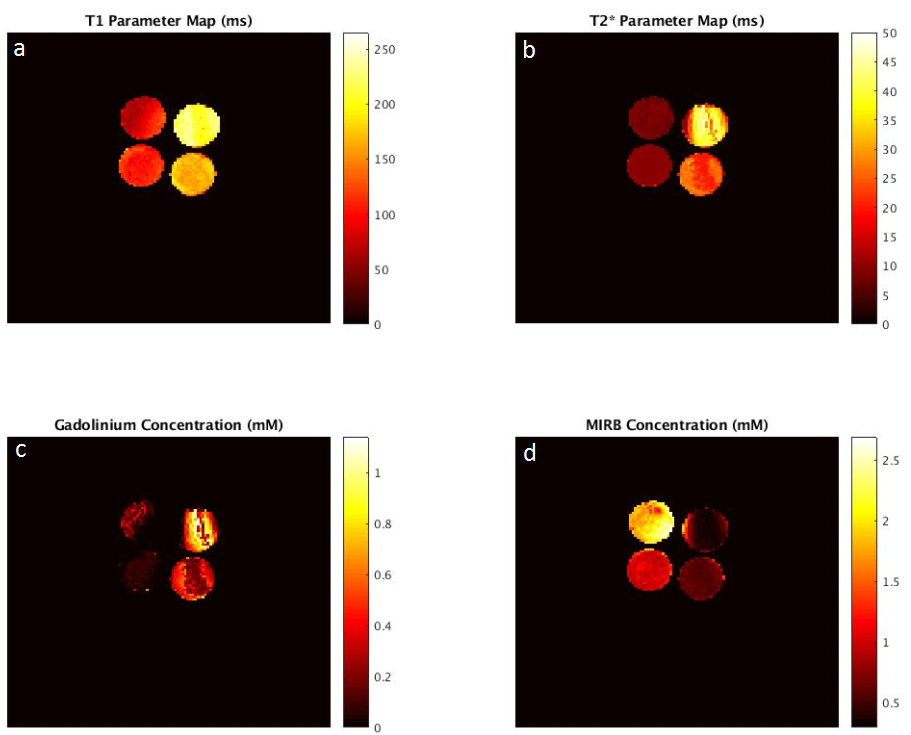
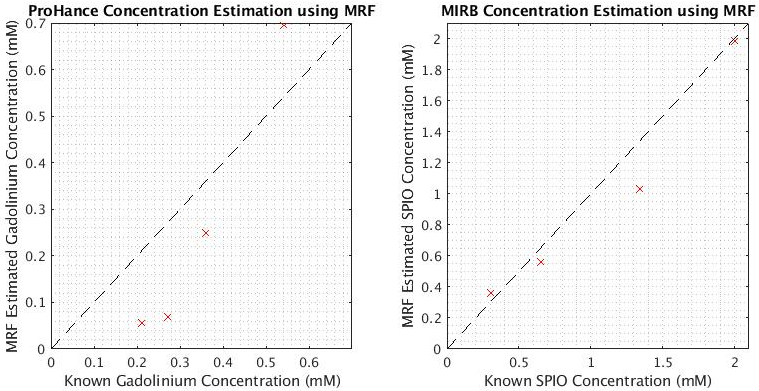
Figure 4 shows the parameter maps and concentration estimations for mixed contrast agents, demonstrating that mixed concentrations can be quantified simultaneously. Variation in the ProHance concentration could be attributed to the small concentrations used relative to MIRB. Figure 5 shows the average MRF concentration for each phantom and agent, compared to the known value. These preliminary results are within good agreement for MIRB, and show the correct trend for ProHance. Future work will assess and correct the cause of error in ProHance values.
Acquisition times for this method are currently not viable for in vivo studies, but we have begun implementing undersampled spiral acquisition, allowing 3D dynamic imaging of multiple contrast agent concentrations simultaneously. Since MRF is typically performed using SSFP, and our bSSFP approach increases SNR, it may allow higher undersampling and decreased scan time relative to SSFP.
Conclusion
Contrast agent concentration quantification of SPIO mixed with a second agent is achievable using bSSFP MRF in vitro. This could be used in future preclinical studies to track more than one mechanism, increasing the speed and value of cell tracking studies.Acknowledgements
Funding for this project was provided by an NSERC Discovery Grant.References
1 - Ma D, Gulani V, Seiberlich N, Liu K, Sunshine JL, Duerk JL, et al. Magnetic resonance fingerprinting. Nature. 2013;495:187–192.
2 - Rieger B, Zimmer F, Zapp J, Weingärtner S, Schad LR. Magnetic resonance fingerprinting using echo-planar imaging: Joint quantification of T1 and T2* relaxation times. Magn Reson Med. 2017 Nov;78(5):1724-1733.
3 - Anderson CE et al. Dual Contrast - Magnetic Resonance Fingerprinting (DCMRF): A Platform for Simultaneous Quantification of Multiple MRI Contrast Agents. Sci Rep. 2017 16;7(1):8431.
4 - Wyatt CR et al. Multi‐parametric T2* magnetic resonance fingerprinting using variable echo times. NMR Biomed. 2018 Sep;31(9):e3951.
Figures