4990
Exploring human cortical microstructure using magnetic resonance fingerprinting at 3T1Epilepsy Center, Cleveland Clinic, Cleveland, OH, United States, 2Radiology, Case Western Reserve University, School of Medicine, Cleveland, OH, United States, 3Imaging Institute, Cleveland Clinic, Cleveland, OH, United States
Synopsis
Human cortical areas are typically differentiated by functions with varying cyto- and myelo- architectures. Since quantitative MR tissue properties, such as T1, T2 and susceptibility, reflect underlying molecular compositions and micro-environment of tissues, multiple quantitative imaging methods have been used to investigate human cortical microstructure at 7T. Here, we used the FSL image analysis tool to process multi-parametric quantitative maps and demonstrated that high resolution multi-parametric maps acquired from a single MR Fingerprinting (MRF) scan at 3T can reveal similar patterns of cyto-architectural information that are typically identified at 7T.
Introduction
The study of cortical brain structure requires images with high resolution and high sensitivity to subtle tissue changes in the cortex, and is thus typically performed at ultra-high fields. Since quantitative MR tissue properties, such as T1, T2 and susceptibility, reflect underlying molecular compositions and micro-environment of tissues, multiple quantitative imaging methods have been used to investigate human cortical cyto- and myelo-architectures at 7T1,2. In this study, we used the FSL image analysis tool to process multi-parametric quantitative maps and demonstrated that high resolution multi-parametric maps acquired from a single MR Fingerprinting scan3 at 3T can reveal similar patterns of cyto-architectural information that are typically identified at 7T. These patterns are in good agreement with the cyto-structure differences defined by the Brodmann areas and thus indicate the feasibility of using quantitative tissue properties through the MRF method acquired on a 3T clinical scanner to probe microstructure of human cortex.Method
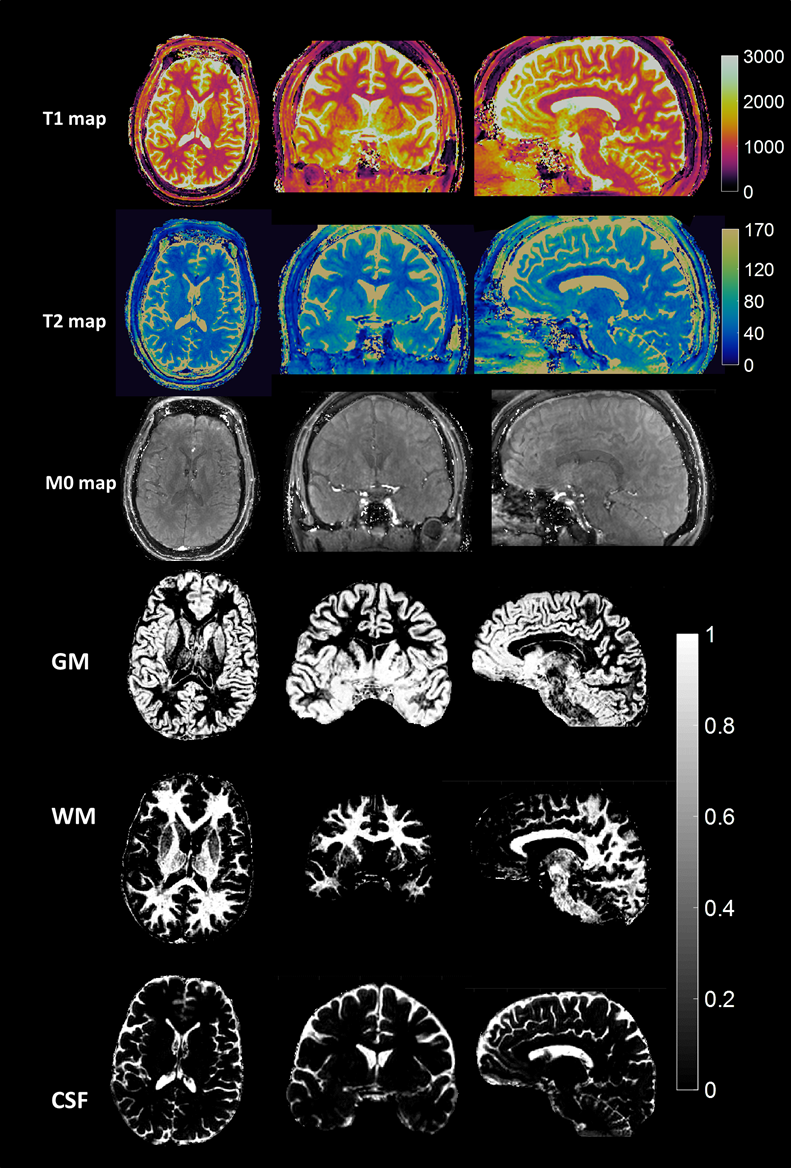
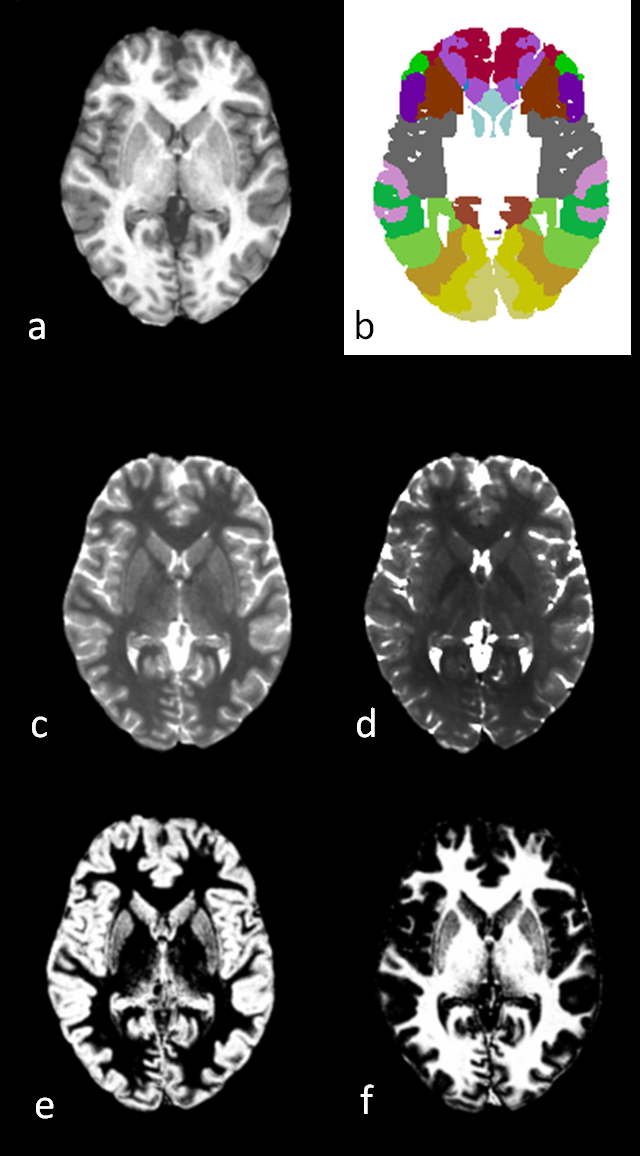
Five healthy volunteers were scanned in a Siemens 3T Prisma scanner, using a 3D whole brain MRF scan with FOV of 300x300x144 mm3 and 1.2 mm3 isotropic image resolution4. The data were then zero-padded in k-space in three dimensions to achieve a 0.6 mm3 image resolution during reconstruction. After pattern recognition using a predefined dictionary, T1, T2 and proton density maps were generated simultaneously. The total scan time of the 3D MRF scan was 10.4 minutes. A 1.5 minute B1 scan was then performed to correct for the B1 inhomogeneity in all the MRF results. Using the same data, partial volume analysis was performed in each pixel to generated gray-matter (GM), white-matter (WM) and CSF fraction maps5. As a result, a total of six quantitative maps (T1, T2, M0, GM, WM, CSF maps), perfectly co-registered with an apparent 0.6 mm3 isotropic image resolution, were generated from a single MRF scan, as shown in Figure 1. In order to register all the maps to the Broadmann area template, a synthesized MPRAGE volume (T1-weighed) from each subject was first generated using T1, T2 and M0 maps from the MRF results. This T1-weighted volume was then normalized to the MNI space using FSL FLIRT6. Using the corresponding transformation matrix, all quantitative maps were transferred to the same space with FSL. The normalized maps can then be co-registered to the Brodmann areas template using MRIcro. For each subject, 11 ROIs based on the Brodmann areas 2,3,4,6,8,9, 17, 18, 29, 32 and 45 were selected and applied to the high-resolution quantitative maps. These ROIs have been reported to have distinct functional and microstructural features1. The mean and standard deviation(std) of the T1, T2 and GM fraction from each ROI among five volunteers were calculated in MATLAB. 7T images were acquired using previously published protocol7.results
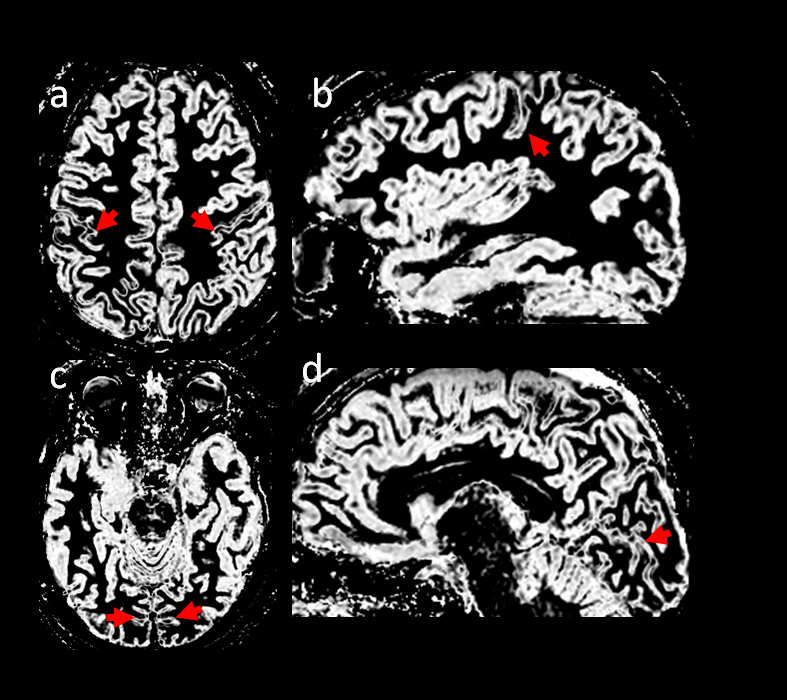
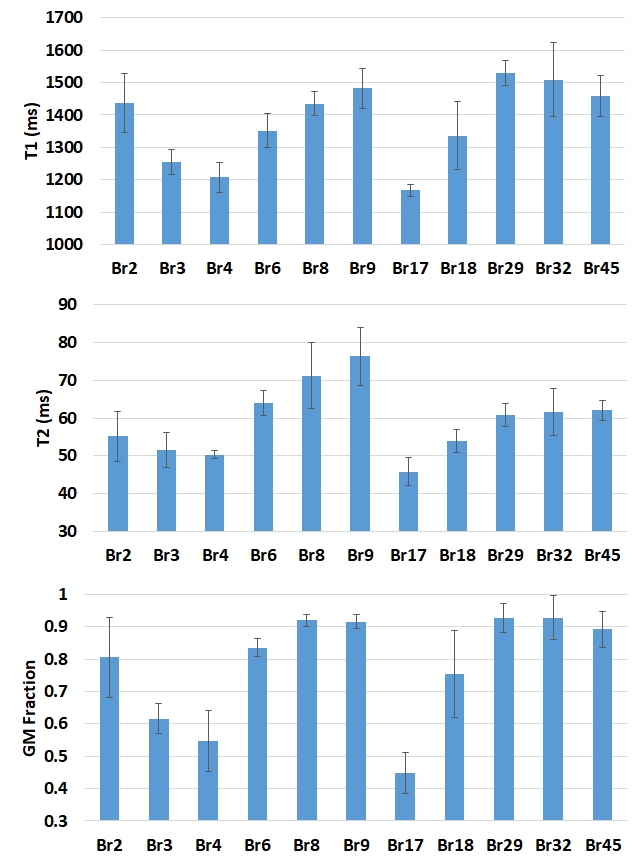
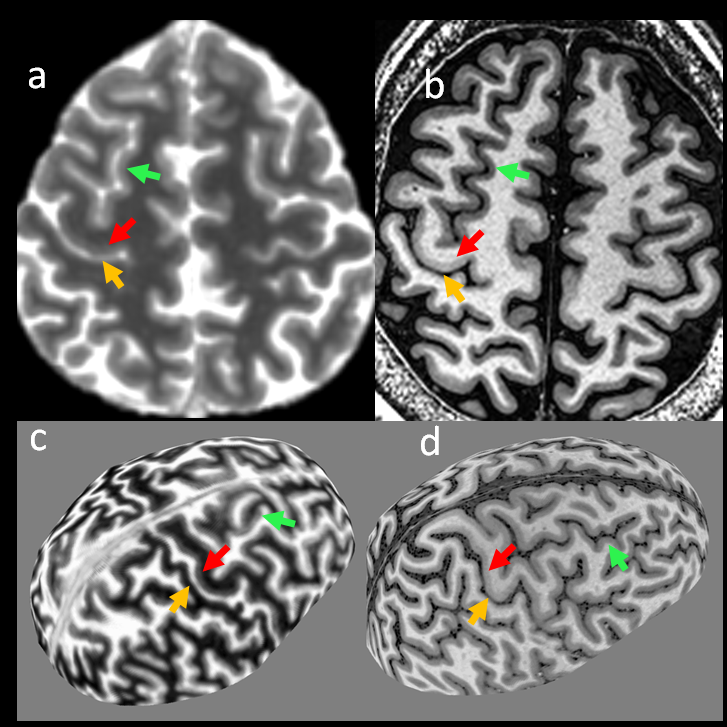
Figure 1 illustrates the results from a volunteer scan using 3D MRF, which include 3D isotropic T1, T2, M0 and three partial volume fraction maps. Since all the maps are generated from the same scan, all maps are co-registered. Figure 2 highlights the regional variations of tissue properties from the motor cortex and visual cortex, which is visually apparent on gray matter maps. Since the gray matter fraction map was calculated based on average T1 and T2 values of the entire cortex, cortical regions with inherently low T1 and T2 values result in low gray matter fractions on the map. Figure 3 demonstrates all the normalized maps and the corresponding co-registered Brodmann area template using FSL and MRIcro tools. Figure 4 shows the mean and standard deviation of the T1, T2 and GM fractions from the 11 ROIs among five volunteers. The quantitative value changes among different regions are in good agreement with other reports5. Specifically, Br 3-4 and Br. 17-18 have lower T1/T2/GM values as compared to Br. 6,8 and 9, corresponding to the different cytoarchitecture of these cortices. Br.29 has low T2 value, due to its reported rich myelin content. Br. 32 has high T1/T2/GM, corresponding to thick cortex. As illustrated in Figure 5, the signal variations within Br.4 shown on the T1 maps from the 3T MRF scan are also consistent with changes on T1-weighted images acquired at 7T.conclusion
This study demonstrates the feasibility of using multi-parametric MRF results at 3T to differentiate cortical regions with different cyto- or myelo-architectures, which is typically only identifiable at 7T. In addition, all the quantitative maps can be normalized to the MNI space which provides a platform for further volume or surface analysis based on quantitative images on both individual and group levels.Acknowledgements
The authors would like to acknowledge funding from Siemens Healthineers, NIH grant 1R01EB016728,References
1. Marques J.P. Khabipova D., Gruetter R., Studying cyto and myeloarchitecture of the human cortex at ultra-high field with quantitative imaging: R1, R2*, and magnetic susceptibility. Neuroimage, 147(2017) 152-163
2. Adad J.C., Polimeni, J.R., Helmer K.G. et al, T2* mapping and B0 orientation-dependence at 7T reveal cyto- and myelo architecture organization of the human cortex. Neuroimage, 60(2), 2012.
3. Ma et al. Magnetic resonance fingerprinting, Nature, 2013, 495(7440):187-192
4. Ma et al. Using 3D high-resolution MRF to assist detection and characterization of epileptic lesions. ISMRM 2018. 0315
5. Deshmane A, McGivney D, Badve C, Gulani V, Griswold M. Dictionary approach to partial volume estimation with MR Fingerprinting: validation and application to brain tumor segmentation. In: Proc. Intl. Soc. Mag. Reson. Med. 25 (2017). ; 2017. p. 132.
6. FLIRT: Jenkinson, M., Bannister, P., Brady, J. M. and Smith, S. M. Improved Optimisation for the Robust and Accurate Linear Registration and Motion Correction of Brain Images. NeuroImage, 17(2), 825-841, 2002.
7. Obusez EC, Lowe M, et al. 7T MR of intracranial pathology: preliminary observations and comparisons to 3T and 1.5T. Neuroimage, 2018,168:459-476
Figures