4989
Analysis of magnetization transfer (MT) influence on quantitative mapping of T2 relaxation time1Department of Biomedical Engineering, Tel Aviv University, Tel Aviv, Israel, 2Department of Chemical Physics, The Weizmann Institute, Rehovot, Israel, 3Strauss computational neuroimaging center, Faculty of Life sciences, Tel Aviv University, Tel Aviv, Israel, 4Department of Diagnostic Imaging, Sheba Medical Center, Ramat Gan, Israel, 5Sagol School of Neuroscience, Tel Aviv University, Tel Aviv, Israel, 6Center for Advanced Imaging Innovation and Research (CAI2R), New-York University Langone Medical Center, New York, NY, United States
Synopsis
Quantification of T2 values is valuable for a broad range of pathologies, yet, highly challenging due to the contamination of rapid multi-echo spin-echo (MESE) protocols by stimulated and indirect echoes. Bloch-simulations based methods, such as the echo modulation curve (EMC) algorithm, take these signal fluctuations into account and produce accurate, precise, and reproducible T2 values. This work provides detailed analysis of magnetization transfer (MT) effect on MESE signal and on the ensuing T2 values, investigating different protocol settings, and using three models: in vitro urea phantom, ex vivo horse brain and in vivo human brain.
Target audience
Introduction
Quantitative MRI techniques aim to produce accurate and reproducible parameter values. Quantitative T2 (qT2) evaluation is particularly valuable, with proven applicability for a wide range of pathologies1–5. Accurate T2 mapping, however, is highly challenging in clinical settings due to the long scan times of full spin-echo (SE) acquisitions, and the inherent contamination of fast Multiecho-SE (MESE) protocols by stimulated and indirect echoes.
Further to that, the measurement of T2 can also be biased by the transfer of magnetization (MT) between macromolecules and free water molecules. MT is associated with two types of signal loss; The first is MT saturation (MTSAT) mediated by cross-relaxation or chemical-exchange between the water and the macromolecular pool (MMP)6,7. This type of MT is instigated by the large number of RF pulses employed in MESE6–11, which affect both the slice-of-interest and other slices owing to the MMP’s broad spectral width. The second mechanism relates to the direct attenuation (MTDIR) of the water pool by incomplete T1 recovery or inter-slice interactions.
This work analyzes the effect of MT on MESE qT2 values, processed using the Bloch simulations based echo-modulation-curve (EMC) algorithm12–14. Three models were investigated: in vitro urea phantom having a well-defined spectral content; ex vivo horse brain presenting a physiological MMP content, yet free of flow or motion artefacts; and in vivo human brain. Attention was given to the different influence of MT on the acquired signal vs. its influence on the ensuing T2 values, and under various protocol settings.
Methods
Urea phantom: six caulked 100ml tubes were prepared for a range of urea concentrations: 0, 0.5, 1, 2, 3 and 4 Molars. Tubes were doped with 0.25mM MnCl2, reducing their T2 / T1 ratio to physiological values.
Horse brain: fixed horse brain was induced in PBSx1 solution for 24h prior to scanning, removing formaldehyde residues and negating the fixation effects on T2 and MT15. During scan, brain was induced in proton-free FC-770 Fluorinert fluid.
Human brain: healthy 30 y/o male, with informed consent.
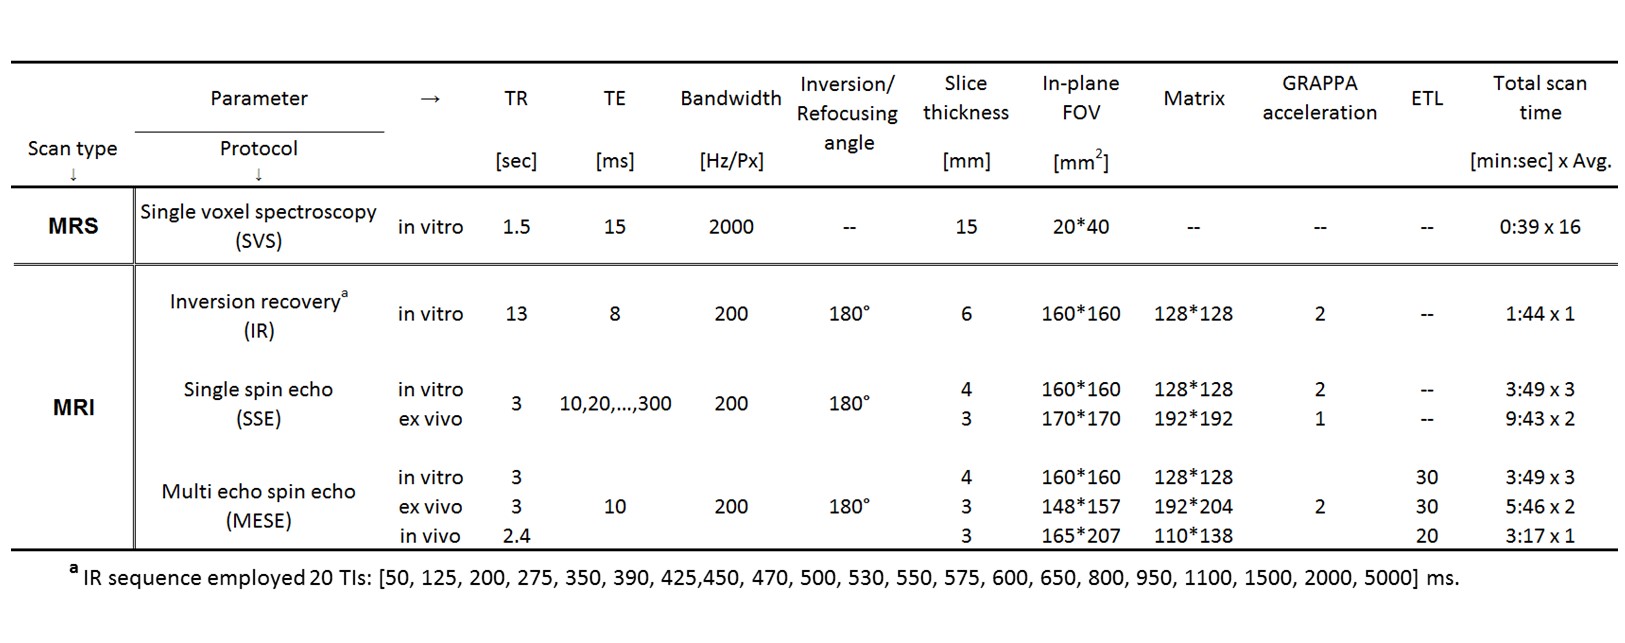
MRI scans: experiments were performed on a whole-body 3T scanner (Siemens Prisma). Scans included single-voxel spectroscopic (SVS) MRS, MESE, IR and SSE. Scans parameters are detailed in Table 1.
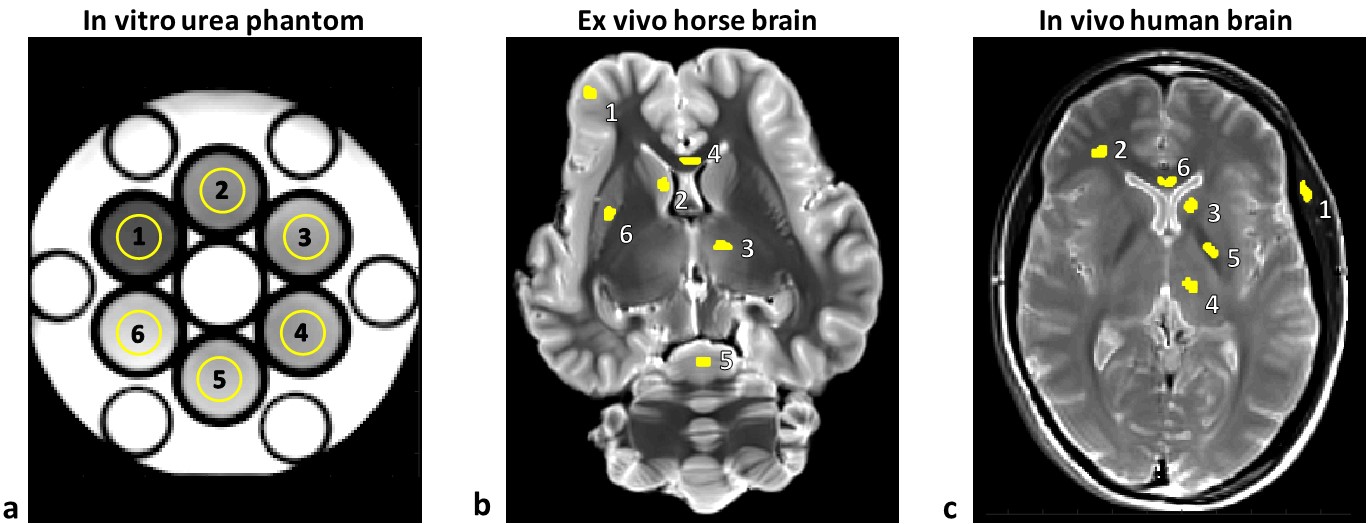
Data post-processing: quantitative T1 maps were generated using standard fitting to IR signal model16; qT2 maps were reconstructed from MESE data using the EMC algorithm13, and from SSE data using conventional fitting to exponential model; MT ratio (MTR) was calculated using: $$$\frac{m_0-m_S}{m_0}\cdot100\%$$$. Mean ± SD of quantitative values were calculated for selected regions of interest (ROIs) (see Fig. 1).
Results
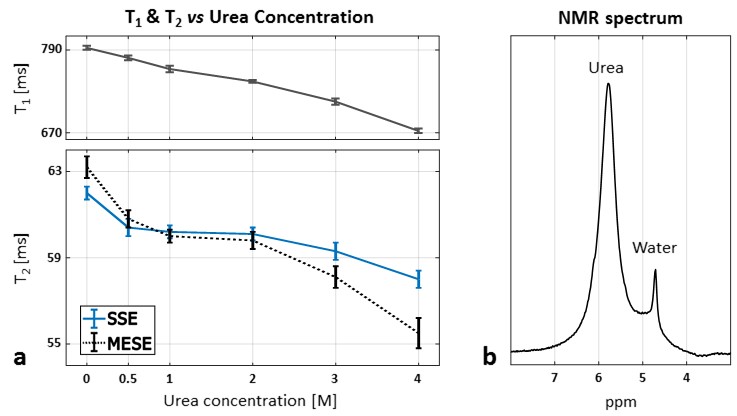
SSE vs. MESE: Fig. 2a illustrates the reduction of T1 and T2 with increased urea concentration – caused by increased dipolar coupling. While consistent reduction is observed for both SSE (-6.4%) and MESE (-12.2%), a dispersive pattern of T2 emerged between the two protocols due to two competing effects: diffusion in SSE vs. MTSAT in MESE. Similar behavior was observed for the horse brain, where MESE T2 values were consistently underestimated compared to SSE (P<0.001), with an average underestimation of 8.9±2.9% for all ROIs (see Fig. 1b). These results suggest that MT-related underestimation of T2 occurs already in single-slice MESE acquisition. Fig. 2b shows a water-suppressed spectrum of the 4M urea tube.
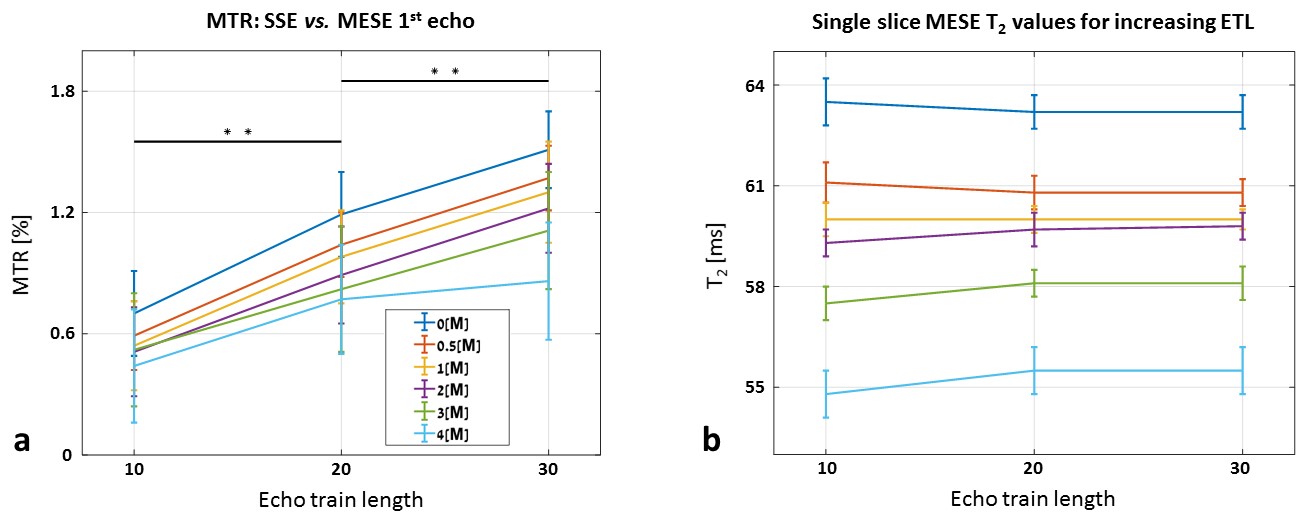
MESE – ETL dependence: Fig. 3 presents the MTR and T2 in single-slice MESE acquisition for different echo train lengths (ETL). Longer ETL increases MTR due to shorter effective TR (P<0.001), limiting full T1 recovery. The corresponding T2 values, however, are not affected by the increased ETL.
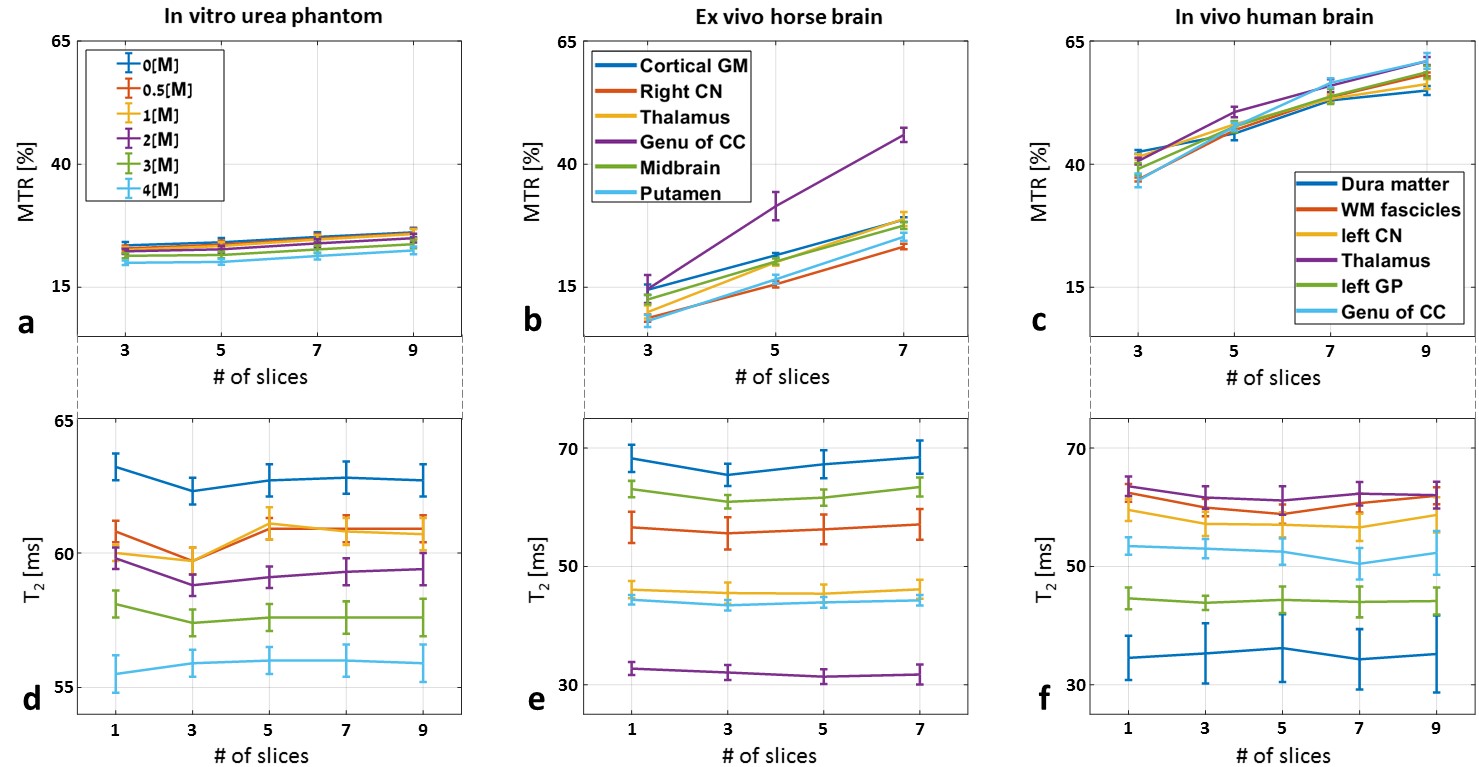
MESE – multi-slice effect: MT bias when shifting to multi-slice scans is presented in Fig. 4 for the three models. MTR (a-c) correlated positively with the number of slices and with the MMP content, while the corresponding T2 values (d-f) were stable. Increasing the inter-slice gap resulted in reduced MTR which also does not translate into a bias in T2 values (not shown).
Discussion and Conclusions
The effect of MT on measured T2 depends on macromolecular content and on scan parameters. Our results show that MT leads to underestimation of MESE T2 values already in single-slice acquisitions, due to gradual and accumulated attenuation of signal along the echo-train. Shifting to multi-slice acquisitions causes further MT-related attenuation of the signal, without changing T2, as this attenuation occurs uniformly along the echo-train.
The broad MMP spectral-range of the brain tissues increased the measured MTR, while conclusive evidence regarding the effect on T2 cannot be drawn in the absence of MT-free baseline. Future work will investigate the effect of MT in multi-T2 models, and ways to negate or compensate these effects.
Acknowledgements
ISF 2009/17
References
1. Siemonsen S, Mouridsen K, Holst B, et al. Quantitative T2 values predict time from symptom onset in acute stroke patients. Stroke. 2009;40(5):1612-1616.
2. Lund H, Jønsson A, Andresen J, Rostrup E, Paulson OB, Sørensen PS. Cognitive deficits in multiple sclerosis: correlations with T2 changes in normal appearing brain tissue. Acta Neurol Scand. 2012;125(5):338-344.
3. Eitel I, Friedrich MG. T2-weighted cardiovascular magnetic resonance in acute cardiac disease. J Cardiovasc Magn Reson. 2011;13(1):13.
4. Liu W, Turkbey B, Senegas J, et al. Accelerated T2 mapping for characterization of prostate cancer. Magn Reson Med. 2011;65(5):1400-1406.
5. Pan J, Pialat J-B, Joseph T, et al. Knee Cartilage T2 characteristics and evolution in relation to morphologic abnormalities detected at 3-T MR imaging: a longitudinal study of the normal control cohort from the osteoarthritis initiative. Radiology. 2011;261(2):507-515.
6. Majumdar S, Orphanoudakis SC, Gmitro A, O’Donnell M, Gore JC. Errors in the measurements of T2 using multiple-echo MRI techniques. II. Effects of static field inhomogeneity. Magn Reson Med. 1986;3(4):562-574.
7. Crawley AP, Henkelman RM. Errors in T2 estimation using multislice multiple‐echo imaging. Magn Reson Med. 1987;4(1):34-47.
8. MacKay A, Laule C, Vavasour I, Bjarnason T, Kolind S, Mädler B. Insights into brain microstructure from the T2 distribution. Magn Reson Imaging. 2006;24(4):515-525.
9. Mitchell DG, Burk DL, Vinitski S, Rifkin MD. The biophysical basis of tissue contrast in extracranial MR imaging. Am J Roentgenol. 1987;149(4):831-837.
10. Constable RT, Anderson AW, Zhong J, Gore JC. Factors influencing contrast in fast spin-echo MR imaging. Magn Reson Imaging. 1992;10(4):497-511.
11. Van Zijl PCM, Yadav NN. Chemical exchange saturation transfer (CEST): What is in a name and what isn’t? Magn Reson Med. 2011;65(4):927-948.
12. Ben-Eliezer N, Sodickson DK, Shepherd T, Wiggins GC, Block KT. Accelerated and motion-robust in vivo T2 mapping from radially undersampled data using bloch-simulation-based iterative reconstruction. Magn Reson Med. 2016;75(3):1346-1354.
13. Ben-Eliezer N, Sodickson DK, Block TK. Rapid and accurate T2 mapping from multi spin echo data using bloch-simulation-based reconstruction. Magn Reson Med. 2015;73(2):809-817.
14. McPhee KC, Wilman AH. Transverse relaxation and flip angle mapping: Evaluation of simultaneous and independent methods using multiple spin echoes. Magn Reson Med. 2017;77(5):2057-2065.
15. Shepherd TM, Thelwall PE, Stanisz GJ, Blackband SJ. Aldehyde fixative solutions alter the water relaxation and diffusion properties of nervous tissue. Magn Reson Med. 2009;62(1):26-34.
16. Kaldoudi E, Williams SCR. Relaxation time measurements in NMR imaging. Part I: Longitudinal relaxation time. Concepts Magn Reson. 1993.
Figures