4988
Measuring the Relaxivity of the Superoxide Radical1Center for Animal MRI, University of North Carolina at Chapel Hill, Chapel Hill, NC, United States, 2Biomedical Research Imaging Center, University of North Carolina at Chapel Hill, Chapel Hill, NC, United States, 3Joint Department of Biomedical Engineering, University of North Carolina at Chapel Hill, Chapel Hill, NC, United States, 4Department of Neurology, University of North Carolina at Chapel Hill, Chapel Hill, NC, United States, 5Department of Anatomy and Cell Biology, Wayne State School of Medicine, Detroit, MI, United States, 6Department of Ophthalmology, Wayne State University School of Medicine, Detroit, MI, United States
Synopsis
The excessive production of reactive oxygen species (ROS), is commonly thought to be a pathogenic factor in a range of neurodegerative diseases, psychological conditions and in the etiology of aging. Traditionally, ROS have been thought undetectable in-vivo, due to their short half-life and low concentrations in living tissue. The paramagnetism of ROS may provide a means of encoding oxidative stress into MRI data. To investigate how different concentrations of ROS contribute to MRI signals, the T1 relaxivity of ROS must be determined. Using a novel method to detect ROS in-vivo, QUEST-MRI, we show that the relaxivity of the superoxide radical is in the range between 0.135-0.509 LmM-1s-1 - similar to nitroxides used as contrast agents to detect ROS in EPR.
Introduction
The excessive production of reactive oxygen species (ROS) such as superoxides and hydroxyl free radicals, is commonly thought to be a pathogenic factor in a range of neurodegenerative diseases [1, 2, 3] and psychological conditions [4] , as well as in the etiology of aging [5]. Because MRI can, for example, image the whole brain, detecting oxidative stress with MR would be a powerful tool.
The inherent paramagnetism of ROS may provide a means of encoding oxidative stress into MRI data. Though MR insensitivity to radicals has been attributed to their short half-life and low in vivo concentrations [7], little is actually known about free radical concentrations in live brain tissue. To investigate how different concentrations of ROS contribute to MRI signals at physiological and pathological levels, the T1 relaxivity of ROS should be quantified - which would allow the detection sensitivity of MRI to ROS to be determined.
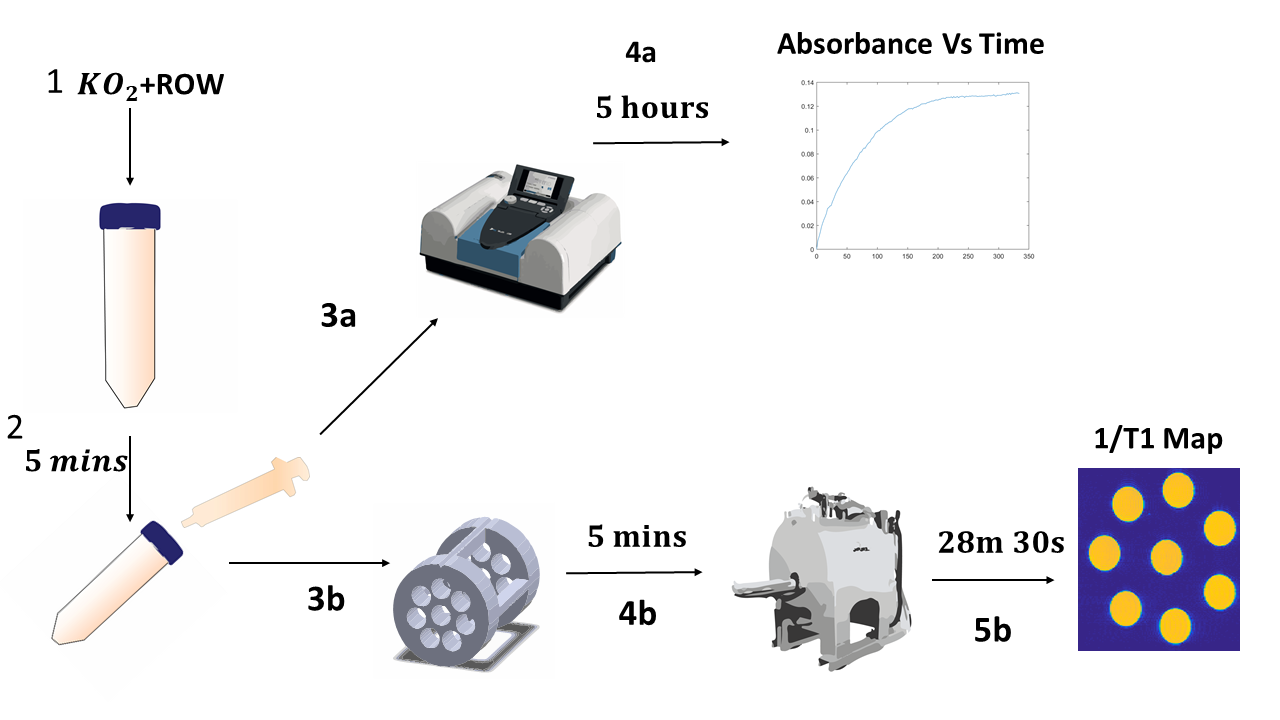
Recent studies have shown that μM-level ROS concentrations can be detected using QUEnch-assiSTed (QUEST) MRI [8]. This technique spatially maps 1/T1 decreases that result from quenching paramagnetic superoxide free radicals. One study suggests that the 1/T1 detection sensitivity is on the order of pM, with R1 values of hydroxyl free radicals exceeding those of Gd-DTPA by several orders of magnitude 9, 10. We tested the hypothesis that the R1 value of superoxide-free radicals also exceeds that of gadolinium based contrast agents. In this study, we estimated the R1 of superoxide by 1/T1 mapping in a simple system comprised of reverse-osmosis purified water (ROW) and varying concentrations of potassium superoxide (KO2). KO2 rapidly decomposes into superoxide radicals in water [11] then undergoes disproportionation, (i.e., is simultaneously oxidized and reduced [12]). To confirm superoxide detection, QUEST MRI experiments were conducted with and without superoxide dismutase13, 14, 15.
Methods
Data acquisition and analysis. Phantom relaxometry studies were performed at magnet bore temperature. To map 1/T1, a variable TR RARE sequence was used acquiring 8 images with variable TRs (11s, 8.5s, 4s, 1.8s, 0.8s,0.35s, 0.175s, 0.1s). 1/T1 maps were calculated by performing a 3-parameter curve fit using in house written scripts in MATLAB (MATLAB 2017b, The Mathworks, Natick, 2017) following the analysis procedure outlined by B.Berkowitz, et al. [8]
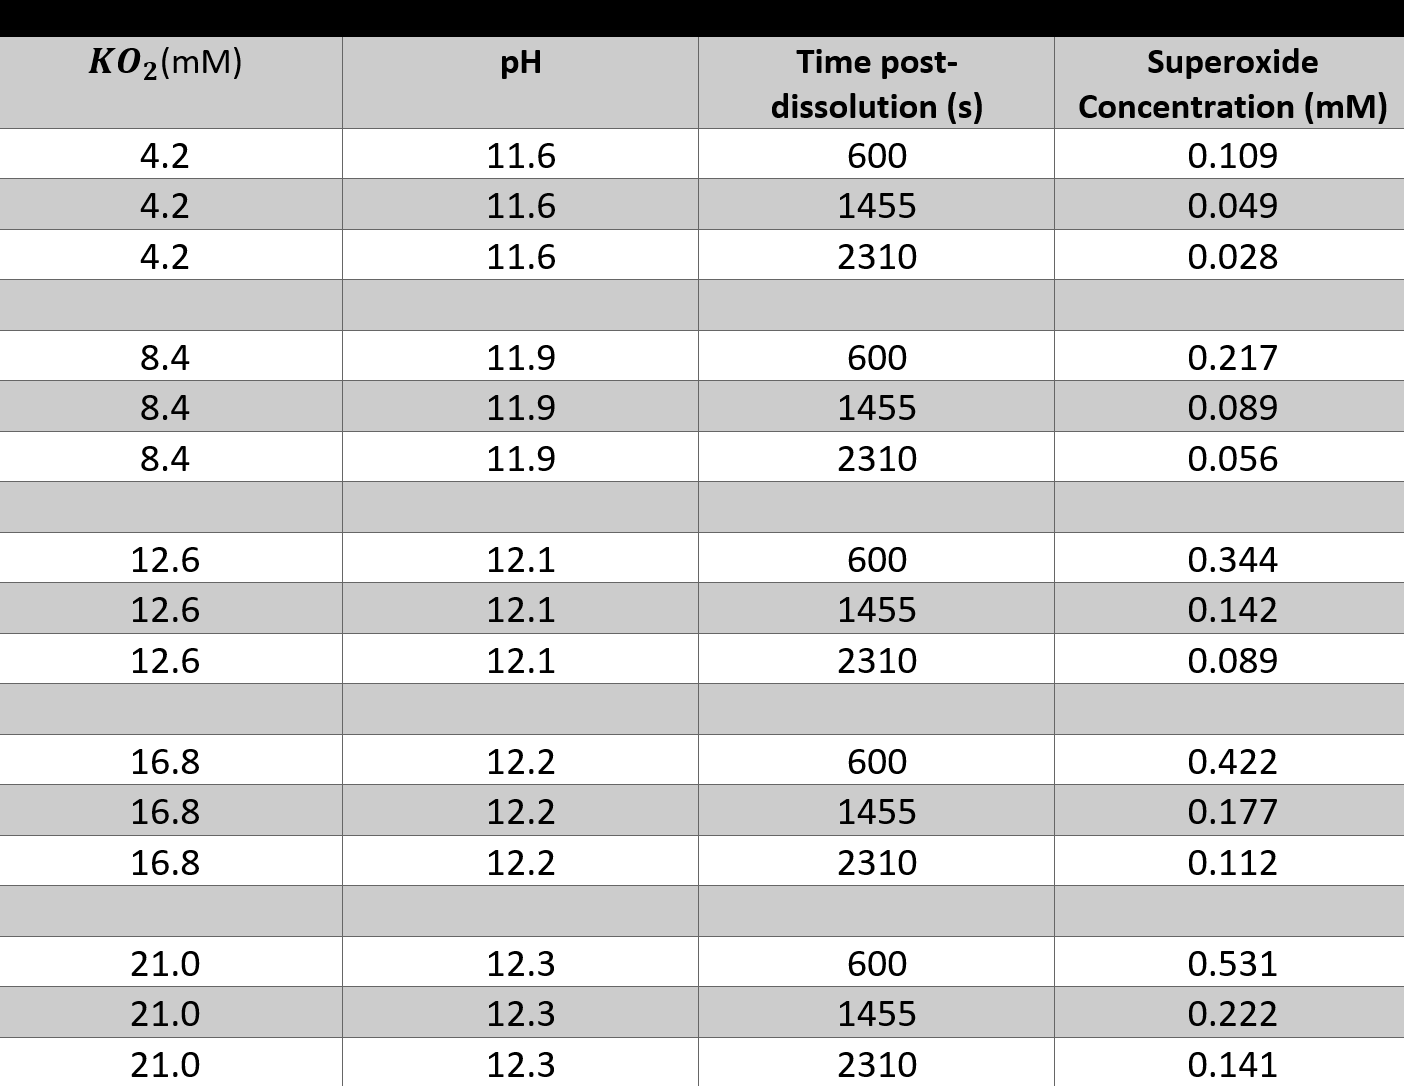
Concentration of superoxide during the scan time decreases, due to its decay. However, R1 calculation assumes a constant concentration. Therefore concentration of superoxide at three time points corresponding to the beginning (600s), middle (1455s) and end (2310s) of 1/T1 mapping were estimated by calculating the rate constant as in D.Kwon, J.Kim and J. Kwon et al. [16] for every solution concentration and modelling the decay of superoxide as a second-order reaction. Then the relaxivity of the molecule was calculated assuming the concentration at each of these three times, allowing us to report a range of plausible R1 values superoxide inherently has.
Results and Discussion
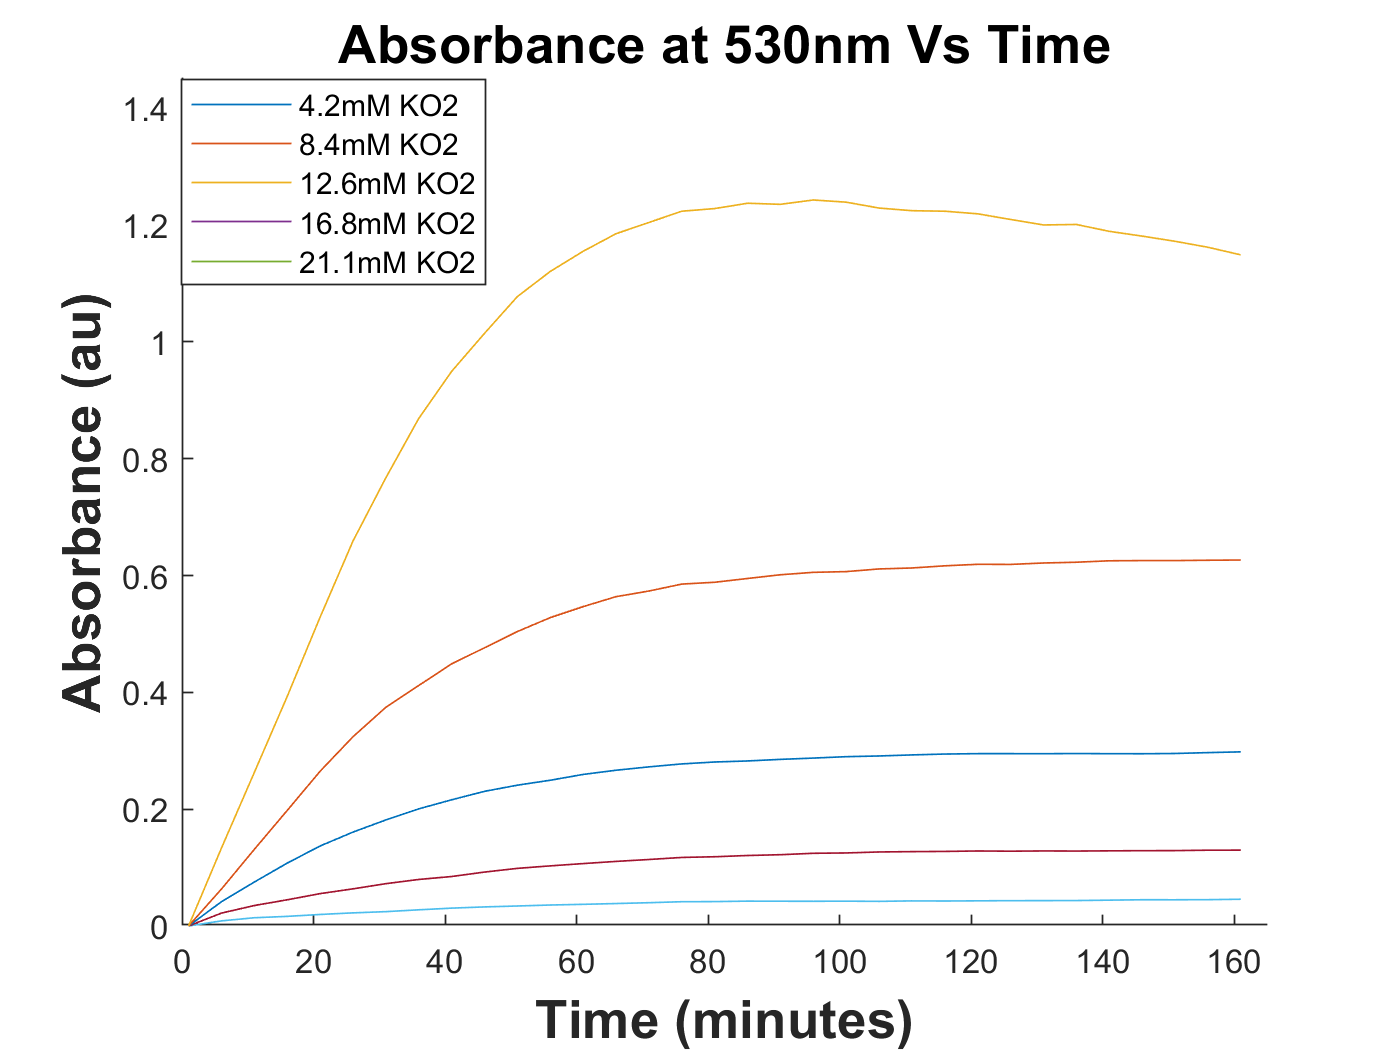
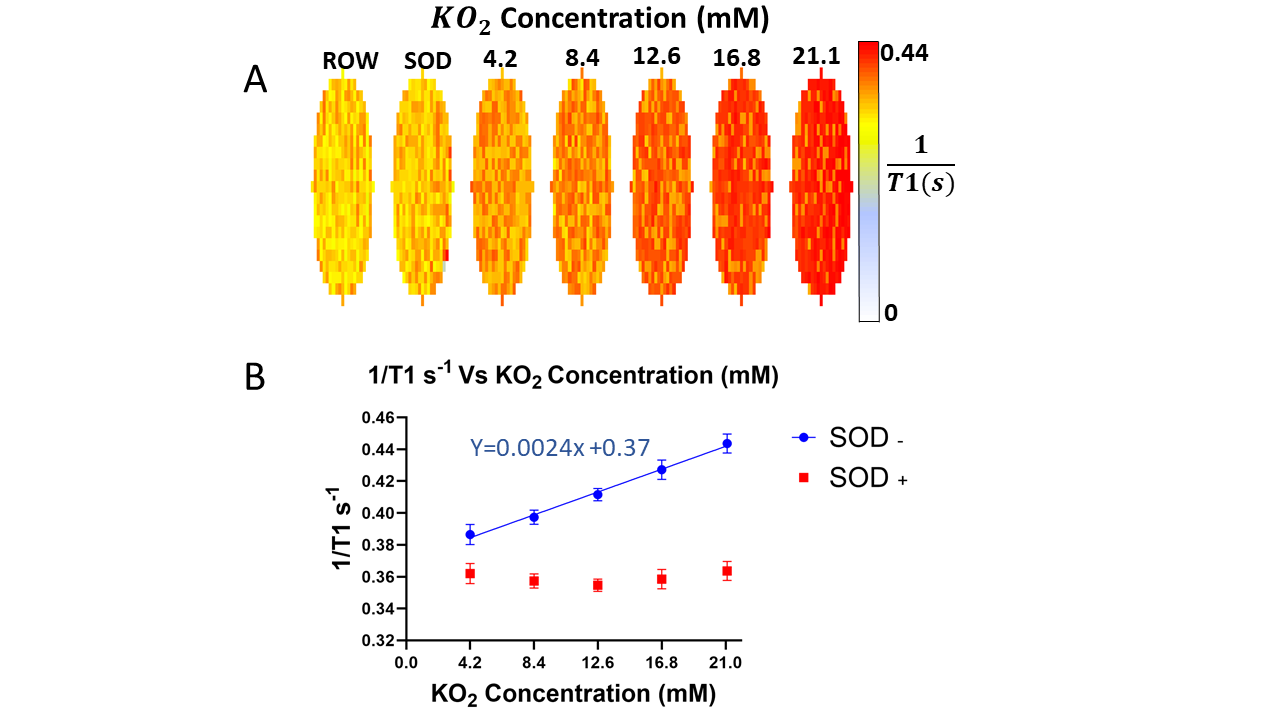
Figure 2 shows plots of absorbance at 530nm, used in the assay to prove production of superoxide. A strong linear relationship between 1/T1 and KO2 concentration was observed (Figure 3). The reaction of with water yields paramagnetic oxygen [20], as does the spontaneous disproportionation of superoxide [18]. Therefore, to confirm the superoxide contribution to the observed change in 1/T1, SOD was added to the reaction mixture to remove the contribution of superoxide (but not oxygen) to 1/T1 . Addition of SOD to the reaction mixture brought ROS levels back to baseline for all KO2 concentrations. This, along with the spectrophotometer experiments, proved all change in 1/T1 in the phantoms could be attributed to superoxide. Figure 4 shows the estimated superoxide concentration at various time points post-dissolution, which is also a function of concentration and pH of the solution. Assuming superoxide concentrations at the beginning and end of scanning (600 and 2310s post-dissolution respectively), R1 of superoxide was calculated to be within in the range 0.135-0.509 LmM-1s-1 (Figure 5). These findings are different than that suggested for for the hydroxyl radical 16 ; more work is needed to understand the source of that difference. Also, the calculated R1 of superoxide is an order of magnitude smaller than that of gadolinium based contrast agents, with an R1 of ~4Lmm-1s-1, at clinical field strengths [21]. Our estimated R1 range of superoxide falls within that of nitroxides, 0.2LmM-1s-1 , used as spin traps and contrast agents for the detection of free radicals [22].Conclusion
Our results show that the relaxivity of superoxide, is in the range 0.135-0.509 LmM-1s-1 - thus detectable with MRI. The reported relaxivity of superoxide is less than that of gadolinium based contrast agents and significantly lower than that reported for the hydroxyl radical, but of the same magnitude as nitroxides.Acknowledgements
We thank members of the CAMRI for valuable discussions concerning the studies described in this abstract. The authors are supported by NIH R01NS091236, RF1MH117053, R01MH111429, R41MH113252, U01AA020023, R01AA025582, U54HD079124, and American Heart Association 15SDG23260025.
National Institutes of Health RO1 EY026584 and RO1 AG058171 to Dr. Bruce Berkowitz.
References
[1] M. Smith, S. Taneda, P. Richey, S. Myata, S. Yan, D. Stern, L. Sayre, M. V.M and G. Perry, "Advanced Maillard reaction end products are associated with Alzheimer disease pathology," Proc Natl Acad Sci, vol. 91, no. 12, pp. 5710-5714, 1994.
[2] W. Dauer and S. Przedborski, "Parkinson’s Disease: Mechanisms and Models," Neuron, vol. 39, pp. 889-909, 2003.
[3] E. Hall, J. Oostveen and M. Gurney, "Relationship of microglial and astrocytic activation to disease onset and progression in a transgenic model of familial ALS," Glia, vol. 23, pp. 249-256, 1998.
[4] S. Salim, "Oxidative Stress and Psychological Disorders," Current Neuropharmacology, vol. 12, no. 2, pp. 140-147, 2014.
[5]W. A.P, "Ageing and the Free Radical Theory," Respiration Physiology, vol. 128, no. 3, pp. 379-391, 2001.
[6] B. A. Berkowitz, "Oxidative stress measured in vivo without an exogenous," Journal of Magnetic Resonance, vol. 291, pp. 94-100, 2018.
[7] H. P. Grill, J. L. Zweier, P. Kuppusamy, M. Weisfeldt and J. T. Flaherty, "Direct Measurement of Myocardial Free Radical Generation in an In Vivo Model: Effects of Postischemic Reperfusion and Treatment With Human Recombiant Superoxide Dismutase," JACC, vol. 20, no. 7, pp. 1604-1611, 1992.
[8] B. Berkowitz, J. Lenning, N. Khetarpal, C. Tran, J. Wu, A. Berri, K. Dernay, M. Haacke, F. Shafie-Khorassani, R. Podolsky, J. Gant, S. Maimaiti, O. Thibault, G. Murphy, B. Bennett and R. Roberts, "In vivo imaging of prodromal hippocampus CA1 subfield oxidative stress in models of Alzheimer disease and Angelman syndrome," The FASEB Journal, vol. 31, pp. 4179-4186, 2017.
[9] P. Getsov, Z. Z, I. Aoki and R. Bakalova, "New Hypothesis and Alternative Approach for Imaging Neuronal Function and Metabolic Activity Based on Redox-Status," Balkan Medical Journal, vol. 35, no. 3, pp. 289-291, 2018.
[10] R. Tain, A. Scotti, W. Li, X. Zhouz and K. CAI, "Imaging short‐lived reactive oxygen species (ROS) with endogenous contrast MRI," Journal of Magnetic Resonance Imaging, vol. 47, pp. 222-229, 2017.
[11] M. Haayan, M. Hashim and M. AlNashef, "Superoxide Ion: Generation and Chemical Implications," Chemical Reviews, vol. 1116, no. 5, pp. 3029-3085, 2016.
[12] B. H. Bielski and A. O. Allen, "Mechanism of the Disproportionation of Superoxide Radicals1," The Journal of Physical Chemistry, vol. 81, no. 11, pp. 1048-1050, 1977.
[13] B. Berkowitz, B. Bredell, C. Davis, M. Samartdzija, C. Grimm and R. Roberts, "Measuring In Vivo Free Radical Production by the Outer Retina," Investigative Ophthalmology & Visual Science, vol. 56, pp. 7931-7938, 2015.
[14] B. Berkowitz, R. Podolsky, B. Farrell, J. Lee, C. Trepanier, A. M. Berri, K. Dernay, E. Graffice, F. Shfie-Khorassani, T. Kern and R. Roberts, "D-cis-Diltiazem Can Produce Oxidative Stress in Healthy," Investigative Ophthalmology & Visual Science, vol. 59, no. 7, pp. 2999-3010;, 2018.
[15] B. Berkowitz, R. Podolsky, J. Lenning, N. Khetarpal, C. Tran, J. Wu, A. Berri, K. Dernay, F. Shafie-Khorassani and R. Roberts, "Sodium Iodate Produces a Strain-Dependent Retinal Oxidative Stress Response Measured In Vivo Using QUEST MRI," Inverstigative Opthalmology, vol. 58, no. 7, pp. 3286-3293, 2017.
[16] D. Kwon, J. Kim and J. Kwon, "An Advanced Kinetic Method for HO2∙/O2 Determination by Using Terephthalate in the Aqueous Solution," Environmental Engineering Research, vol. 17, no. 4, pp. 205-210, 2012.
[17] J. Manganaro, "Oxygen generation By The Reaction Of Potassium Superoxide and Sea Water," Industrial & Engineering Chemistry Process Design and Development, vol. 9, no. 1, pp. 1-4, 1970.
[18] M. Rohrer, H. Bauer, J. Mintorovitch, M. Requardt and H. Weinmann, "Comparison of Magnetic Properties of MRI Contrast Media Solutions at Different Magnetic Field Strengths," Investigative Radiology, vol. 40, no. 11, pp. 715 - 724, 2005.
[19] H. Fujii, X. Wan, J. Zhong, L. Berliner and K. Yoshikawa, "In vivo imaging of spin-trapped nitric oxide in rats with septic shock: MRI spin trapping.," Magnetic Resonance in Medicine , vol. 42, no. 2, pp. 235-239, 1999.
[20] M. Mittal, M. Siddiqui, K. Tran, S. Reddy and A. Malik, "Reactive oxygen species in inflammation and tissue injury.," Antioxidants & Redox Signalling , vol. 20, no. 7, pp. 1126-1167, 2014.
[21] D. Lurie, L. H, P. S and J. Zweier, "Development of a PEDRI free-radical imager using a 0.38 T clinical MRI system.," Magnetic Resonance in Medicine, vol. 47, no. 1, pp. 181-186, 2002.
[22] J. Zweier and P. Kuppusamy, "Electron paramagnetic resonance measurements of free radicals in the intact beating heart: a technique for detection and characterization of free radicals in whole biological tissues.," Proceedings of the National Academy of Sciences of the United States of America, vol. 85, no. 15, pp. 5703-5707, 1988.
Figures