4987
Manganese-based macrocyclic chelates as a potential novel MRI contrast agent – relaxometry & imaging1Department of Diagnostic Physics, Oslo University Hospital, Oslo, Norway, 2GE Healthcare Life Sciences, Chalfont St Giles, United Kingdom, 3GE Global Research, Niskayuna, NY, United States, 4Department of Physics, Oslo University, Oslo, Norway
Synopsis
In this study, novel Manganese-based contrast agents (MnCAs) were evaluated by relaxometry techniques (NMR and phantom imaging) and tested in naïve pigs using a contrast-enhanced MRA protocol and compared to the well-established agent GdDOTA. Despite some differences in T1 and T2 relaxation performance, both MnCAs and GdDOTA provided strong vascular T1-enhancement in naïve pig imaging thus providing initial evidence that MnCAs could be utilized for a clinical application.
Purpose
The aim of this study was to evaluate the efficiency of two new macrocyclic Mn-based contrast agents in terms of T1 and T2 relaxivity assessed by NMR relaxometry and phantom imaging on clinical MRI scanners, and by proof-of-principle in vivo imaging in a porcine model using a standard clinical MRA protocol.Methods
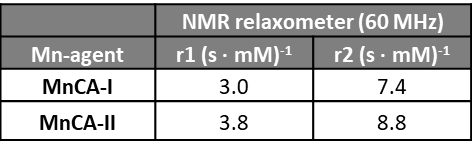
NMR relaxometry
T1 and T2 relaxation times were measured in human serum (BioreclamationIVT, Cat# HMSRM-M, 5) as a function of contrast agent concentration (0-5 mM) for two novel Mn-based chelates; MnCA-I and MnCA-II. The relaxation measurements were performed at 40°C using a Minispec Mq benchtop NMR relaxometer (Bruker Instruments, Rheinstetten, Germany) operating at 60 MHz (1.4T) with an inversion recovery (IR) 10-pulse sequence. The Mn concentrations were measured by inductively coupled plasma optical emission spectrophotometry (ICP-OES).
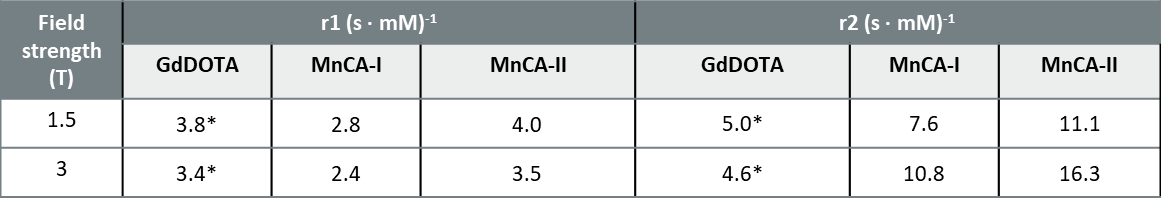
Phantom imaging
An in-house insulated 3D-printed phantom holding 4x4 test tubes in a water bath, pre-heated and stabilized at 39°C before the MRI experiment was used. Imaging was performed on clinical scanners at 1.5 T (GE MR 450) and 3 T (GE MR750). A range of CA concentrations in bovine serum with expected T1 values in the range 100-1000 ms [1] were prepared for GdDOTA (gadoterate), MnCA-I and MnCA-II. The Gd and Mn concentrations were measured by ICP mass spectrometry (ICP-MS) and ICP-OES, respectively. T1 was measured using a single slice IR fast spin-echo (IR-FSE) sequence with TI= [50, 100, 150, 200, 400, 800, 1600, 3200, 4000] ms and TR=5000+TI. T2 was measured using a single slice single-shot spin echo (SS-SE) sequence with TR=4500 ms and TE= [10, 20, 50, 100, 250, 450] ms.
In the two above studies, the T1 and T2 relaxivities (r1, r2) were determined from a linear least-squares regression analysis of the reciprocal of T1 and T2 relaxation times (R1, R2) versus CA concentration.
In-vivo imaging
As proof-of-principle three female domestic pigs (52 ± 5 kg) were imaged with a breath-hold 3D MR angiography sequence, covering the kidneys and abdominal region. Imaging was performed at 3 T (Philips Ingenia). One pig each received a standard dose (0.1 mmol CA/kg) of GdDOTA, MnCA-I or MnCA-II, respectively, injected as a bolus (3 mL/sec) using a power injector. The animal experiments were approved by the Norwegian Food Safety Authority.
Results
The T1 and T2 relaxivities assessed by NMR relaxometry and MRI are summarized in Tables 1 and 2. Overall, for the MnCAs and at a given magnetic field strength there was a good agreement between T1 relaxivity values obtained by both methods. The Mn-based agents differed from GdDOTA by exhibiting higher T2 relaxivity which was also found to increase with increasing field strength. The r2/r1 ratio of MnCAs increased markedly with increasing field strength. The standard deviations of MRI determined relaxation times (T1 and T2) from curve fits were within 1-2 %, also the goodness of fit (R2) for the relaxivities (r1 and r2) was above 0.99 for all the CAs (Table 2). The r1 and r2 values of GdDOTA were in agreement with literature values [2].
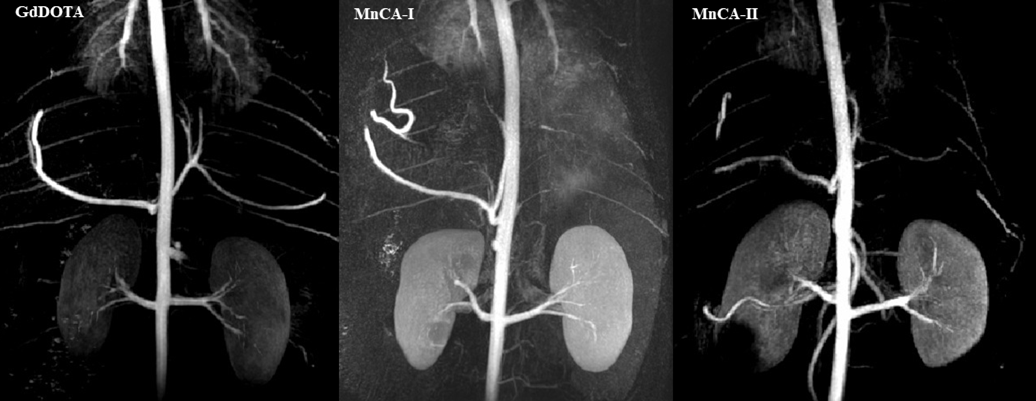
In vivo testing at 3 T MRI revealed strong and comparable vascular enhancement for both MnCAs and GdDOTA in a porcine model. The contrast-enhanced MRA (CE-MRA) was captured during bolus injection of contrast (10 to 40 secs post injection) and reconstructed into a maximum intensity projection (MIP) of the renal territory (Figure 1).
Discussion
The differences in T1 relaxivity by NMR and MRI are mainly due to higher uncertainty using clinical MRI scanners for relaxometry, which are more prone to field inhomogeneities and gradient errors. Even though time consuming T1 and T2 mapping methods were used, there is higher uncertainty in these measurements vs. those using a NMR relaxometer [2]. Also, some deviation may be due to differences in field strength (1.4 T vs 1.5 T), serum types and sample temperatures. The MnCAs had comparable T1 relaxivity to GdDOTA but differed markedly by exhibiting a higher T2 relaxivity which also increased with increasing field strength – the latter is explained by a significant scalar contribution [3]. The in vitro findings showed relevance to the in vivo assessment, in which all agents exhibited strong and comparable vascular enhancement in T1-weighted MRA with routine clinical parameters.Conclusion
Two Mn-based macrocyclic CAs have been evaluated by using NMR, phantom imaging, and in-vivo imaging in naïve pigs and compared to the established agent GdDOTA. Despite some differences in relaxation performance, both MnCAs and GdDOTA provided strong vascular T1-enhancement in naïve pig imaging thus providing initial evidence that MnCAs could be used for clinical applications.Acknowledgements
Janell Crowder: ICP-OES on NMR relaxometry samples
Ivar Martinsen: ICP-OES on MRI relaxometry samples
References
- Sheen et al., T1 relaxivities of gadolinium-based magnetic resonance contrast agents in human whole blood at 1.5, 3, and 7 T, Investigative Radiology, 2015, 50:5, 330–338
- Rohrer et al., Comparison of magnetic properties of MRI contrast media solutions at different magnetic field strengths, Investigative Radiology, 2005, 40:11, 715-724
- Caravan P et al., Influence of molecular parameters and increasing magnetic field strength on relaxivity of gadolinium -and manganese-based T1 contrast agents, Contrast Media Mol. Imaging, 2009, 4; 89-100.
Figures